PROFILING METABOLIC STRESS IN MEDIEVAL DENMARK: AN ANALYSIS OF INTERNAL AND EXTERNAL ENAMEL DEFECTS
Marianne E. Reeves
A dissertation submitted to the faculty of the University of North Carolina at Chapel Hill in partial fulfillment of the requirements for the degree of Doctor of Philosophy in the
Department of Anthropology
Chapel Hill 2013
Approved by:
ABSTRACT
MARIANNE E. REEVES: Profiling Metabolic Stress in Medieval Denmark: An Analysis of Internal and External Enamel Defects
(Under the direction of Dale Hutchinson)
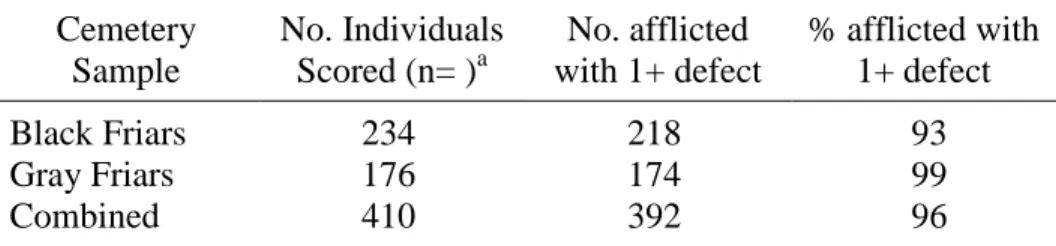
The purpose of this study was to assess the prevalence of both types of enamel defects and to determining the timing of each, based on a population-specific model of permanent mandibular canine crown growth (after Simpson, 1999). Analysis of n=410 canine teeth from two Catholic friary cemeteries in medieval Denmark, the Black and Gray Friars, revealed that 96% of individuals had 1 or more surface defects. In a subsample of n=63 thin-sectioned canines, only 25% showed evidence of 1 or more pathological striae. The population model revealed a non-linear pattern of canine crown growth, with growth slowing as the cervix was reached. Duration of crown growth was found to be 50.6 months, shorter than in some previous estimates for modern humans. The peak prevalence of
microdefects occurred between 20 and 40 months, overlapping with surface defects, but also occurring in infancy prior to one year of age. Overall, it was found that: (1) PS did occur in infancy, expanding the stress profile window to include the earliest period of canine growth, (2) PS prevalence was unexpectedly lower and surface defects, higher, than in other
growth in an extremely tumultuous time in Danish history. Likely to have been critical in causing acute and chronic stress in Denmark are not only waves of infectious disease, but also the periodic famines throughout the medieval period. Weaning stress (including weanling diarrhea) is also a likely candidate for growth disruption in the samples analyzed here, as weaning represents a significant dietary transition in infants and toddlers.
ACKNOWLEDGEMENTS
TABLE OF CONTENTS
LIST OF TABLES ... viii
LIST OF FIGURES ...x
I. INTRODUCTION ...1
Defining the Research Problem ...1
Significance of the Research Problem ...15
Solving the Research Problem ...16
II. REVIEW OF THE LITERATURE ...18
Normal Enamel Growth ...18
Evidence of Growth Disruption: Enamel Defects ...23
III. METHODS ...32
Subjects and Site history ...32
Research Design...39
Analysis...42
Analysis: Comparison with Published Summary Data ...45
IV. RESULTS ...47
Overall Demographic Structure of the Cemeteries ...47
Prevalence of Enamel Defects ...47
Mandibular Canine Development: A Model...50
Establishing Timing of Enamel Defects ...51
V. DISCUSSION ...55
Overview of Main Findings ...55
Medieval Scandinavian Disease Environment ...62
The Lives of Medieval Children in Northern Europe ...66
Conclusions ...72
APPENDICES ...79
LIST OF TABLES
Table
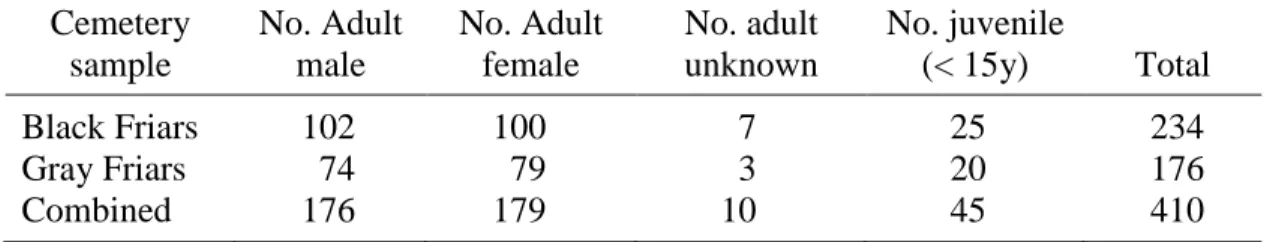
1. Sex and age of individuals from both cemeteries scored for
surface defects ...79
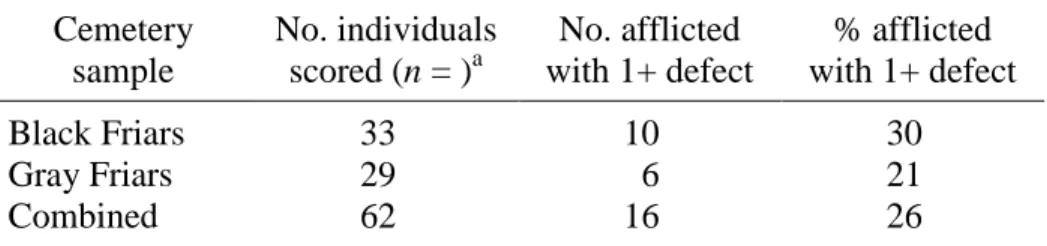
2. Surface Defect Prevalence per Cemetery Sample ...80
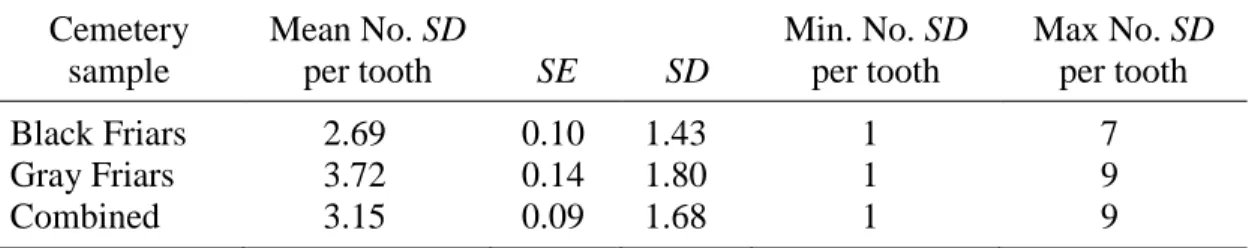
3. Surface Defect Prevalence per Afflicted Teeth ...81
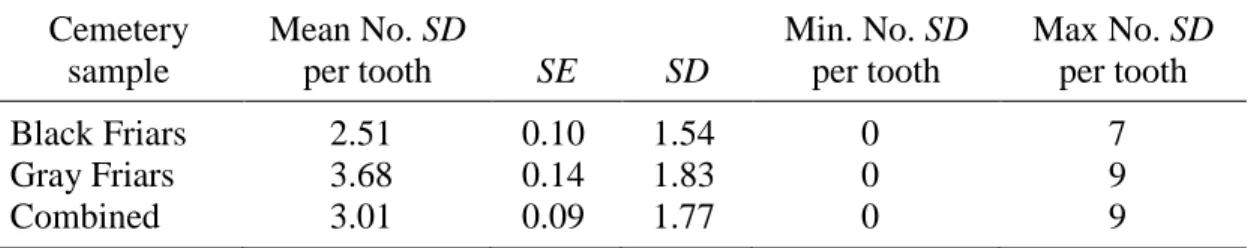
4. Surface Defect Prevalence per All Teeth Scored ...82
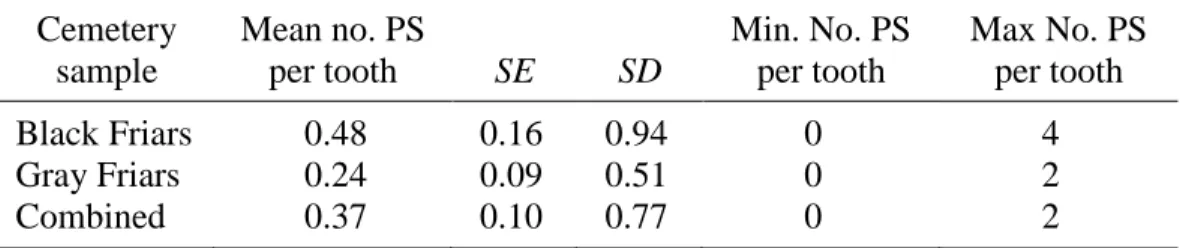
5. Pathological Stria (PS) Prevalence per Cemetery Sample ...83
6. Pathological Stria (PS) Prevalence per Afflicted Teeth ...84
7. Pathological Stria (PS) Prevalence per All Teeth Scored ...85
8. Sample canines comprising the population model for canine growth ...86
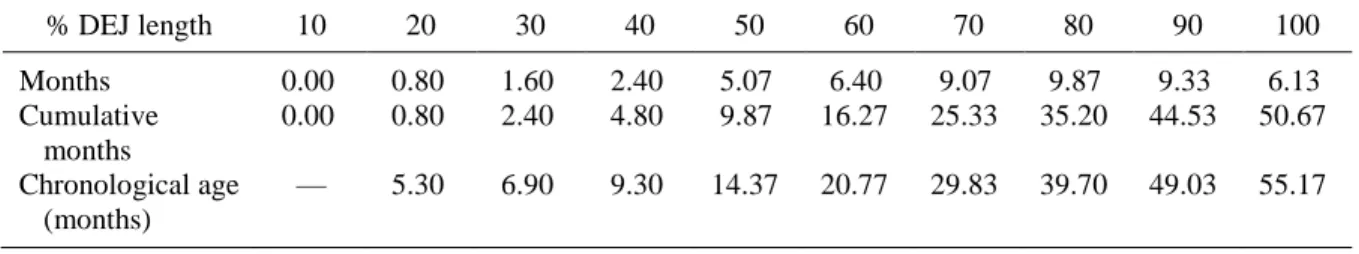
9. Striae of Retzius counts in 10% percent increments of DEJ crown height ...87
10. Canine crown development timing based on population model from Gray and Black Friars Samples ...88
11. External and internal positions (mm) of striae of Retzius in the Black Friars sample ...89
12. External and internal positions of striae of Retzius in the Gray Friars sample ...93
13. Distance functions for each sample and combined samples ...95
14. External and converted internal locations (mm) of enamel surface defects (SD) in the Black Friars dental sample using the regression formula developed from Black Friars striae of Retzius data ...96
15. External and converted internal locations (mm) of enamel hypoplasias in the Gray Friars sample ...102
17. Absolute locations of pathological striae (PS) in the Gray
LIST OF FIGURES
Figure
1. Drawing of the Black Friars monastery area excavations in Odense, DK from between 1972 and 1981. Stipled lines indicate monastery buildings, including the former church to the southwest. Skeletal individuals are denoted in a roughly square area around the former church, extending eastward.
Printed after Becher, 1999. ...109 2. Drawing of the excavated areas at the Gray Friars monastery
area (in black) in 1982 and 1990, including looted areas
(stippled) and foundations (gray)...110 3. Photomontage of the labial mandibular canine enamel of
SBT81-015, a 13 year old juvenile from the Black Friars monastery assemblage. The DEJ was divided in deciles, and intersecting SOR were counted in each decile to determine the
total number of SOR. ...111 4. Photomontage of labial mandibular canine enamel of
SBT-81-137, a juvenile aged 13.5 years (+/- 1.5 years). Cuspal striae are clearly seen, as are darkened striae of Retzius. None were associated with extreme rod disorganization at higher
magnification. Image taken at magnification of 40x. ...112 5. Sex and age of the skeletal individuals (n=455) making up the
Gray Friars cemetery sample. ...113 6. Sex and age of the skeletal individuals (n=557) making up the
Black Friars cemetery sample. ...114 7. Hypoplastic defects (lines and pits) on the labial enamel of the
left mandibular canine. The angular attrition to the cusp precludes scoring of the first-formed lateral enamel for surface
defects. ...115 8. A thin section image of a pathological stria in at the leading
edge of an enamel hypoplasia in GP90-304, a female age 45
9. Scanning electron micrograph (SEM) of a pathological stria in a thick section from SBT-81-056, a juvenile age 11.5 years (+/- .5 years). Rod disruption occurs at the bottom left of the image (cervical end) and runs to the top right (cuspal end). The rod on the right side of the image are disorganized and have a melted
appearance. The image was taken at a magnification of 1000. ...117 10. Growth rate in the mandibular canines chosen for the
population model. The number of striae of Retzius per 10% increment is similar in each tooth. There is a general increase in the number of SOR as the cervix is reached, indicating that crown elongation is fastest at the beginning of development
and slows as growth proceeds. ...118 11. The timing of the development based on the population model.
The number of months for development is generally increases as the cervix is reached. The dropoff at the 90th percentile reflects difficulty in seeing and counting SOR in the most
cervical regions of the teeth. ...119 12. Non-linear growth in the population model of crown
development. ...120 13. Distance function data for determining internal locations of
external structures for the Black Friars sample. Note that the relationship between the internal and external positions of striae of Retzius is curvilinear. The regression equation that
describes the relationship is y = -.353 + .970x - .027x2. ...121 14. Distance function data for determining internal locations of
external structures for the Gray Friars sample. Note that the relationship between the internal and external positions of striae of Retzius is curvilinear. The regression equation that
describes the relationship is y = -.038 + .831x - .009x2. ...122 15. Distance function data for determining internal locations of
external structures for the both samples combined. Note that the relationship between the internal and external positions of striae of Retzius is curvilinear. The regression equation that
describes the relationship is y = -.052 + .832x - .011x2. ...123 16. Mean absolute location of pathological striae (PS) in
millimeters in both cemetery samples. The Gray Friars sample mean is 4.68mm, while the Black Friars is 4.61mm. The
17. Mean relative locations of pathological striae (PS) by cemetery affiliation. The combined mean for both cemetery samples is
0.68. ...125 18. Distribution of surface defects in the Black Friars cemetery
sample. Surface defects are most prevalent in 60-70% DEJ crown height, and few to no defects were recorded before the
40th percentile. ...126 19. Distribution of surface defects in the Gray Friars cemetery
sample. Surface defects are most prevalent in the 60-80% of DEJ crown height. Few to no defects were recorded in the
cuspal 40th percentile. ...127 20. Prevalence of pathological striae (PS) in the Gray Friars
sample in 10 percent increments along the DEJ. Prevalence
peaks at the 50-60th and 70-80th percentiles. ...128 21. Prevalence of pathological striae (PS) in the Black Friars
sample in 10 percent increments along the DEJ. Prevalence
CHAPTER I
INTRODUCTION DEFINING THE RESEARCH PROBLEM
The purpose of this dissertation is to determine how metabolic stress impacted early childhood growth in a sample of skeletal individuals from medieval Denmark (ca. A.D. 1250-1539). Studies of growth disruption provide a window onto the variation in the human response to metabolic stress and better insight into its etiologies. The consequence of the morbidity and mortality of medieval children went beyond loss to their immediate families; economic loss was felt as well, as children in towns left their households as early as age 10 years for full-time labor as servants or apprentices (Orme, 2001; Hanawalt, 1993). Moreover, evidence from clinical and bioarcheological studies suggests that stress impacts not only the health and well-being during childhood, but it continues to negatively affect physiological resiliency into adulthood (Swärdstedt, 1966; Cook and Buikstra, 1979; Rudney, 1983; Goodman and Armelagos, 1988; Goodman, 1991; Simpson et al., 1990; Duray, 1996). Disease and nutritional stress are often implicated in the etiology of non-specific stress markers in human skeletal material (see Larsen, 1999). The medieval children in the town of Odense, DK lived in conditions that included a high residential population density, a
rudimentary sewage disposal system that ran along town streets, shared water sources and limited access to hot water for cleaning and bathing, and a pre-antibiotic system of medical care – all of which contributed to the likelihood of infectious disease transmission.
famines in the 14th century, which eventually led to a shift in diet to a greater dependence on meat and dairy products (Skaarup, 1978).
The primary contribution of this research is methodological. Specifically, “hidden” cuspal enamel is assessed for microdefects of enamel, along with the macrodefects visible from the enamel surface. This is crucial because it illuminates a period in early childhood that is often left out of bioarchaeolgoical studies of dental stress. This study also makes use of a population-specific model for enamel growth after Simpson (1999) to overcome issues error in enamel growth and disruption timing. But it does so in a way that relies on a small sample size for the model and minimizes destruction to dental samples.
While these methodological issues are important in themselves, they are more significant for allowing accurate assessment of growth disruption in the Odense friary samples. This biological data gives us valuable information about childhood health in Denmark in an extremely tumultuous time during Danish history with numerous infectious diseases, including the Black Death, multiple famines, farm abandonments, and the social and economic upheavals that resulted from all of these disasters.
enamel internally. Quantifying the prevalence and timing of these two types of defects provides a gross measure of the level of non-specific metabolic stress experienced by children and, in turn, gives a proxy for the overall stress level of the population (Rose et al., 1985; Goodman and Rose, 1990; Wright, 1997; Simpson, 1999). The research presented here tests suppositions that young medieval children: (1) experienced comparatively high levels of both acute and chronic metabolic stress resulting in the disruption of normal enamel growth, (2) that disruption occurred commonly in infancy, expanding the age range of susceptibility to stress to include the earliest years of childhood, and (3) that the pattern of enamel growth and pathological disruption is unique to the study sample and not indicative of a pan-human pattern of normal growth and stress response. If these hypotheses are supported, they will provide clearer insights into not only the etiology of the stressors affecting medieval children, but also into the range of variation in human crown growth and disruption. A more complete exposition of these hypotheses and presuppositions that support them follows.
Hypothesis 1
The first hypothesis was that children experienced comparatively high levels of enamel growth disruptions as a result of the metabolic stressors commensurate with an aggregate urban lifestyle.
Presupposition 1
Disease and undernutrition are often products of poor socioeconomic status in living groups, and a similar connection has been demonstrated in archaeological populations.
Growth disturbance as measured by prevalence of pathological striae of Retzius has also been associated in skeletal samples with infectious disease. In a study of a skeletal series representing the Meroitic (100 B.C. – A.D. 300) and X-Group (A.D. 300-600) cultural horizons in Lower Nubia, Rudney (1983) found a negative correlation between age at death and PS prevalence, indicating that those who died young were more susceptible to early growth disturbance than those surviving to adulthood. Additionally, childhood health appears to have improved over time from the Meoritic to X-Group periods, perhaps due to changes in political structure, consumption of tetracyclines, or changes in irrigations techonology that affected the prevalence of helminthic infections. Wright (1990) hypothesized that the increase in prevalence of pathological striae and shallow enamel hypoplasias from the Postclassic to Historic period Mayan skeletal groups is related to an increase in parasitic pathogens in the Historic period.
Like disease stress, hypoplasias and pathological striae have been positively correlated with malnutrition in clinical and skeletal studies. Goodman et al. (1991) argued that undernutrition is causally linked to enamel hypoplasia formation, based on their study defects in Aztec adolescents living in Mezonteopan, Mexico. The authors found linear enamel hypoplasia (LEH) prevalence in the range of 65% to 84% in children without
et al. 1979; Simpson 1999). Rose et al. (1978) predicted that stress, as indicated by pathological striae, infectious disease lesions, and lower-age-at death, would increase in prehistoric skeletal samples over time in proportion to increasing dependence on maize agriculture, higher residential population densities, increased trade, and greater complexity of social organization. The three skeletal samples from the prehistoric Dickson and Gibson Mounds, Illinois, representing the Middle Woodland, Late Woodland, and Mississippian time periods, showed pathological stria prevalences of 10.3%, 21.4%, and 40.0% respectively, in support of the authors hypotheses. Simpson (1999) found that stress as measured by
microstructural defects increased from the prehistoric to the mission period in northern Florida, in prevalences of 48% (summed prehistoric), 54% (early contact), and 83% (mission samples).
Presupposition 2
The second presupposition was that the distribution of hypoplasias and pathological striae would often be different, indicating that the defects have different etiologies and represent chronic and acute stress, respectively. Studies by Condon (1981), Rose et al.
(1985), Wright (1990), and Simpson (1999) found that the distribution of enamel hypoplasias and pathological striae differed significantly in skeletal samples and, therefore, likely
co-term stress while pathological striae were indicative of shorter, more acute periods of stress. Wright (1990) found similar results, with hypoplasias and Wilson bands co-occurring at a rate of 23% (and Wilson bands co-occuring with hypoplasias at a rate of 51%) in Mayan samples from Lamanai, Belize. Wright notes that morphological differences in the defects suggest different etiologies, although Rose et al. (1985) concluded that the relationship between the defect types is not always clear. In terms of structure, pathological striae are marked by a brief disruption in prism structure lasting several days; while hypoplasias are produced by a slowing of ameloblast secretion, resulting in thinner enamel with normal imbricational striae converging in the defect (although see Hillson and Bond, 1997). Condon and Rose (1992), Goodman and Rose (1992) and Goodman and Armelagos (1985a,b) argue that that differences in susceptibility to dental defects occurs both within and between tooth types. Goodman and Armelagos (1985a) suggest that biological gradients in susceptibility to disruptions of ameloblasts exist between tooth types. Specifically the expression of
angles do influence hypoplasia expression in great apes and humans (acute angles resulting in fewer identifiable surface defects).
Presupposition 3
The third presupposition was that the conditions of aggregation concomitant with urbanization would be associated with an increase in stress prevalence; these conditions were present in medieval Odense. Larsen and colleagues have clearly demonstrated that an
increase in aggregation associated with the adoption of farming and increased consumption of processed foods and refined carbohydrates, along with decreased physical activity, results in a decrease in health status. This evidence is intimately connected to evidence for increase in skeletal pathologies resulting from infectious diseases (Hutchinson and Larsen, 1990; Larsen, 1997).
Aggregate town life is an extreme on the continuum of population aggregation.1 The relationship between increased population size and distribution and a decrease in overall health has been demonstrated in archaeological populations from Europe, and North America. Urban environments exacerbate certain types of disease proliferation and
transmission (Betsinger, 2007; Roberts, 2000). Archaeological remnants of Odense’s walls and structures have helped to establish that the town was walled, separating it from the surrounding countryside. Residents lived in houses in close proximity to one another, often also in close proximity to with animals and with an omnipresent risk of water contamination.
Perhaps even more informative is the historical data on periodic famine, and infectious disease like the Black Plague, which arrived in Denmark in A.D. 1348 and was succeeded by
numerous smaller outbreaks. Other infectious disease such as tuberculosis, smallpox (Hays, 1998), and leprosy (Anderson, 2000) were also prevalent during the time period.
Making a dietary argument for a medieval town is more difficult because towns acted as markets for local farmers as well as for the importation of foreign goods (e.g., spices and fruits). While the Danish burghers’ diet was grain-based, a variety of foods was available to those who had access to them. The diets of infants and young children were certainly milk and grain-based and are detailed in Chapter 5.
Hypothesis 2
The second hypothesis was that acute stress episodes resulting in growth disruption occurred in early infancy. This hypothesis is based on identifying pathological striae in "hidden" cuspal enamel. Evidence supporting this hypothesis would expand the age range of susceptibility to stress to include the earliest years of childhood.
Presupposition 1
to approximately 4.5 months. It is important to note that the growth model used in these studies is based on equal divisions of crown height corresponding to chronological ages, inferring that crown growth is a linear process.
A tooth crown develops from the cuspal end first, and growth proceeds towards the cervical end. The first-forming, cuspal enamel is buried in the deepest enamel layers; thus, defects that occur in cuspal enamel are representative of metabolic stress that occurred in that early period of development (Hillson, 1996). Many studies of dental defects disregard cuspal enamel because seeing the hidden increments requires thin-sectioning (a destructive process). Hypoplasias, as surface defects, will only represent stress that occurred from the time that striae of Retzius (SOR) reach the surface (as perikymata) during crown extension. The earliest stress during growth will not be recorded on the enamel surface, necessitating analysis of the internal structure of enamel surrounding the dentin horn. Using hypoplasias and pathological striae together covers the entire time of growth subject to disruption – hypoplasias alone leave out the period of “hidden” cuspal enamel. The nature of tooth geometry dictates that the first layers of enamel laid down in the cusp are covered over completely by successive layers of enamel. Further down on the crown, the layers are not hidden; they reach the surface as countable growth markers (Hillson, 1996; Hillson and Bond, 1997).
baboons (Dirks et al., 2010; Dirks et al., 2002). Humphrey and authors (2008) analyzed strontium/calcium ratios in tooth crowns of wild-caught baboons and predicted that the ratios would change as juveniles experienced dietary transitions both at birth and at weaning. Changes in strontium/calcium ratios during enamel development were found to coincide with observational data on weaning timing (Humphrey et al., 2008). Moreover, Dirks and authors (2010) found that accentuated striae occurred in juvenile baboons at 6 months in one case, related to a reduction in sucking frequency, and 11 months in another, related to a cessation of nursing. Accentuated striae in this sample were determined to be indicators of weaning stress. Microdefects were found to occur most commonly in children aged 2-3.5 years in Wright's (1990) Mayan skeletal samples; however, this study does not take hidden cuspal enamel into account. In contrast, Simpson (1999) found that around 50% of microdefects occurred before the age of 18 months, in the cuspal portion of the crown.
While the number of studies documenting pathological striae in permanent cuspal enamel is relatively few, those documenting the presence of the neonatal line, a heavily accentuated stria in deciduous enamel, are numerous (Scour, 1936; Weber and Eisenmann, 1971;Whittaker and Richards, 1978). This line is often visible in the cuspal enamel of deciduous premolars and molars and permanent first molars, supporting the idea that even in the areas of highest decussation (i.e., cuspal enamel), it is possible to detect accentuated striae.
Presupposition 2
innate, immunity is (provided to) infants via two mechanisms. First, the body’s natural barriers and lymphoid organs (which are still developing/ physiologically immature) provide immunity at birth, and second, colostrum, the first, anti-body rich milk secreted after
pregnancy provides nursing infants and toddlers a boost in immunity during a critical immunoincompetent period. Acquired, or adaptive, immunity develops as a child becomes exposed to foreign microorganisms. It is arguable from a metabolic standpoint that infants are more vulnerable to infectious disease processes than slightly older children because, as a child ages, he/she gains experiential, acquired immunity (Roitt and Delves, 2001). This argument challenges the idea that the weaning period is the most significant time of stress for young children.
Hypothesis 3
The third hypothesis was that the pattern of enamel growth and disruption would be unique to the study groups/population. This hypothesis relies on the creation of an
endogenous model for canine crown growth and comparison of that model to growth in other human populations. The most useful comparisons are between studies using the same
histological and analytical methods, in this case with Simpson’s (1999) analysis of the prehistoric and historic contact period samples from northern Florida, USA, which relied on counts of striae of Retzius along the dentino-enamel junction (DEJ) to establish overall crown formation duration, measurements of the external and internal locations along the lengths of respresentative striae, and the generation of regression equations to convert
hypoplasia locations into internal locations along the DEJ (for comparison in distribution and timing).
age-(Swardstedt 1966, Goodman and Song 1999). The division of crown height into equal developmental zones assumes that crown growth is linear, despite that Massler and
colleagues demonstrated the opposite (Massler et al., 1941) The problem among studies with more reliable crown development chronologies is that there is still a significant amount of variation in crown completion times (Simpson 1999; Liversidge, 2000; Reid and Dean, 2006). Because the degree of variation in the duration of enamel growth among different human populations is largely unknown, imposing one population’s growth schedule on another is potentially erroneous.
Presupposition 1
The first presupposition of Hypothesis 3 was that a comparison of published schedules of permanent crown growth would show a significant amount of variation - evidence for variation between populations. Permanent tooth crown development schedules for modern humans vary significantly (Reid and Dean, 2006; Dean 2000). The variation in development schedules translates into variation among defect chronologies because these are all based on some kind of developmental schedule. Goodman and Song (1999) identified sources for variation in linear enamel hypoplasia chronologies, including hypoplasia measurement error, variation in developmental timing, crown height variation, use of corrections for buried cuspal enamel and changes in enamel growth rates, and choice and interpretation of developmental schedule (see also Rose et al. 1995; Goodman and Rose 1990; Skinner and Goodman 1992; Simpson and Kunos 1998). Simpson (1999) and Ritzman and authors (2008) have pointed out the problems of more traditional, non-destructive
resulting in schedules that are incongruent with the growth process they are modeling
(Hillson and Bond 1998; Simpson 1999). Simpson (1999) demonstrated the non-linear nature of crown growth – the density of striae of Retzius along the DEJ increases towards the
cervix, indicating a slowing of growth as the crown nears completion.
Radiological studies of crown development such as Nolla (1960) are non-destructive but have other problems such as the accuracy of the radiographic image. Additionally studies using these standards have reported very different canine development chronologies, despite being based on similar populations (Simpson 1999, Simpson and Kunos, Beynon et al., 1998). Population-based variation in tooth calcification stages has been documented by in research relying on radiographic methods. Owsley and Jantz (1983) applied the
of enamel formation in different parts of the crown are not accounted for in radiographic studies, which lead to flawed development chronologies.
Histological studies of crown development based on incremental growth structures have a number of advantages. They account for the non-linear nature of crown growth and the timing of hidden cuspal enamel, and they produce ages-at-formation of both hypoplasia and pathological striae in terms of days. Although this form of analysis is destructive, a method for molding crowns before thin-sectioning preserves their surface dimensions and features for future analysis. The amount of variation in modern humans even among histological studies employing similar methods is unknown, despite that enamel growth appears to be under greater genetic control than other bodily tissues. The use of small or pathological clinical samples in older histological studies (e.g. Massler et al. 1941 and Schour 1936), which have been hugely influential in biological estimates of defect timing in the past is questionable, and these standards may not be applicable to many populations.
Presupposition 2
royalty (the majority were probably in-between). Distinct differences between cemeteries in the patterns of normal growth and growth disruption produced by stress are not likely to be detected, given both the gross measure of the environmental factors that impact growth, the mix of individuals in each cemetery, and the complexity of the factors that impacted
decisions for burial place.
It is important to note that burials in both cemeteries have been attributed to the post-A.D. 1250 medieval period and have not been dated any more specifically. Time within the cemeteries is difficult to determine, due to lack of grave goods, continual use of the cemetery throughout the medieval period, and the fact that only half of the sites, and only parts of the cemeteries, have been excavated due to existing buildings. No time-correlated patterns in burial position have been found (Becher, pers comm; see also Moller-Christensen, 1958). While the spatial patterning of burials may be somewhat useful in that older burials tend to be closer to church, it should be noted that the churchyard has moved in the past and that it extends past excavated areas.
SIGNIFICANCE OF THE RESEARCH PROBLEM
in the stress profile provides a window onto stress in infancy that is often not available through traditional osteological analysis. The remains of infants and young juveniles frequently succumb to destructive taphonomic processes, essentially disappearing in a skeletal assemblage (Cook and Buikstra, 1979, Saunders et al. 1999). Teeth remain most frequently, providing access to the entire period of crown growth. This dissertation uses a model for timing both types of defects to not only gain further information about childhood stress levels in urban settings, but specifically stress in medieval Scandinavia (for which little is known in comparison to medieval Britain and continental Europe). Furthermore, the development of an endogenous canine crown development schedule and its comparison to schedules for other populations provides insight into the range of variation of growth in modern humans. Moreover, the methods allow more accurate insight into the types and timing of stressors in children in medieval Odense. Historical documents point to the types of stressors to which children were exposed, but relatively little empirical data exists on childhood health in medieval Denmark. The methods in this study allow important contributions to be made to a biological picture of growth disruption in Danish children. SOLVING THE RESEARCH PROBLEM
stress in childhood growth. Finally, total time to crown development in the study sample was compared to schedules produced from modern clinical and pathological samples, as well as archaeological samples from northern Florida, USA to determine the amount of variation between crown growth in the Danish sample and that of other samples.
CHAPTER II
REVIEW OF THE LITERATURE NORMAL ENAMEL GROWTH
Amelogenesis: Matrix deposition and maturation
In order to understand the etiology of enamel defects, a brief review of amelogenesis, the process of enamel formation, is provided. Amelogenesis is often described as a two-step process occuring within a tooth germ. It involves: (1) secretion of a primary organic matrix by cells called ameloblasts and (2) maturation of that matrix, during which ameloblasts remove the organic components and deposit secondary mineral mainly comprised of hydroxyapatite (Boyde, 1976; Hillson, 1996; Eisenmann, 1994). (Because the maturation phase of amelogenesis is itself a two-step process, some authors describe amelogenesis as occuring in three stages, secretion of the primary matrix, matrix removal, and secondary mineral formation (Schroeder, 1991). The process of enamel secretion begins at the occlusal tip of a tooth germ and proceeds toward the cervix of the tooth (Boyde, 1976; Hillson, 1996), following the path of general crown growth. Enamel growth occurs as both thickness and apposition, from the DEJ to the enamel surface, and elongation, the occluso-cervical spread of enamel. Clinical research has shown that tooth crowns elongate in a non-linear fashion, so that enamel is deposited at a variable rate in different parts of the crown (Sciulli, 1992; Shellis, 1984).
an organic matrix capable of accepting hydroxyapatite crystals during maturation. Each ameloblast is rich with mitochondria, rough endoplasmic reticulum (ER), and golgi
“profiles.” The assembly and secretory pathways involve the rough ER, transport vesicles, the Golgi “apparatus,” and secretory vesicles (Ten Cate 1994).
As internal epithelial cells begin to differentiate into ameloblasts, the cells elongate and become polarized. The nucleus shifts proximally away from the DEJ, and the majority of organelles cluster in the cell opposite the nucleus. Ameloblasts are closely aligned to one another, attached by junctional complexes at their proximal and distal ends of the cells. Filaments project from the complexes into the cytoplasm of adjacent ameloblasts, allowing junctional complexes to regulate what passes between ameloblasts to enter or exit forming enamel. Enamel protein is synthesized in the rough endoplasmic reticulum and transferred to the Golgi complex, where it is packaged into secretory granules. The granules move to the cell’s distal end and are released against the dentin mantle/predentin. This initial enamel is mineralized almost immediately with inorganic ions from the dental follicle. The enamel is described as “structureless” because its hydroxyapatite crystals are deposited randomly, interdigitating with crystals from the dentin.
Following the deposition of this intial thin layer of structureless enamel, the
in a tooth crown is structured – only the first-formed and last-formed layers (when Tome’s process pits are resorbed) exhibit crystals deposited randomly.
Once enamel has formed its full thickness in the secretory stage, the role of
ameloblasts changes to maturing the enamel. This cyclical process involves removal of water and organic content, when the ameloblasts take on a “smooth-ended” appearance, and
deposition of additional inorganic material, when the ameloblasts take on a “ruffle-ended” appearance.
Microstructure of normal enamel
Mature enamel is 96% inorganic by weight (Simmelink, 1994; Moss-Salentijn and Hendricks-Klyvert, 1990), rendering it the hardest structure in the body. Histologically, the structure of mature enamel is that of a mineralized epithelium and not a connective tissue (no fibrous structural elements are present in mature enamel) (Simmelink, 1994; Schroeder, 1991). The structures of mature enamel include: enamel rods, striae of Retzius, perikymata, and enamel cross-striations.
Rods, or prisms, are the fundamental structure of enamel. They are elongated cylindrical aggregates of hydroxyapatite crystals. The so-called “keyhole appearance” of a rod in cross-section results from the orientation of crystals parallel to the rod’s long axis at its center and from those flaring laterally towards its periphery. The structural integrity of enamel results from the undulation of the rods as they extend from the dento-enamel junction to the outer one-third of the enamel’s thickness (Hillson 1996).
longitudinal sections they appear as dark lines running from the dentinoenamel junction to the occlusal surface, maintaining the shape of the developing enamel front (Schroeder, 1991; Goodman and Rose, 1990). They also form concentric arcs at the cuspal and incisal edges in longitudinal sections (Swancar, 1986), revealing that some enamel is forever hidden by subsequent developing layers. Exactly what constitutes a stria of Retzius is still not well understood. Investigation into the structure and morphology of striae has shown that they cross-cut enamel rods (Hillson, 1996) and likely result from either: (1) a change in direction of the rods (Swancar 1986; Wilson and Schroff, 1970) or (2) a deficiency in mineralization of the rods (Moss-Salentijn and Hendricks-Klyvert, 1990; Swancar, 1986). One stria of Retzius is thought to represent a period of rest between two active phases of enamel secretion
(Schroeder, 1991). The resting period in rod formation appears to occur every 7 days on average so that the area of enamel between each stria represents one week’s formation time (Swancar, 1986). A more detailed model of the incremental growth of enamel is provided by Dean (1987). Dean describes the circaseptan (weekly) secretion of enamel as a product of the interaction of a 24 hour and 27 hour rhythm, resulting in a seven to eight day interference beat. Other important homologous rhythms in the body may provide clues to the etiology of striae of Retzius, including the frequency with which kidney transplants are rejected on a circaseptan rhythm and the almost weekly periosteal rhythms in human osteosarcomas (Dean, 1987).
Perikymata are the surface manifestations on unworn tooth crowns of the striae of Retzius. As such, they are used to calculate crown formation duration, which is used, in turn, to document growth and maturation in humans (Mann et al., 1991). Perhaps the most
that cross striations, the segments of prisms in the interval between Retzius lines, can vary in number (periodicity) from six to twelve (Reid and Ferrell, 2006; Thomas, 2003; FitzGerald 1998). An average of seven cross striations between striae has been assumed by many researchers to indicate that each cross striation represents a 24 hour period, or one day (Hillson, 1996; Risnes, 1986; Mann et al., 1991). By extension, striae of Retzius occur, on average, at weekly intervals. It is important to note that these intervals for formation are averages. Mann et al. (1991) point out that perikymata do not regularly record seven days of growth and that calculations of crown formation time relying on this regular periodicity may be erroneous (see Fitzgerald, 1998). Despite these problems of periodicity, counts of striae of Retzius have one very clear advantage over perikymata counts: striae at the cuspal/incisal tips of tooth crowns are visible (and countable) histologically, whereas cuspal perikymata formed at the onset of calcification remain hidden, buried under successive layers of enamel (Mann et al., 1991).
periodicties range from 6 to 12 days, with a mode of 8 or 9 days (Guatelli-Steinberg et al., 2005; Reid and Ferrell, 2006)
EVIDENCE OF GROWTH DISRUPTION: ENAMEL DEFECTS
Hypoplasias
The surface of a normal tooth crown is smooth and white (Hillson, 1996). Defects of enamel alter this appearance. Non-genetic pit, groove, and transverse linear defects on the enamel surface are classified as enamel hypoplasia, a deficiency of enamel thickness,
indicating that the defect occurred during the secretion phase of amelogenesis (Hillson, 1996; Goodman and Rose, 1990). Hypoplastic lesions form in the secretory (first) phase of
amelogenesis, as ameloblasts secrete calcium salts and proteins called amelogenins and enamelins (Suckling, 1989). The rate of secretion may be directly affected by the duration and severity of the stressor. Condon and Rose (1982) and Wright (1990) suggest that chronic metabolic stress slows the rate of secretion, producing hypoplastic defects. Acute (shorter-term) metabolic stress affects total ameloblast secretion, resulting in accentuated or
pathological striae. It is important to note that extreme systemic disturbances can result in the death of ameloblasts, which would result in an absence of enamel in all teeth developing at the time of the disturbance. Disturbances that occur in the maturation, or second, phase of amelogenesis may result in hypocalcified enamel, an issue of enamel quality as opposed to quantity (Suckling, 1989).
Enamel defects found on permanent teeth reflect generalized childhood metabolic stress because the crowns of the permanent dentition form after birth, during infancy and childhood. Childhood health is linked directly to population demography; and, because juvenile skeletal remains are often underrepresented in archaeological populations, enamel hypoplasia in adult remains provides a unique source of information on childhood well-being (Wright, 1997).
Hypoplasia is described as a general stress indicator because its causes are multiple and varied (Larsen, 1999). Anthropological studies on the prevalence of defects in modern and archaeological populations all over the world assume that most defects result from general (non-genetic) systemic stress (Boyde,1970) and have identified the major stressors as: (1) nutritional (Goodman and Rose, 1991) , resulting from famine (Zhou, 1995), a reorientation of diet (Lambert, 1993; Larsen and Hutchinson, 1992; Hutchinson and Larsen, 1990, 1988 ; Simpson et al., 1990), and weaning stress (Lanphear, 1990; May et al., 1993; Goodman et al., 1987; Goodman et al., 1984; although see Blakey et al., 1994) and (2)
environmental, resulting from disease stress (Goodman et al., 1980; Larsen and Hutchinson, 1992; May et al., 1993; Simpson et al., 1990).
The methods for measuring the developmental timing of enamel hypoplasias vary widely among researchers (Skinner and Goodman, 1992). Many measure from the occlusal margin or the center of the defect to the dento-enamel junction and then convert this
al., 1990), although a better method for estimating duration of an episode may be to count the perikymata contained within a lesion (Guatelli-Steinberg, 2000). Also of interest is
differential susceptibility within and between tooth classes (Wright, 1997; Condon and Rose, 1992; Goodman and Armelagos, 1985) and the amount of lateral versus cuspal enamel in the tooth type. Traditional anthropological means of estimating the age of occurrence of enamel surface defects have failed to take into account variable enamel deposition; instead, it has been assumed that tooth crowns can be divided into equal portions for comparing frequencies of hypoplasia in these portions of the crown (see Goodman and Rose, 1990). Goodman and Armelagos (1985) demonstrated this intra-tooth variation in susceptibility to defects by dividing the tooth crowns into thirds and documented the prevalence of hypoplasia in each third. The middle third of tooth crowns was found to be most affected, followed by the cervical and then the cuspal thirds. Problems arise in comparing defect prevalence in equal
thirds of a tooth given that the rate of crown growth, specifically elongation, is non-linear
(Sciulli, 1992; Shellis, 1984) and that the “equal thirds” divisions have no actual developmental correlates.
and bacterial infections such as syphilis and tetanus; neurological disorders; endocrinopathies such as hypoparathyroidism and diabetes mellitus; nutritional deficiencies inlcuding vitamin, mineral, and protein deficiencies; kidney disorders; enteropathies including non-specific diarrhea, coeliac disease, and lymphangiectasia; liver diseases; intoxications with
tetracycline, thalidomide, vitamin D, and Pica-related substances; local mechanical trauma, burns, and irradiation; and local infections such as periapical osteitis, neonatal maxillitis, and odontodysplasia.
In modern developed nations, enamel hypoplasia affects only about 10% of the population (3-15% according to Pindborg, 1970). The clinical implications of hypoplastic lesions are important to note because hypoplastic lesions are ideal sites for attack by carious bacteria. The result is a penetrating carious lesion, possible tooth loss, and often chronic periapical abscesses (Infante and Gillespie 1977).
A high prevalence of enamel hypoplasia in living populations has been shown to be clearly positively correlated with poor socioeconomic status. Enwonu (1973) found a clear correlation between hypoplasia prevalence in deciduous teeth and poor socioeconomic status. Nigerian children aged 0-7 years from a high socioeconomic group showed no defects, while malnourished children from families living in poor village conditions showed defect
supplemented. Those children receiving the supplements showed LEH prevalence in the range of 28.6-50.4% (of individuals affected), versus the non-supplemented grow with prevalence in the range of 64.7-84.1%. Both groups showed a peak age at formation of ca. 2-2.5 years, but the non-supplemented group had a wider range of ages at occurrence. The authors concluded that undernutrition during enamel formation is causally linked to linear hypoplasia formation (Goodman et al. 1991).
In a study of enamel hypoplasia in village children from Solis, Mexico, Goodman et al. (1992) found that children with defects had lower body weight and shorter stature than those without defects. The synergistic relationship between diet, disease, and environment is difficult to tease apart in determining defect causation. Malnutrition and infection were problems common to populations from Polynesia, Southeast Aisa, Central America, and Africa where linear enamel hypoplasia was prevalent in deciduous teeth at rates of 14-85% (Infante and Gillespie 1977). In the United States, Infante (1974) found that between 19 and 39% of a sample of 96 Apache children showed hypoplastic defects. All of these children were living in poverty or near-poverty and were malnourished, as determined by poor quality protein intakes and low energy, calcium, and vitamin intakes. However, it is important to remember that the defects formed during enamel development. The conditions present during the time of the study are not relevant to defect etiology. Enamel does provide a permanent record of developmental stress because, unlike disturbances in bone from which children can recover, e.g., catch-up growth, enamel does not remodel. No analogous system of recovery of normal structure exists in enamel, so defects persist throughout life.
years accounted for the prevalence of linear enamel hypoplasia found in the deciduous incisors of 42.5% of the sample. The most prevalent infections were conjunctivitis, thrush, and diarrhea, and they occurred often in the first month postpartum (Sweeney et al. 1969). Parasitic infections are also responsible for enamel growth disruption. Suckling et al. (1986) found that inducing parasitism in sheep damaged the function of ameloblasts, the cells that produce enamel. The sheep suffered severe diarrhea, weight loss, and weakness, and
postmortem examination histological sections of growing incisors revealed that hypoplastic severity (missing enamel) was related to the serverity of disturbance to ameloblastic activity.
While, malnutrition and unsanitary living conditions are correlative to enamel hypoplasia prevalence in all of these cases, neither is directly implicated in defect etiology. The synergistic relationship between undernutrition and infection is implicated by Infante and Gillespie's (1977) of rural Guatemalan children with linear enamel hypoplasia. The study revealed that children aged 2-7 years with hypoplastic lesions in their anterior teeth had caries prevalences in their posterior teeth two to four times greater than children without dental defects. The authors concluded that the mechanisms that underlie hypoplasia
formation, undernutrition and infection, also may predispose the posterior teeth to excessive carious attack (Infante and Gillespie 1977), conditions that are more prevalent in
economically underdeveloped countries.
disease prevalence increased (see Larsen, 1999 for review of the changes that accompany agricultural subsistence shifts). And demographic data have showing that individuals with defects have higher mean frailty than non-affected individuals from the same population (Boldsen, 2007; see also Thomas, 2003).
Pathological striae of retzius (Wilson bands)
Growth disruption is also recorded by microdefects known as pathological or
accentuated striae of Retzius. Pathological striae result from a sudden change in the direction of the enamel rods, associated with atypical rod morphology (Hillson, 1996; although see FitzGerald and Saunders, 2005), and they appear as thick, brown bands. An accentuated stria of Retzius is often classified as pathological, although there is no inter-observer agreement regarding when normal morphology becomes pathological. Attempts have been made at classifying striae of Retzius based on morphology (Risnes, 1990; Rose, 1977; Wilson and Schroff, 1970); however, no standardized classification exists.
The most well-known accentuated stria of Retzius is the neonatal line. The neonatal line is a stria that often appears darker and wider that the striae surrounding it, due to environmental changes that occur with birth. It differentiates pre- from post-natal enamel (Schour, 1936; Weber and Eisenmann, 1971; Antoine et al., 2009). Noren (1983) documented the location and appearance of the neonatal line in both normal weight and low birth-weight Swedish infants and found that more enamel disturbances, including hypoplasia, were prevalent in the low birthweight group.
Accentuated striae have been positively correlated with chronic and repetitive acute disease episodes in infants. In a study of 19 forensic cases, Teivens et al. (1996) found that Swedish infants with an antemortem history of internal organ inflammation and infections had a higher prevelance of pathological striae than infants with no recorded antemortem health problems. Thomas (2003) correlated accentuated striae with a higher risk of death after age 7 in a medieval Danish skeletal assemblage from Tirup. The data on positive correlations between skeletal indicators of nutritional and disease stress and higher
prevalence of pathological striae is less abundant, but nonetheless convincing (Rose et al., 1981; Rose et al., 1985). Additionally, pathological striae are, not surprisingly, positively correlated with low socioeconomic status. In a study of microscopic enamel defects in a Middle Woodland Native American skeletal sample, Cook (1981) found that defects were more prevalent in individuals buried in low-status graves (as determined by burial location, body preparation, grave furnishings, as well as differential arthritis patterning, trace element composition of the ribs, and stature). Cook (1981) also noted that age at death strongly
CHAPTER III
METHODS SUBJECTS AND SITE HISTORY
Site background
Two medieval cemetery sites, the Black Friars Square site and the Gray Friars Place site, were chosen because they comprise large samples of medieval skeletal individuals. Approximately 979 skeletal individuals were originally identified in the cemetery at the Black Friars site and 591, from the Gray Friars cemetery. These cemetery sites were also intriguing because they theoretically represent a good cross-section of individuals (in terms of socioeconomic class) living in and around the town. Both skeletal collections were
analyzed for basic demographic data on age and sex as well as suitability for dental sampling.
Black Friars Square Cemetery (Sortebrødre Torv Kirkegård)
cemetery was first excavated in 1978 by a team of archaeologists from Møntergården,
Odense’s city museum, prior to the installation of a modern sewer line at the site (Urth 1978). Excavations continued into 1979 and 1981.
A total of 661 graves were excavated in 1981 (comprising about one-half of the total cemetery), most of which could not be dated to any specific time within the 300 year
medieval timespan. Well-preserved skeletal remains from the graves were removed and housed with the Antropologiske Database Odense Universitet (ADBOU) in Odense.2 The graves surround the St. Peter’s Church foundation and extend to the southwest towards modern Overstræde and Claus Bergsgade (Figure 1). The density and disturbance of burials, often one intruding on another, made assigning dates to them by stratigraphic layer difficult.3 Moreover, medieval Christian burials rarely contain grave goods that might be used to establish dates or even social status (exceptions are the few graves that contained rosary beads, coins, and seals – and aristorcratic ceremonial grave goods in only two cases). The remnants of wooden coffins and nails were found in many burial features; although many appear also to have been deliberate coffin-less burials, these could not always be
distinguished from coffin burials with wood that did not survive. Both wooden coffin (most common at SBT) and coffin-less burial types were common in the medieval period and give
2
It should be noted that not all skeletal material was collected from the site – anatomists involved in the excavation efforts left poorly preserved skeletal material at the site in favor of whole or well-preserved material.
3 Dendrochronology was not used to date the remains of wooden coffins because coffin wood was
no indication of class or social status within the cemetery. A small number (14) of a third burial type, stone-walled graves, provide a slightly narrower timeframe for relative dating, as walled graves were most common in the 13th century (Kieffer-Olsen 1993). Of these graves, 3 were located inside of the church, and 11 were near the church. The proximity of these burials to the church may be more indicative of social status. For example, the 3 walled burials were located in the floor of the church itself. These burials were highly different from typical churchyard graves because they contained ceremonial graves swords. Such elaborate, expensive grave goods are highly suggestive of aristocratic burial; indeed, burial inside of medieval churches was often reserved exclusively for the aristocracy and high level clerics.
Burial outside of, but in close proximity to, the church is also common indicator of higher social status in medieval European cemeteries; however, there is no direct evidence of this pattern in the Black Friars cemetery.4
Social status was nearly impossible to determine within the Black Friars cemetery. The cemetery was likely used to inter people from all social strata during the Middle Ages (although written sources indicate that the cemetery was used to bury primarily the indigent after the Reformation ca. 1540). The primary tasks of the friars were to preach to those living in the town and to care for the dead – including indigents whom the friars had taken in as well as middle and upper class townspeople who paid to be buried in the friary churchyard. Men, women, and children were interred in the cemetery, although no clear pattern of sexual division of burials was discernable (Becher 1999).5 More men than women were interred in
4That pattern is based on the idea that rainwater dripping from the eaves of the church would fall onto
the graves below and thereby “bless” the dead over and over again (Kieffer-Olsen 1993).
5 The women were once thought by scholars to be wives or mistresses of the friars, but it is more likely
the cemetery (see Becher 1999), attributable first and foremost to the 300 year existence of the friary as a male institution (and concomitant burial of the friars in the cemetery). It is also possible that a portion of the cemetery that has been excavated was reserved for men, in light of the fact that the sample comes from only ca. one-half of the total cemetery. Becher (1999) contends that the presence of people of both sexes and all ages is a testament to the ability of the friary to intertwine itself with the lives (and deaths) of the population of Odense.
Gray Friars Place Cemetery (Gråbrødre Plads Kirkegård)
The Gray Friars Place friary in Odense was a medieval Franciscan friary site dating from ca. 1280 to the Reformation in A.D. 1539. The site is located in the central portion of modern Odense. In the Middle Ages, the friary stood at the northern edge of the town, with open landscape to its northern and western sides. The first excavations of the site, directed by Odense’s Town Museum (Odenses Bysmuseem, Møntergården), took place in 1982, when the local municipality wished to renew the area by planting new trees on the site. The test excavations yielded not only skeletal material from medieval burials, but also the foundations of the porch of the friary church (Arentoft 1991).
Archaeological excavations associated with the renewal project continued in 1990, when renewal plans had expanded to include a piece of “vandkunst,” or water art, in addition to the trees. The areas to be excavated were divided into 7 squares, labeled A through G on site maps (Figure 2). These areas chosen for excavation were the areas chosen by the
municipality for replanting and building of the water installation and its accompanying water line. Burials were found only in squares A through D, all completely inside the boundaries of the medieval cemetery with the exception of B.6 Archaeologists recorded 418 graves in 1990.
Few grave goods were recovered (as expected in a medieval Catholic cemetery); although, a few graves contained coins or medieval bone or amber beads, presumably from rosaries. The burials themselves gave no indication of the social status of the interred. Coffin type was not useful, either, in determining social status within the cemetery. Excavations revealed that 212 of the burial features showed traces of wooden coffins (either traces of nails or the wood itself). Burial density was very high in all of the squares, such that coffin-type even in the most well-preserved features was indeterminable. In a few cases, archaeologists identified coffins as either trapezoid-shaped or as bar/slatted form (Arentoft 1991).
While provisional determinations of age and sex were made in the field, no
systematic demographic analysis of the skeletal material was made until 1999. Additionally, anatomists from the Institute of Cytology and Anatomy at Odense University rejected (and disposed of) some of the skeletal material because it was too meager in quantity or too poorly preserved to be useful in teaching. Loose bones (not associated with a particular grave), with the exception of crania, were discarded (Arentoft 1991).
In A.D. 1279, King Erik Clipping (r.1259-1286), the original patron of the Gray Friars in Odense, granted the friars the plot of land in Odense on which to build a friary. The king’s intent was to use the new friary church for the interment of his family (his daughters were eventually interred inside the church). A second episode of royal patronage came at the end of the medieval period, when King Hans (r.1482 -1513) and his family chose the friary church as their final resting place. Han’s queen, Queen Christine, endowed the friary church with altar furniture that survives today in St. Knud’s, Odense’s cathedral church. The
majority of the people served by the friary, however, were not royalty, but were either townspeople who made arrangements to be buried in the churchyard or were indigents who died in the care of the friars (Arentoft 1991).
After the Reformation, the friary itself was converted to a hospital and was used as such until 1866. The friary church, however, lost its status as a parish church in 1618, and the church was eventually demolished between 1817 and 1819. The last burials in the churchyard are provisionally dated to ca. 1800 (Arentoft 1991). Today, a small portion of the original cloister walkway and cemetery yard still exists; however, most of the original site is covered by a new church and a retirement home and associated grounds.
Preliminary osteological analysis
Age determination
Sex determination
The biological sex of the skeletal individuals was determined for individuals
displaying secondary sexual characteristics in the skeleton (young adults usually over age 15 years and adults).The method used for sex determination of adult pelves was based on several features of the pubis, including the ventral arc, subpubic concavity, and medial aspect of the ischiopublic ramus (Phenice1969), as well as the angle formed by the greater sciatic notch and the depth of the preauricular sulcus. Helpful drawings of all of these characteristics by P. Walker appear in Milner (1994). The presence of dorsal pubic pitting, often an indicator of pregnancy and parturition, was used to designate remains as female. Cranial characteristics were also assessed for sex association, with the help of graded drawings by P. Walker and descriptions of robusticity of the nuchal crest, mastoid process, glabella, supra-orbital margin (all graded on a 1-5 scale), and mandibular robusticity of the mental eminence and gonial angle (Milner 1994).
Selection of dental sample
Mandibular canine. A sample of 410 canines (n = 234 Black Friars, n = 176 Gray Friars) were chosen to be evaluated for enamel hypoplasias (one per individual) from the inventory of individuals who retained at least one fully mineralized, intact permanent mandibular canine. From these canines, a subsample of n = 33 teeth (each representing one individual) from the Black Friars collection and n = 30 from the Gray Friars collection were chosen randomly to be sectioned for the histological defects analysis.
growth in different parts of the adult canine crown (e.g. cusp versus cervix), as well as the total time to crown completion, required that the crowns used for the standard be as complete as possible. Therefore, the sample used to create the endogenous growth standard was chosen with the following criteria: (1) each crown was fully mineralized, (2) there was little to no enamel attrition, (3) there was no damage to cervical enamel along the DEJ (which serves as the basepoint for measurements), and (4) SOR were visible throughout the crown.
RESEARCH DESIGN
Procedures
Dental sample preparation
The crowns of whole teeth were rinsed in water and lightly swabbed with an ethanol solution to remove adhering dirt and debris. This cleaning procedure was performed before analyzing whole crowns for external defects as well as to prepare a subsample of the teeth for molding and sectioning.
Molding
Molds were made of each crown in the samples to be thin-sectioned in order to preserve the crowns’ exterior features and dimensions.
Resin. Araldite epoxy resin was chosen as the medium, as it produces excellent detail for SEM studies. The resin consisted of three chemicals, a hardener, resin, and accelerator in the following ratios: 75g DDSA (hardener): 100g Araldite 502 (resin): 1.9g DMP-30
(accelerator). The DDSA and Araldite 502 were combined under a hood vent and placed on a magnetic stirring platform for 45 minutes, or until the mixture appeared smooth. The
accelerator was added to this, producing a darkened orange color, and mixed for another 15 minutes. The final product was poured into negative molds of the crowns and used for embedding the teeth themselves.
Positive molds. Each negative mold was filled with resin under a hood vent. A slim applicator stick was inserted into each mold to release air bubbles that might have become trapped as the resin was added. The molds were transferred to a 60° C oven to cure for 24 hours. The curing molds were checked every hour for the first 3-4 hours for air bubbles. The final product, a positive resin cast of each crown, was revealed by simply tearing away the negative mold. The molds were stored as a permanent record of the external appearance and dimensions of the crowns destroyed by sectioning, and they and may be used for future scanning electron microscopic analysis of perikymata and enamel hypoplasias.
Embedding
molds were placed into a 60ºC oven for at least 24 hours, or until the resin hardened completely. The hardened blocks were removed from the molds and readied for sectioning.
Sectioning
Thick sections. To produce a midline thin section in the labio-lingual plane, each whole block was placed in an irregular saw chuck, mounted onto the saw arm of a Buehler Isomet sectioning saw, and oriented to be cut slightly off-midline. Thick sectioning resulted in two thick sections, each containing half of the canine. Each thick section was rinsed, bathed in 95% ethanol, and gently swabbed with a .1M hydrochloric acid solution to decalcify the enamel and expose the rods more clearly.
Thin sections. Sections approximately 250-300µm thick were cut from one of the thick section blocks for each individual. For each section, the saw micrometer was turned ca. 12 increments, moving the saw blade approximately 300µm from the face of the slide. The position of the blade was recalibrated for each section, to account for differences in adhesive thickness. All thin sections were rinsed in water and acid-etched in .1M hydrochloric acid solution for 4 seconds to reveal rod structure. It should be noted that the sections were not polished by machine. Sections were permanently mounted using a clear epoxy resin and temporarily coverslipped7 using a 30% ethanol solution or oil for examination under a light microscope. All sectioning was performed by the author in the Simpson Laboratory in the Department of Anatomy at Case Western Reserve University School of Medicine and in the Wright Laboratory in the Department of Pediatric Dentistry at the University of North Carolina School of Dentistry.
ANALYSIS
Identifying defects
Hypoplasias
All of the sampled canine crowns (n = 234 from Black Friars site; n = 176 from Gray Friars site) were evaluated for surface defects at a magnification of 10x on a dissecting light microscope. Specific criteria for defining surface defects (hypoplasias) were used after Hillson and Bond (1997) and included: (1) furrow-form defects that interrupt the normal spacing of perikymata and show occlusal and cervical walls bordering the defect floor, (2) pit-form defects in bands or clusters, representing clusters of ameloblasts that have ceased enamel formation, and (3) exposed-plane form defects, with a wholly exposed growth line plane representing a cessation of enamel production.
The breadth of each hypoplasia as well as the distance from its cuspal edge to the cervix of the root was measured in millimeters with the ocular micrometer.
Pathological Striae of Retzius
PS were only scored in the canine subsample chosen for thin sectioning (n = 33 from Black Friars site, n = 30 from Gray Friars site). PS were positively identified based on at least two of the following three criteria: (1) stria appears darker and wider than surrounding striae, extending clearly from the DEJ to the enamel surface, (2) the stria exhibits rod
suspected PS were also examined with Scanning Electron Microscope – only a few cases of disrupted enamel were verified with SEM. Stria meeting the criteria for pathology were noted, and photographs of the sections at 40x were scanned and examined digitally with ImageTool 3.0 biomedical imaging software (available as shareware from the University of Texas at San Antonio). The absolute locations of PS were measured in millimeters from the DEJ to the cervical enamel.
Determining the timing of defects
Endogenous growth standard
The length of the DEJ was measured digitally in photographs of thin sections of the unworn mandibular canine crowns using ImageTool 3.0 and also MetaMorph miscropic image analysis software.
Each DEJ was divided into 10% increments along its length using the regions
function in MetaMorph (Figure 3), and counts of the intersecting striae of Retzius were taken within each increment (Reid and Dean, 2000). Counts were taken the entire length of the DEJ – covering both imbricational and cuspal enamel – to determine total enamel formation and to document the location of any cuspal pathological striae (per Simpson, 1999). To promote visibility of these intersections, a photomontage was created of each thin section (Figure 4). Each montage consisted of 4 to 7 photographs taken at 40x magnification through a light microscope. The montages were scanned in pieces and reassembled digitally using Adobe Photoshop and analyzed with MetaMorph software.
in 49 Danish medieval mandibular canines was 8 (with a range of 7-11 days, normally distributed), but periodicities do vary within the enamel. For the purpose of this research, a periodicity of 8 was selected as the model standard. The average daily rate of enamel
secretion was also assumed to be 3 μm (Schour and Poncher 1937). Second, the total number of striae for any given canine provided information of the total time of enamel growth.
Total formation time was calculated by counting all the striae intersecting with the DEJ (after Simpson, 1999). Formation time in days was summarized by the following formula:
Number of striae × 8 (days) = time to formation (days)
Making internal and external defect timing comparable: Converting external to internal formation time
Enamel growth pattern was defined in two ways: (1) the relationship between the location of the origins of normal striae along the DEJ and their corresponding terminations at the enamel surface, summarized by a regression equation and (2) the mean total time to crown completion, determined by counts of striae of Retzius throughout the enamel.
Simpson’s (1999) method for converting internal to external defect timing (thus, making the distributions comparable) is duplicated here. The course of 79 striae of Retzius in the Black Friars sample and 84 in the Gray Friars sample (163 total) were recorded by
measuring the internal intersection of each SOR with the DEJ and the external location of each from its surface manifestation to the cervico-labial junction, along the external surface of the tooth. The relationship between each pair of data points (internal and external