INSURANCE INSTABILITY AND PEOPLE WITH DISABILITIES
Elizabeth Geneva Wood
A dissertation submitted to the faculty of the University of North Carolina at Chapel Hill in partial fulfillment of the requirements for the degree of Doctor of Philosophy in the Department of
Health Policy and Management.
Chapel Hill 2018
ii
© 2018iii
ABSTRACT
Elizabeth Geneva Wood: Insurance Instability and People with Disabilities (Under the direction of Morris Weinberger)
Insurance instability (gaps in coverage or changing coverage without a gap) can have negative effects on access to care, including the likelihood of having a usual source of care. Having a usual source of care is particularly important for people with disabilities, who have significant and complex healthcare needs. Limited research is available about how insurance instability affects the likelihood of having a usual source of care for people with disabilities.
The objective of this research was to contribute to the growing body of work on health insurance and healthcare access for people with disabilities. My central hypothesis was that insurance instability has a negative effect on having a usual source of care among people with disabilities, this effect
diminishes as time without instability increases, and the effect of instability on usual source of care varies by disability type.
I used the Medical Expenditure Panel Survey dataset from the years 2004-2013 to conduct my analyses. Aim 1 used two-stage least squares and bivariate probit models, Aim 2 used a probit model, and Aim 3 used both two-stage least squares and ordinary least squares. With each model, I controlled for socioeconomic, demographic, health, and environmental factors. Aim 1 determined that while overall insurance instability does not have a negative effect on having a usual source of care, having a gap in coverage does. Aim 2 found that increasing months of insurance stability are associated with increasing likelihood of having a usual source of care. Aim 3 found that the magnitude of the effect of gaps in coverage on usual source of care varies by disability type.
iv
v
ACKNOWLEDGMENTS
The completion of this work was possible only due to the support of many wonderful individuals and organizations. First and foremost I must thank the members of my committee: Morris Weinberger, Marisa Domino, Jon Oberlander, Kathleen Thomas, Jae Kennedy, and member emeritus Joe Morrissey. I sincerely thank you for the time and effort you gave to developing me as a scholar. I would also like to thank the members of the Collaborative on Health Reform and Independent Living for their
encouragement in my development as a researcher and advocate.
Early days of this dissertation were supported by the Jayne Koskinas Ted Giovanis Foundation for Health and Policy, a private foundation dedicated to effecting change in the healthcare industry for the greater good of the public. The opinions, findings, and conclusions or recommendations expressed in this material are mine and are not necessarily those of the Jayne Koskinas Ted Giovanis Foundation for Health and Policy, its directors, officers, or staff. My career during the later years of this work was also supported by a grant from the National Institute on Disability, Independent Living, and Rehabilitation Research (NIDILRR grant number 90DP0075-01-00). NIDILRR is a Center within the Administration for Community Living (ACL), Department of Health and Human Services (HHS). The contents of this work do not necessarily represent the policy of NIDILRR, ACL, or HHS, and readers should not assume
endorsement by the Federal Government. The Child Care Services Association of Orange and Durham County allowed me to continue as a graduate student after becoming a parent by providing a generous childcare scholarship, which I greatly appreciate.
vi
TABLE OF CONTENTS
LIST OF TABLES ... viii
LIST OF FIGURES ... ix
Chapter 1 – BACKGROUND AND SPECIFIC AIMS ... 1
1.1 Background ... 1
1.2 Specific Aims ... 10
Chapter 2 - RESEARCH METHODS ... 12
2.1 Data ... 12
2.2 Conceptual Model ... 14
2.3 Variables ... 14
2.4 The Selection Problem ... 19
Chapter 3 - AIM 1 MANUSCRIPT... 23
3.1 Overview ... 23
3.2 Background ... 23
3.3 Research Questions ... 26
3.4 Methods ... 26
3.5 Discussion ... 35
Chapter 4 - AIM 2 MANUSCRIPT... 40
4.1 Background ... 40
4.2 Methods ... 42
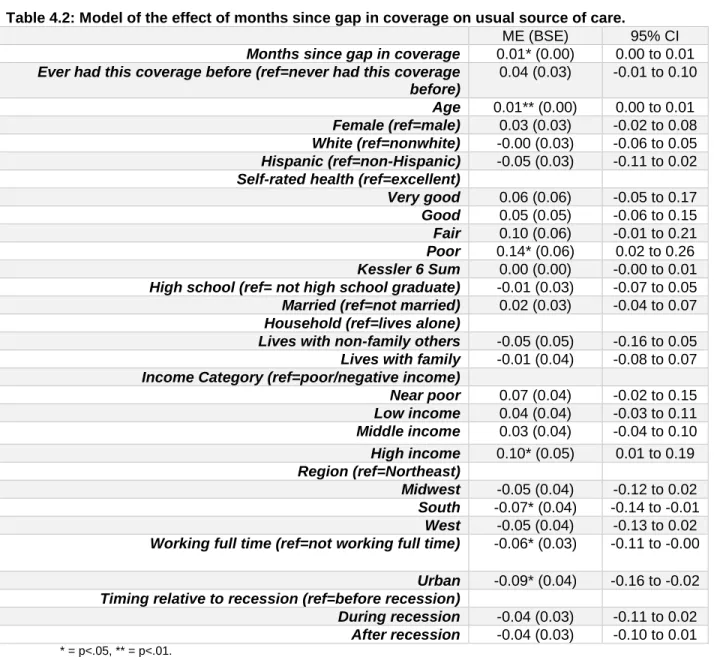
4.3 Results ... 44
4.4 Discussion ... 47
Chapter 5 - AIM 3 MANUSCRIPT... 49
5.1 Overview ... 49
5.2 Background ... 49
5.3 Methods ... 51
5.4 Results ... 55
5.5 Discussion ... 58
Chapter 6 - SUMMARY, LIMITATIONS, IMPLICATIONS, AND CONCLUSIONS ... 65
vii
6.2 Limitations ... 66
6.3 Implications for Policy ... 70
6.4 Implications for Research ... 72
6.5 Conclusions ... 75
viii
LIST OF TABLES
Table 2.1: Operational definitions, all aims and variables ... 19
Table 3.1 Characteristics of sample by insurance stability... 32
Table 4.1: Sample composition ... 45
Table 4.2: Model of the effect of months since gap in coverage on usual source of care. ... 47
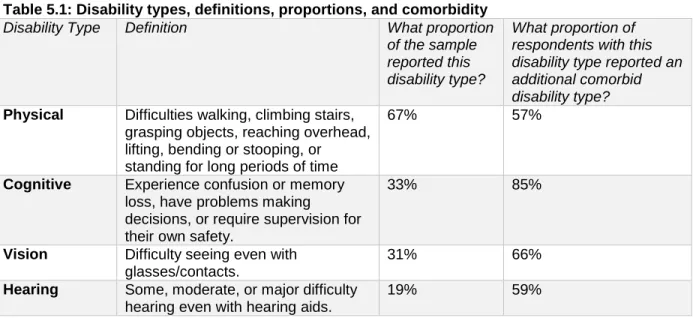
Table 5.1: Disability types, definitions, proportions, and comorbidity... 53
Table 5.2: Sample composition ... 57
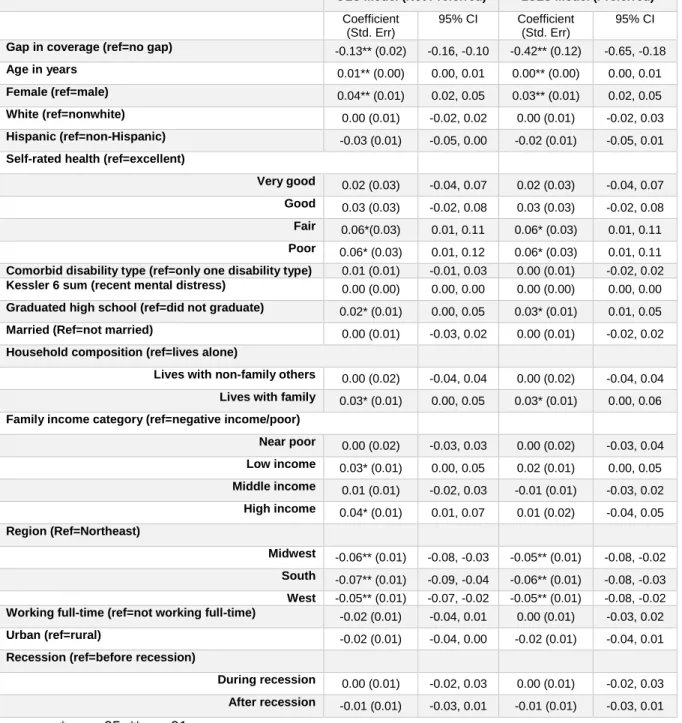
Table 5.3: Physical cohort models of the effect of a gap in coverage on usual source of care ... 61
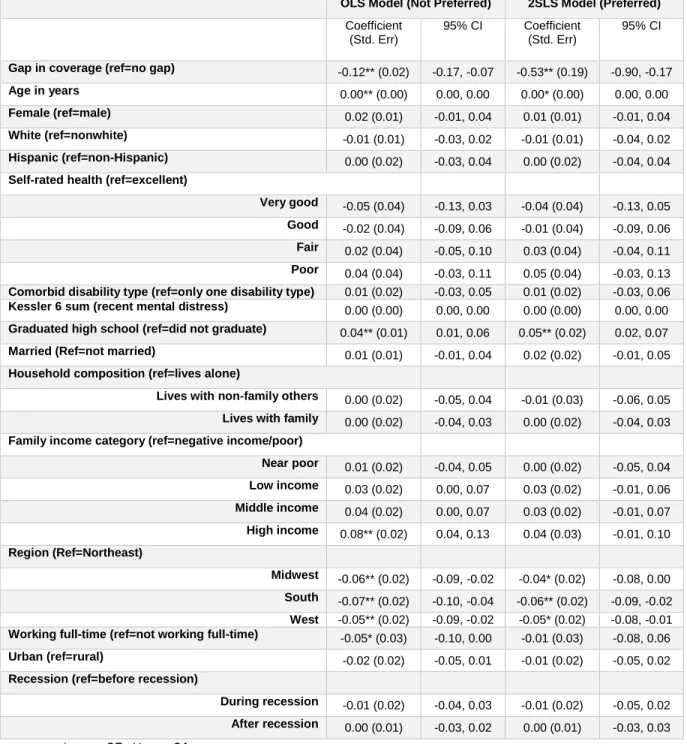
Table 5.4: Cognitive cohort models of the effect of a gap in coverage on usual source of care ... 62
Table 5.5: Vision cohort models of the effect of a gap in coverage on usual source of care ... 63
ix
LIST OF FIGURES
1
CHAPTER 1 – BACKGROUND AND SPECIFIC AIMS
1.1 Background
The role of insurance
To address the high costs and uncertainty associated with healthcare spending, individuals aggregate their risk by purchasing health insurance (Cutler & Zeckhauser, 2000). In exchange for regularly contributing a predictable amount to an insurer, the insurer will reimburse a portion of their healthcare expenses, though the amount of coverage varies by plan. Pooling risk in this way makes healthcare spending reasonably predictable and affordable for insured individuals, and helps shield them from the risk of expensive medical events (Cutler & Zeckhauser, 2000).
In the American healthcare system, health insurance can be hard to hold onto. The different pathways to coverage – employers, individually-purchased coverage, or various government programs with differing eligibilities – mean that life transitions (e.g., gaining or losing a job, gaining or losing a spouse) often are accompanied by changes in health insurance coverage (Czajka & Mabli, 2009). Some coverage changes are compelled by external forces, such as policy changes, employers changing insurance providers, or termination from a job, while some changes are voluntary, such as switching to a plan with better benefits or lower costs. In general, voluntary insurance changes indicate that the market is functioning: consumers are seeking out the right coverage for them, and the market is offering
adequate selection. However, voluntary insurance changes are relatively infrequent in the American healthcare system, and there is evidence (reviewed later) that some involuntary insurance coverage changes are associated with healthcare access problems (Czajka & Mabli, 2009). Voluntary and involuntary changes are both encompassed by the term “insurance instability,” which refers to any
situation when an individual is not continuously covered by the same plan over time, but has a gap in their coverage or changes their source of coverage without a gap (Doty & Holmgren, 2004).
2
care” can refer to either a specific healthcare location (such as a clinic) or provider where individuals usually go if they are sick or need advice about their health (Agency for Healthcare Research and Quality, 2013). Studies indicate that health insurance and usual source of care work synergistically to promote timely access to care. Controlling for sociodemographic and socioeconomic factors, problems with delaying or not receiving care are most commonly reported among those with no insurance and no usual source of care, less common among those who were uninsured but had a usual source of care, and still less common among those who were insured but lacked a usual source of care (Devoe et al., 2011). Possessing both usual source of care and insurance is optimal.
In the sections below, I review the literature on how usual source of care is affected by the two main forms of insurance instability – having a gap in insurance coverage and switching between different sources of coverage while remaining insured – and how usual source of care responds to differing lengths of time without coverage. The literature review is restricted to studies on working-age (18-64) American adults and only includes studies that have usual source of care as an outcome. This section concludes with a discussion of the limitations of the current research in this area and recommendations for future research.
Gaps in coverage
3
odds (OR=0.20) of having a usual source of care than adults who were continuously insured during the same timeframe, controlling for sociodemographic and economic variables.
Using the 2005-2010 Medical Expenditure Panel Survey (MEPS), Abdus (2014) found that gaps in coverage were associated with lower likelihood of having a usual source of care among working-age adults when controlling for sociodemographic, economic, health, and regional factors. One
post-Affordable Care Act (ACA) analysis on insurance instability and usual source of care is available: a study of nonelderly low-income adults in Kentucky, Arkansas, and Texas found that post-ACA, nearly 1 out of 4 respondents experienced instability and that coverage gaps were associated with a higher likelihood of having to change doctors (Sommers, Gourevitch, Maylone, Blendon, & Epstein, 2016).
In summary, gaps in coverage are common, persist post-ACA, and are associated with a lower likelihood of having a usual source of care. Although these findings suggest that gaps in insurance may be disruptive to access even after coverage is restored, a causal relationship between gaps in coverage and lacking a usual source of care has not yet been established.
Changing insurance without a gap
Even when there are no gaps in coverage, changes in an individual’s source of insurance are associated with decreased likelihood of having a usual source of care. Several studies have examined the effect on usual source of care of changing insurance plans without losing insurance coverage among working-age adults and are reviewed below. One regional study of the overall working-age population reported an 8% switching rate (Lavarreda et al., 2008), while two studies of working-age adults who were continuously privately insured had rates around twice as high (13-17%, Cunningham, 2013; Cunningham & Kohn, 2000). A study of married women aged 62-64 observed switching rates of 16%-26%, with higher rates seen among those whose husbands had transitioned to Medicare (Schumacher, Smith, Liou, & Pandhi, 2009).
4
those who changed their insurance (for any reason) were twice as likely to change their usual source of care as those who did not – 22% vs. 11% (Cunningham & Kohn, 2000). Overall rates and the difference between rates were both smaller in the 2010 group – 14% of switchers changed their usual source of care, compared to 8% of non-switchers (Cunningham, 2013). Of those who changed their usual source of care in 96-97, 53% attributed it to “insurance reasons” (Cunningham & Kohn, 2000).
Eight percent of the Californian working-age adults studied by Lavarreda had switched coverage without a gap. Odds of having a usual source of care were significantly reduced among those who switched their coverage without interruption (OR=0.63) compared to those without a switch, although the reduction associated with switching was not as large as the reduction associated with losing coverage (Lavarreda et al., 2008). These models controlled for sociodemographic, socioeconomic, health, and citizenship variables. The study did not ask respondents whether they changed their usual source of care as the result of their switching.
Among married women ages 62-64, Schumacher and colleagues found that those whose husbands transitioned to Medicare (thereby disrupting their spouse’s coverage) were 71% more likely to change their usual source of care (Schumacher et al., 2009). Notably, this was the only one of these studies that methodologically addressed the non-randomness of insurance coverage changes. The authors used the instrumental variable of husband’s age to address the endogeneity of insurance switches for this group (Schumacher, 2009).
In summary, although switching plans without losing coverage is not as disruptive as having a gap in coverage, it still is associated with disruptions to usual source of care. Design limitations preclude causal inference from most of the existing literature. When considering the impact of insurance instability on access to care, those who switched types or plans without becoming uninsured should not be
overlooked. Effects of stability
In the general working-age literature, stable coverage is usually used as the reference category to compare against the negative effects of instability. However, not all stability is created equal, and
5
coverage before previously-uninsured new Medicare beneficiaries no longer had higher rates of morbidity and mortality compared to their previously-insured counterparts (Baker, Feinglass, Durazo-Arvizu, Witt, Sudano, & Thompson, 2006). Another study found that adults 51-61 years old with gaps in coverage were less likely to use preventive services such as flu vaccines, mammograms, and Pap tests when controlling for other factors and compared to those without gaps; moreover, their rates of preventive service use remained low for those who had experienced instability but had regained coverage – these respondents did not “catch up” to the stably insured immediately after becoming covered (Sudano & Baker, 2003). However, these studies did not include usual source of care as an outcome variable.
Only one study examines the effect of a longitudinal measure of insurance instability on usual source of care for adults. This study compared insured individuals who had recently been uninsured with those who had not and found a lower rate of having a usual source of care among those who had recently been uninsured (Schoen & Desroches, 2000). It is possible that individuals will become more likely to have a usual source of care after having more time to familiarize themselves with their insurance plan’s structure and seek out a compatible in-network physician, but there is not much evidence to support this assumption. The field would benefit from additional research on how ongoing stability of coverage after instability affects access to care, including usual source of care.
Insurance coverage, usual source of care, and people with disabilities
Insurance is important for people with disabilities, who tend to have more health needs and fewer resources than people with disabilities. Compared to people without disabilities, this population is much more likely to be in fair or poor health, to experience serious psychological distress, and to report multiple co-morbid health conditions (Iezzoni, 2011; Erickson, Lee, von Shrader, 2011). Their incomes are twice as likely to be below the poverty level, yet their average healthcare expenditures are 4 to 5 times higher (Iezzoni, 2011; Mitra, Findley, & Sambamoorthi, 2009).
6
Consequently, many working-age adults with disabilities relied on public health insurance from Medicaid, Medicare, or both (Kennedy & Blodgett, 2012). Application to these programs is often a time-consuming and uncertain process, and the benefit structure tends to discourage workforce participation (Kennedy & Tuleu, 2007). Given these options, while people with disabilities have more health insurance options overall than those without, obtaining that health insurance can require major tradeoffs in terms of independence and earnings.
Having a usual source of care is particularly important for people with complex healthcare needs and/or disabilities (Iezzoni & O’Day, 2006). Health shocks that may not substantially affect able-bodied and healthy individuals can have serious consequences for individuals with disabilities. Maintaining continuous and timely healthcare is necessary both to manage the primary disabling condition and to prevent or treat secondary health concerns (Iezzoni, McCarthy, Davis, Harris-David, & O’Day, 2001).
Insured people with disabilities are more likely than their nondisabled insured counterparts to maintain a usual source of care. Across studies, 84-93% of insured people with disabilities have a usual source of care compared to only 80% of insured people without disabilities (Hanson, 2003; Iezzoni, Frakt, & Pizer, 2011). Interestingly, the opposite is true among uninsured people with disabilities: only 31-33% reported having a regular doctor, which is 12-14 percentage points lower than uninsured people without disabilities (Hanson, 2003; Iezzoni et al., 2011). The specific causes of this gap have not been identified, but uninsured disabled adults tend to be older, racial and ethnic minorities, less educated, and of lower income, which are all factors associated with not having a usual source of care (Iezzoni et al., 2011; Liaw, Jetty, Petterson, Bazemore, & Green, 2017).
7
regain insurance, and tended to have longer spells of uninsurance, relative to those without disabilities (Wang, Grembowski, & Watts, 2011).
Three studies examine how insurance instability affects usual source of care for people with disabilities. One group of researchers found (in two separate studies) that 11.5% of working-age adults with disabilities were uninsured for part of the year, and these partially-insured respondents had much lower odds (OR=0.28) of having a usual source of care than those who were privately insured all year (Dobbertin, Horner-Johnson, Lee, & Andresen, 2015; Horner-Johnson, Dobbertin, Lee, & Andresen, 2014). Both studies used partial-year coverage as their indicator of insurance instability, and compared those with partial-year coverage to those who were continuously insured and those who were
continuously uninsured. This approach does not account for an individual’s insurance coverage status at the time of the interview, and does not consider those who switched insurers without becoming
uninsured. In their analyses, the authors controlled for race, age, gender, self-rated health, presence of several priority chronic conditions, and presence of complex activity limitation. They did not control for income or employment, which are often included in other research on coverage changes and usual source of care.
8
the comparison of these disabled individuals to older, retired Medicare beneficiaries rather than to other working-age adults.
Heterogeneity within the disability population
When studying healthcare access among people with disabilities, it is critical to understand that people with disabilities represent a tremendously heterogeneous population; different disabilities can vary significantly in their associated factors that predispose and enable healthcare utilization (Courtney-Long, 2015; Andersen, 1995). A growing body of health services research examines disparities within the disability population by comparing different disability subgroups. For example, people with cognitive, hearing, and lower-body physical limitations are more likely to report healthcare access barriers than those with vision or upper-body physical limitations (Iezzoni et al., 2011). Likewise, people with visual impairments have higher levels of unmet dental care needs than those with other types of disabilities (Horner-Johnson & Dobbertin, 2016).
The likelihood of having a usual source of care varies across disability types (Hanson, 2003; Horner-Johnson et al., 2014; Iezzoni et al., 2011). For example, individuals with vision problems or with multiple limitations have significantly lower odds of having a usual source of care than those with solely physical, hearing, or cognitive limitations (Horner-Johnson et al., 2014). These differences may reflect different barriers (e.g. transportation for a wheelchair vs. TTY phone access), health needs (e.g., assistive devices vs. home healthcare), and/or types of insurance coverage related to different impairments ( Drainoni, Lee-Hood, Tobias, Bachman, Andrew, & Maisels, 2006; Kirschner & Breslin, 2007). Notably, problems with obtaining a usual source of care are especially acute among individuals with multiple types of disabilities (Horner-Johnson et al., 2014). Whatever the sources of these differences, most individuals with disabilities would benefit from having a usual source of care.
Remaining research needs
9
change affects likelihood of maintaining a usual source of care, or studies that stratify the population with disabilities by different disability types. Each of these pieces of information is important to understanding how changes in insurance coverage affect access to care for people with disabilities. Given that a usual source of care is important for care coordination, access to preventive care, and patient satisfaction, factors such as insurance instability that decrease the likelihood of having a usual source of care should be evaluated and addressed by policymakers interested in providing high-value equitable care (Ettner, 1999; Fan, Burman, McDonell, & Fihn, 2005; Haggerty et al., 2003). Research is needed that addresses the endogeneity of insurance instability, reflects the heterogeneity of disability, and evaluates the effect of ongoing insurance stability.
Addressing the endogeneity of insurance instability
The majority of insurance instability research relies on observational studies to detect associations between coverage changes and a change in usual source of care. However, insurance coverage changes are not random. Studies that do not address this endogeneity may misrepresent the effect of instability. For instance, lower rates of having a usual source of care among those who
experienced insurance instability could indicate a negative effect of instability on having a usual source of care; however, it could also indicate the influence of a third unmeasured factor. Only one published study addresses this endogeneity, and that study is restricted to a population with limited generalizability (married Wisconsin women ages 62-64) (Schumacher et al., 2009). Of the studies that consider instability for people with disabilities, the Booske study of Medicare involuntary dis-enrollees is informative but of limited generalizability, and the remaining two studies were not primarily focused on methodologically establishing a causal relationship between instability and usual source of care.
Reflecting the heterogeneity of disability
10
However, these studies did not evaluate whether the impact of partial-year coverage on having a usual source of care varied across disability types.
Considering the effect of insurance stability
Some research is available on the effects of ongoing stability of coverage for working-age adults, but only one study is available on how increasing time on stable coverage influences usual source of care, and no studies look at this effect for people with disabilities. The field would benefit from additional research on how ongoing stability of coverage after instability affects access to care, including usual source of care.
1.2 Specific Aims
The objective of this research was to contribute to the growing body of work on health insurance and healthcare access for people with disabilities. My central hypothesis was that insurance instability has a negative effect on a having a usual source of care among people with disabilities, this effect diminishes as time without a coverage change increases, and the effect of instability on usual source of care varies by disability type, controlling for important confounders. I tested my central hypothesis by pursuing three specific aims:
Aim 1: To assess the impact of insurance instability on the likelihood of having a usual source of care among working-age adults with disabilities, while controlling for the endogeneity present in the measure of insurance instability. This study answered the following research questions:
Research Question 1: When controlling for other factors, including confounding due to endogeneity in the measure of insurance instability, does insurance instability cause a reduction in the likelihood of having a usual source of care among working-age adults with disabilities? I hypothesized that insurance instability would cause a reduction in the likelihood of having a usual source of care.
11
instability would cause a reduction in the likelihood of having a usual source of care, but that the magnitude of the effect of switching would be smaller.
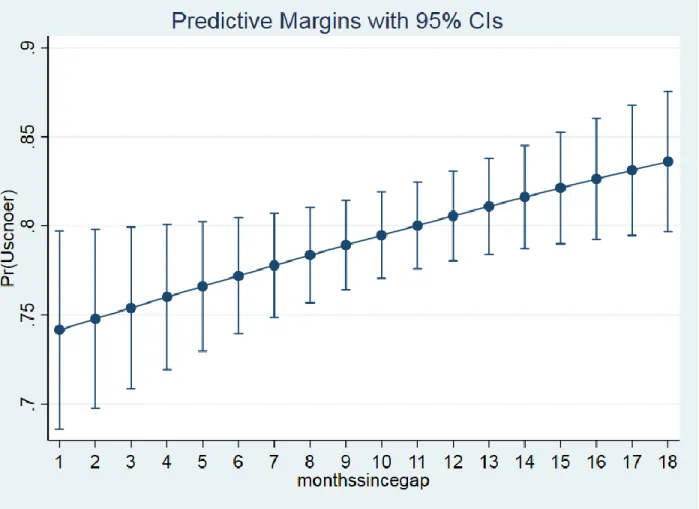
Aim 2: To examine whether additional months of stable healthcare coverage are associated with increased likelihood of having a usual source of care among working-age adults with disabilities, controlling for other factors. I hypothesized that longer durations of time since a gap in coverage would be associated with an increased likelihood of having a usual source of care.
Aim 3: To examine whether the effect of gaps in coverage on usual source of care is different for those with different disabilities, controlling for other factors and addressing the endogeneity in the gap variable. I hypothesized that the effect of gaps in coverage on likelihood of having a usual source of care would vary by disability type, with a smaller effect among those who have sensory disabilities (hearing and vision) and a larger effect among those who have physical or cognitive disabilities.
12
CHAPTER 2 - RESEARCH METHODS
2.1 Data
The Medical Expenditure Panel Survey (MEPS) is an ongoing national survey that collects information about healthcare use, coverage, and spending within the civilian non-institutionalized U.S. population (Agency for Healthcare Research and Quality, 2009). The MEPS provides longitudinal health insurance coverage information for two years, as well as self-reported information about possession of a usual source of care and presence/type of disability. I used the Panels 9-17 longitudinal survey files in order to increase sample size. The surveys represented in this sample were conducted from 2004-2013. Some variables used in the analysis were not available before 2004 (the Kessler index) or after 2013 (rural/urban status). To obtain the full complement of variables needed for the proposed analyses, I also used the Person Round Public Use files. These files provide detailed information for each round on whether the source or name of an individual’s employer-sponsored coverage changed.
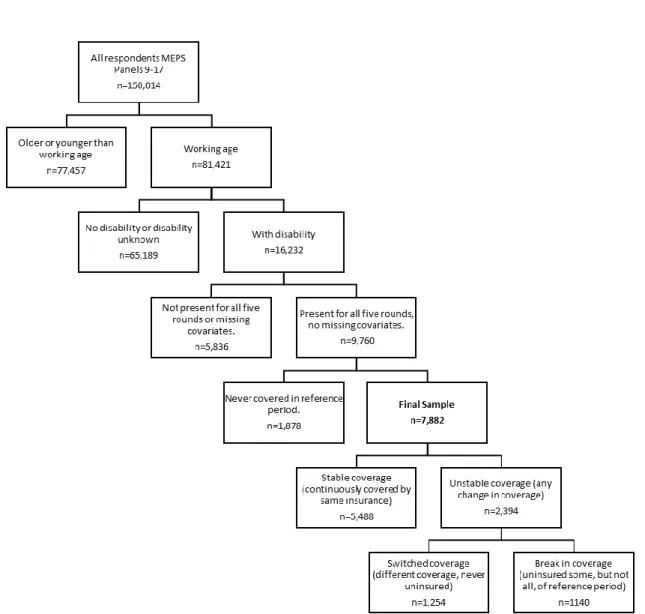
Sample
The sample included adults with disabilities between the ages of 18 and 64 years for the duration of their survey participation. Specifically, disability refers to an activity limitation or participation restriction resulting from an individual’s physical, mental, or emotional condition interacting with their environment. Individuals who report an activity limitation or participation restriction of this type were classified as having a disability. MEPS supports this conceptual definition with variables that ask an individual about the presence of activity limitations, hearing and vision limitations, cognitive limitations, and physical limitations. The age criterion is consistent with a working-age population; in addition, health insurance options for those under 18 and those over 64 are significantly different. The sample was also restricted to respondents who were present for all five rounds of their MEPS panel, were not missing data on
13
composition (7%), and whether their employer offered insurance coverage (21%). The implications of these missing observations and potential alternatives to dropping them are discussed in the limitations section.
Figure 2.1: Model of excluded variables and final sample.
Disability Type Cohorts
14
activity limitation concept of disability used by the World Health Organization’s International Classification of Functioning, Disability, and Health (World Health Organization, 2002). They are not mutually exclusive.
Disability Type Definition Proportion
Physical Difficulties walking, climbing stairs, grasping objects, reaching overhead, lifting, bending or stooping, or standing for long periods of time
67%
Cognitive Experience confusion or memory loss, have problems making decisions, or require supervision for their own safety.
33%
Vision Difficulty seeing even with glasses/contacts. 31%
Hearing Some, moderate, or major difficulty hearing even with hearing aids. 19%
2.2 Conceptual Model
To frame the research question and hypotheses, this research uses the Gelberg-Andersen Behavioral Model of Health Services Use. The original Andersen Model illustrates how the interaction of an individual with their environment influences their health behavior and outcomes (Andersen, 1995). The Gelberg-Andersen model is a revision that is specifically applicable to vulnerable populations, such as people with disabilities (Gelberg, Andersen, & Leake, 2000). In the adaptation of the model below (Figure 2), I have prioritized the variables that are widely used in studies of healthcare access, measurable using the MEPS, and verified as having an impact on access to care (Babitsch, Gohl, & von Lengerke, 2012; Lambrew, DeFriese, Carey, Ricketts, & Biddle, 1996).
Figure 2.2: Adapted Gelberg-Andersen Behavioral Model of Health Services Use
2.3 Variables
15
a usual source of care, are asked at the rounds 2 and 4 interviews. At each interview, respondents provide insurance information month-by-month for the prior period. From the round 4 interview, I used the participant’s response to the usual source of care question. Control variable responses were obtained from the earliest round available.
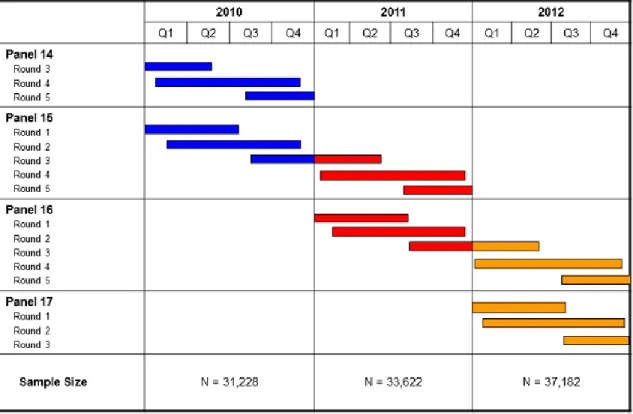
The Medical Expenditure Panel Survey overlaps its two-year panels, with each calendar year containing two panels. For instance, calendar year 2010 contains the later rounds of Panel 14 (who entered the survey in 2009) and the earlier rounds of Panel 15 (who completed their survey in 2011). This allows for cross-sectional estimates as well as longitudinal analyses (see Figure 3).
Figure 2.3: MEPS-HC sample design and collection process
Agency for Healthcare Research and Quality, Rockville, MD. http://www.meps.ahrq.gov/survey_comp/hc_data_collection.jsp Key Independent Variable: Insurance Instability
union-16
sponsored, private non-group, private self-employed, Medicaid, Medicare, dually eligible, Tricare, other public), or plan (by name and source of plan) changed during this period. Individuals who did not have the same coverage status, type, and plan for the full 12 months were flagged as having experienced
insurance instability. If they were uninsured for at least one of those twelve months, they were considered to have experienced a gap. If they experienced insurance instability but were never
uninsured, they were considered as having a switch in their coverage. Gaps in coverage could be either within the same payer (e.g., Medicaid coverage to uninsurance to Medicaid coverage) or to a different payer (e.g., Medicaid coverage to uninsurance to private coverage) as long as a spell of uninsurance was observed. People who switched coverage could have switched between different types of coverage (e.g., Medicaid to private coverage), within different plans offered by the same insurer (e.g., different Blue Cross/Blue Shield Plans), or even between multiple sources of coverage (e.g., Medicaid to private to Medicare to Tricare): as long as no spell of uninsurance was recorded, they were classified as having switched coverage without a gap People with gaps and people with switches were considered mutually exclusive for the purposes of this analysis. For Aim 2, I measured length of time since a coverage change by counting months since their last reported gap in coverage.
I used the longitudinal files rather than the annual files to conduct my analyses, with each individual represented one time in the dataset. To assess an individual’s insurance coverage in the 12 months preceding their round 4 interview, I identified the month of their round 4 interview, identified the month 12 months prior to that point, and used STATA code to verify whether there was a change in each of the tracked types of insurance coverage in any of the months contained within that time period.
For instance, for a person whose round 4 interview was in June of their second year, I created an indicator variable of whether they had any difference in their Medicare status (had Medicare/no Medicare) for July, August, September, October, November, or December of year one or January, February, March, April, or May of year two. I repeated this for each of the insurance types recorded by the MEPS
17
status (covered, not covered) for those months, which told me whether they experienced a gap in coverage during the reference period. I then repeated this method with different months for each of the groups of respondents with later round 4 interviews (July Y2, August Y2,, etc.). This allowed me to standardize the reference period.
A small proportion of MEPS respondents indicate that they don’t know where their private insurance comes from (employer/union, non-group, etc.). This number varies depending on the month, but is consistently under 1% for my sample. Because the original source of their coverage is unknown, I cannot differentiate whether a person who went from “private coverage – unknown” to “private coverage – employer/union sponsored” actually changed their coverage, or simply got more information about where their coverage came from. As a result, I excluded these individuals from analyses. This exclusion
removed 196 individuals from my sample. Dependent Variable: Usual Source of Care
MEPS respondents are asked to indicate whether they currently have a usual source of care, defined as “the particular medical professional, doctor's office, clinic, health center, or other place where a person would usually go if sick or in need of advice about his or her health.” (Agency for Healthcare Research and Quality, 2013). I created an indicator variable signifying whether an individual reported having a usual source of care in their round 4 interview. Individuals who report having a usual source of care are also asked to identify the location of this care; those who respond with the emergency room were re-categorized as not having a usual source of care.
Control Variables
Control variables included factors that could contribute to likelihood of having a usual source of care based on the conceptual model and have been used in similar studies, including age, sex, race and ethnicity, insurance coverage status, marital status, household composition, household income,
education, self-rated health, region, urban/rural residence, and employment status. Given the economic changes in the time period reflected by a 2004-2013 sample, I also included an indicator variable for whether an individual contributed data before, during, or after the recession of 2008-2009.
18
19
Table 2.1: Operational definitions, all aims and variables
Dependent VariableUsual source of care
Whether or not an individual reports having a place they usually go when they are sick or need advice about their health, exclusive of the emergency
department. Main Explanatory Variables
Aim 1:
Instability (y/n), switch (y/n), gap (y/n).
Instability: Changed health insurance type, source, or plan during reference period.
Switch: Changed health insurance type, source, or plan during reference period without becoming uninsured at any point.
Gap: Became uninsured at some point during reference period. Aim 2: Months since gap in
coverage.
Months since individual obtained the coverage they had in the 4th interview (1-18)
Aim 3: Gap (y/n). Became uninsured at some point during reference period. Control Variables
All Aims
Age Age of individual (18-64).
Sex Male, female.
Race White; nonwhite.
Hispanic Hispanic; non-Hispanic
Self-rated health Self-rated health: excellent, very good, good; fair, poor. Recent
psychological distress
Kessler 6 score, 0-24.
Education Highest educational level attained (less than high school, finished high school, more than high school education).
Marital status Married (including separated) or not married (including never married, divorced, and widowed).
Household type Lives alone, lives with family, lives with others who are not family. Family income
category
Family’s annual income as related to the federal poverty line for the applicable year: poor/negative income, near poor, low income; middle income, high income.
Region Northeast, Midwest, South, West. Urban/rural
status Resides in a metropolitan statistical area (MSA); does not reside in an MSA. Employment
status
At time of first interview, individual works full-time (35+ hours weekly), or does not work full time (works <35 hours weekly or is not employed).
Timing relative to recession
Contributed data pre-recession (before 2008), during recession (2008-2009), or after recession (after 2009).
Aim 2 Only Previous experience with current insurance
Whether the respondent had ever previously been covered (during MEPS) by the coverage they had most recently obtained at their round 4 interview.
2.4 The Selection Problem
20
include attitude toward risk, expected utility of health insurance, and availability of insurance coverage. The presence of unmeasured confounders in the error term creates a potential endogeneity problem and must be addressed to estimate the causal effects of insurance coverage changes on usual source of care.
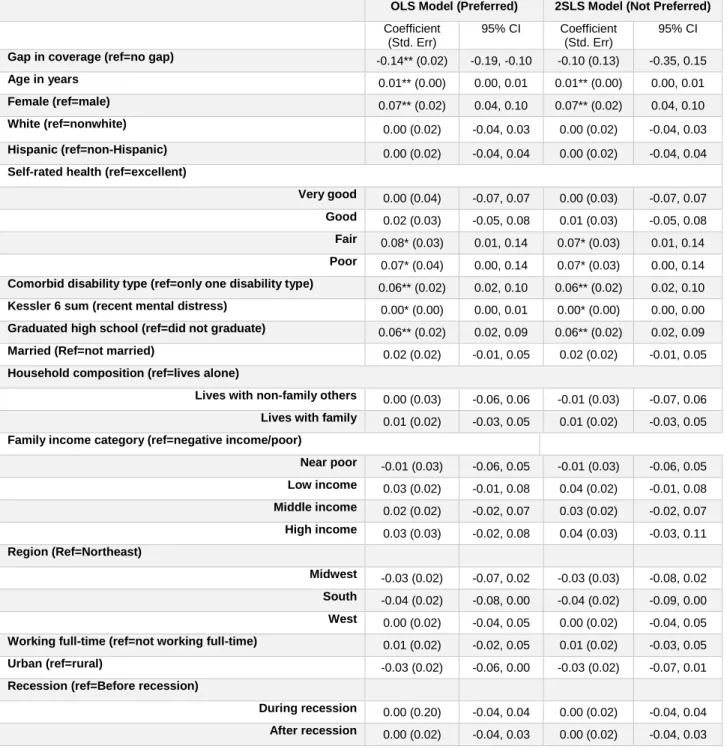
The instrumental variables (IV) technique handles the presence of endogenous regressors by finding exogenous variables (the instruments) that are associated with these endogenous regressors but not with the outcome of interest and using these instruments to eliminate the bias introduced by the endogeneity. Recent methodology research has determined that, when using a binary outcome, binary endogenous treatment, and binary IV, two-stage least squares (2SLS) produces consistent estimates of the local average treatment effect (LATE), while two-stage residual inclusion (2SRI) is biased (Basu, Coe, & Chapman, 2017). Bivariate probit models are less biased than 2SRI, but more biased than 2SLS. Consequently, 2SLS and bivariate probit analyses were conducted and presented for Aim 1. In Aim 3, testing indicated that the gap variable was not endogenous in all models, so both ordinary least squares (OLS) and 2SLS models were presented. Aim 2 was restricted to respondents who already reported a coverage gap. As such, a large component of the non-randomness of their insurance instability was already eliminated and instrumental variables were not used.
The first instrumental variable was whether the respondent’s employer newly offered health insurance.An employer newly offering health insurance coverage should be associated with an increase in the availability of insurance coverage, and therefore a change in the likelihood of insurance instability. However, this change should not be associated with an individual’s likelihood of having a usual source of care except for its impact on whether the individual experienced insurance instability. Therefore, there should be no direct effect of this change on the likelihood of having a usual source of care.
21
The third instrumental variable was whether the respondent had been self-employed during the reference period.Self-employment has been successfully used as an instrument in a study of the impact of health insurance on medical care utilization (Meer & Rosen, 2004). People who choose to be self-employed do not differ significantly from standard wage-earners in their health or their healthcare utilization (Meer & Rosen, 2004). However, the small bargaining power of sole proprietorships means that, pre-ACA, these individuals lacked access to the same health insurance options as employees of larger firms (Perry & Rosen, 2001, 2004). Self-employed individuals were more likely to be uninsured or to be covered by the non-group market, which was more expensive and volatile than the employer market (Perry & Rosen, 2001, 2004). There should be no association between self-employment and likelihood of having a usual source of care other than through insurance coverage.
I also examined the possibility that employment status might be endogenous. However, tests of endogeneity were not significant, and instrumenting employment (through the instruments of trust income and interest income) resulted in very similar marginal effects for each key independent variable as under the assumption of exogeneity. As employment status was measured before the reference period, was not a primary focus of this research, and did not appear to significantly impact the estimates of the key independent variables, it was treated as exogenous in the final models.
Tests of Endogeneity and Strength
In Aim 1, I verified the strength of the instruments by checking whether the instruments for each model, tested jointly, had an F value above ten (Stock & Yogo, 2005). The F-value for the instruments in the instability model was 38.28, for the switch model was 11.31, and for the gap model was 68.90. I also tested the exogeneity of the instability variables. In the 2SLS models, the Durbin chi-square test did not reject exogeneity in the case of the instability variable (p=0.4087), switch variable (p=0.0605), or gap variable (p=0.3618) (Nakamura & Nakamura, 1981). In the bivariate probit models, the Wald test of rho=0 failed to reject exogeneity in the case of the instability variable (p=0.9596), rejected it in the case of the switching variable (p<0.001), and failed to reject in the case of the gap variable (p=0.3058).
22
23
CHAPTER 3 - AIM 1 MANUSCRIPT
3.1 Overview
One important advantage of health insurance is the increased ability to establish/maintain a usual source of medical care (USC), but insurance instability (switching between insurance types while staying insured and/or breaks in insurance coverage) diminishes this advantage. Our objective was to assess the impact of insurance instability on the likelihood of having a USC among working-age adults with
disabilities, while controlling for endogeneity present in the measure of insurance instability. Using 2008-2013 Medical Expenditure Panel Survey data, we found that, controlling for other factors, overall
insurance instability (both switches and breaks) did not have a significant effect on likelihood of having a USC. However, when instability is separated into switching (changing plans, staying insured) and breaks (interruption in coverage), different effects were observed. Counter to prior research, switching was not associated with a reduced likelihood of USC. However, the average marginal effect of a break in coverage was a 13 percentage point reduction in the likelihood of USC. To maximize access to USC, disability advocates should explore opportunities to reduce frequency of gaps in coverage among working-age adults with disabilities.
3.2 Background
24
One important benefit of health insurance is the increased ability to establish and maintain a usual source of medical care, but insurance instability diminishes this benefit (Devoe, Tillotson, Lesko, Wallace, & Angier, 2011). People who experience instability are less likely to report having a regular physician (Duchon, Schoen, Doty, Davis, Strumpf, & Bruegman, 2001; Hoffman, Schoen, Rowland, & Davis, 2001; Schoen & Desroches, 2000; Lavarreda, Gatchell, Ponce, Brown, & Chia, 2008). Even when people do not lose insurance coverage entirely, switching plans decreases the likelihood of obtaining (Cunningham & Kohn, 2000; Schumacher, Smith, Liou, & Pandhi, 2009) or maintaining (Lavarreda et al., 2008) a usual source of care.
The majority of insurance instability research relies on observational studies to detect associations between coverage changes and a change in usual source of care. However, insurance coverage changes are not randomly assigned. Studies that do not address this endogeneity may misrepresent the effect of instability. For instance, lower rates of having a usual source of care among those who experienced insurance instability could indicate a negative effect of insurance instability on having a usual source of care; however, it could also indicate the influence of a third unmeasured factor: for instance, people with low risk tolerance may be more likely to ensure that they maintain both access to a usual source of care and stable insurance coverage. Only one published study methodologically
addresses the non-randomness of insurance coverage changes, and that study is restricted to a
population with limited generalizability (married Wisconsin women ages 62-64) (Schumacher et al., 2009). Having a usual source of care is particularly important for people with complex healthcare needs and/or disabilities (Iezzoni & O’Day, 2006). Health shocks that may not substantially affect able-bodied and healthy individuals can have serious consequences for individuals with disabilities. Maintaining continuous and timely healthcare is necessary both to manage the primary disabling condition and to prevent or treat secondary health concerns (Iezzoni, McCarthy, Davis, Harris-David, & O’Day, 2001). Studies indicate that instability is common among some disability subgroups., including the near-elderly (55-64 years) and young adults (15-25 years) (Callahan & Cooper, 2007; Jensen, 1992; Wang,
Grembowski, & Watts, 2009).
25
disabilities have a usual source of care compared to only 80% of insured people without disabilities (Hanson, 2003; Iezzoni, Frakt, & Pizer, 2011). Interestingly, the opposite is true among uninsured people with disabilities: only 31-33% of uninsured people with disabilities reported having a regular doctor, which is 12-14 percentage points lower than uninsured people without disabilities (Hanson, 2003; Iezzoni et al., 2011). The specific causes of this gap have not been identified, but uninsured disabled adults tend to be older, racial and ethnic minorities, less educated, and of lower income, which are all factors associated with not having a usual source of care (Iezzoni et al., 2011; Liaw, Jetty, Petterson, Bazemore, & Green, 2017).
Despite the importance of usual source of care for adults with disabilities, published research on insurance instability within this population is quite rare. Three studies examine how insurance instability affects usual source of care for people with disabilities. One group of researchers found (in two separate studies) that 11.5% of working-age adults with disabilities were uninsured for part of the year, and these partially-insured respondents had much lower odds (OR=0.28) of having a usual source of care than those who were privately insured all year (Dobbertin, Johnson, Lee, & Andresen, 2015; Horner-Johnson, Dobbertin, Lee, & Andresen, 2014). Booske and colleagues used the 2001 Survey of
Involuntary Disenrollees to examine how Part C plan withdrawals affected Medicare recipients (Booske, Lynch, & Riley, 2002). Their analyses determined that, among Medicare enrollees whose managed care plans left the market, 18% had to change their usual source of care. Disability-eligible Medicare recipients were more likely than age-eligible recipients to report having to change their personal healthcare provider in unadjusted analyses (23%, vs. 15-17% of those age 65-74), although they did not have significantly different odds of changing providers after other factors were controlled for (Booske et al., 2002).
Given that a usual source of care is important for care coordination, access to preventive care, and patient satisfaction, factors that decrease the likelihood of having a usual source of care should be evaluated and addressed by policymakers interested in providing high-value equitable care (Ettner, 1999; Fan, Burman, McDonell, & Fihn, 2005; Haggerty et al., 2003). Reducing insurance instability may provide a way to address the known disparities in access to healthcare for people with disabilities (Diab &
26
3.3 Research Questions
The objective of this research is to assess the impact of insurance instability on the likelihood of having a usual source of care among working-age adults with disabilities, while controlling for the endogeneity present in the measure of insurance instability. This study answers the following research questions:
Research Question 1: When controlling for other factors, including confounding due to
endogeneity in the measure of insurance instability, does insurance instability cause a reduction in the likelihood of having a usual source of care among working-age adults with disabilities? Research Question 2: Controlling for other factors, including confounding due to endogeneity in the measure of insurance instability, do both switching coverage and having a break in coverage cause a reduction in the likelihood of having a usual source of care among working-age adults with disabilities?
The first question contributes to the growing body of work on health insurance and healthcare access for people with disabilities by adding findings focused on insurance instability, a little-studied area despite the importance of continuity of care. The second question adds nuance to our understanding of how insurance instability affects people with disabilities by separating the broad concept of insurance instability in two different components. One of these, switching coverage without a gap, has never been studied in people with disabilities.
3.4 Methods
Dataset
The Medical Expenditure Panel Survey (MEPS) is an ongoing national survey that collects information about healthcare use, coverage, and spending within the civilian non-institutionalized U.S. population (Agency for Healthcare Research and Quality, 2009). It provides longitudinal health insurance coverage data for two years, as well as self-reported information about possession of a usual source of care and disability status. The files used for this analysis are available for public download at
27
covered surveys conducted from 2004-2013, were used in this analysis. MEPS Person Round files provided detailed information on whether the source or name of an individual’s employer-sponsored coverage changed. A standardized reference period, based on the respondent’s insurance coverage in the 12 months preceding their round 4 interview, was used to track insurance coverage within this time period. The round 4 interview is the last time during their MEPS participation when respondents are asked about their usual source of care.
Sample
The sample included adults with disabilities between the ages of 18 and 64 years for the duration of their survey participation. Specifically, disability refers to an activity limitation or participation restriction resulting from an individual’s physical, mental, or emotional condition interacting with their environment. Individuals who report an activity limitation or participation restriction of this type were classified as having a disability. MEPS supports this conceptual definition with variables that ask an individual about the presence of activity limitations, hearing and vision limitations, cognitive limitations, and physical limitations. The age criterion is consistent with a working-age population; in addition, health insurance options for those under 18 and those over 64 are significantly different. The sample was also restricted to respondents who were present for all five rounds of their MEPS panel, were not missing data on
covariates or instrumental variables, and who were insured for at least part of the reference period. The final sample comprised 7,882 respondents.
Measures
Dependent Variable: Usual Source of Care.
28
Key Independent Variables: Coverage Instability, Switching, and Breaks
Respondent’s insurance coverage in each of the 12 months prior to reporting on their usual source of care was used to identify whether any of the following changed during this period: coverage status (insured/uninsured), coverage type (private employer or union-sponsored, private non-group, private self-employed, Medicaid, Medicare, dually eligible, Tricare, other public), or plan (by name and/or source of plan). Individuals who did not have the same coverage status, type, and plan for the full 12 months were flagged as having unstable coverage. Two types of instability were identified during this reference period: switching (i.e., changing coverage while remaining insured, including between different private insurance plans) and breaks in coverage (i.e., partially insured and partially uninsured). These changes may be voluntary or involuntary.
Control Variables
The following control variables previously identified in the research literature as contributing to the likelihood of having a usual source of care were included in this analysis: age, sex, race (white or non-white), ethnicity (Hispanic or non-Hispanic), marital status (married/separated or not married which included never married, divorced, and widowed), household composition (lives alone, with family, or with others who are not family), household income (negative income or poor, near poor, low income, middle income, high income), education (did not graduate high school, graduated high school), self-rated health (excellent, very good, good, fair, poor), region (Northeast, Midwest, South, West), urban/rural residence, employment status (employed full-time versus unemployed and working part-time) and mental health. Mental health was measured with the Kessler 6 (K6), a six-item scale where respondents rank their non-specific psychological distress over the past 30 days on a scale from 0 (none of the time) to 4 (all of the time) (Kessler et al., 2002). Also included was a variable to assess the impact of the recession (before, during, or after 2008-2009). To strengthen the assumption of exogeneity for these control variables, the earliest available measure of each variable was utilized – for instance, employment status was measured in round 1 and K6 score was measured in round 2.
Analytical Models: Instrumental Variables (IV) Approach
29
consistent estimates of the local average treatment effect (LATE), while 2SRI is biased (Basu, Coe, & Chapman, 2017). Bivariate probit analyses, in contrast, estimate the average treatment effect – their degree of bias depends on the expected value of the outcome as well as the probability of the treatment. In the results, therefore, the marginal effects produced by the 2SLS analyses will tell us the effects of coverage changes on those who changed coverage because of the IVs but who would otherwise not have had a coverage change. These findings do not necessarily apply to the entire population of working-age adults with disabilities, but rather only to the marginal population responsive to the final set of IVs.
Standard errors were calculated through bootstrapping (1000 replications) for both the 2SLS and ordinary least squares (OLS) models in order to reduce bias introduced by violations of distributional assumptions. Conceptual pathways and threats to the exclusion restriction are discussed below.
We verified the strength of the instruments by checking whether the instruments for each model, tested jointly, had a F value above ten (Stock & Yogo, 2005). The F-value for the instruments in the instability model was 38.28, for the switch model was 11.31, and for the gap model was 68.90. We also tested the exogeneity of the instability variables. In the 2SLS models, the Durbin chi-square test did not reject exogeneity in the case of the instability variable (p=0.4087), switch variable (p=0.0605), or gap variable (p=0.3618) (Nakamura & Nakamura, 1981). In the bivariate probit models, the Wald test of rho=0 failed to reject exogeneity in the case of the instability variable (p=0.9596), rejected it in the case of the switching variable (p<0.001), and failed to reject in the case of the gap variable (p=0.3058).
The first instrumental variable was whether the respondent’s employer newly offered health insurance.An employer newly offering health insurance coverage should be associated with an increase in the availability of insurance coverage, and therefore a change in the likelihood of an insurance
coverage change. However, this change should not be associated with an individual’s likelihood of having a usual source of care except for its impact on whether the individual had an insurance coverage change. Therefore, there should be no direct effect of this change on the likelihood of having a usual source of care.
30
employer offers coverage could be associated with a change in the availability of coverage, and therefore a change in the likelihood of an insurance coverage change.
The third instrumental variable was whether the respondent had been self-employed during the reference period.Self-employment has been successfully used as an instrument in a study of the impact of health insurance on medical care utilization (Meer & Rosen, 2004). People who choose to be self-employed do not differ significantly from standard wage-earners in their health or their healthcare
utilization (Meer & Rosen, 2004). However, the small bargaining power of sole proprietorships means that these individuals lack access to the same health insurance options as employees of larger firms (Perry & Rosen, 2001, 2004). Self-employed individuals are more likely to be uninsured or to be covered by the non-group market, which before the Affordable Care Act was more expensive and volatile than the employer market (Perry & Rosen, 2001, 2004). There should be no association between self-employment and likelihood of having a usual source of care other than through insurance instability.
We also examined the possibility that employment status might be endogenous. However, tests of endogeneity were not significant, and instrumenting employment (through the instruments of trust income and interest income, validated by the same methods described above) resulted in very similar marginal effects for each independent variable as under the assumption of exogeneity. As employment status was measured before the reference period, was not a primary focus of this research, and did not appear to significantly impact the estimates of the key independent variables, it was treated as
exogenous in the final models.
People with stable coverage (no break, no switch) were used as the reference group. They were first compared to those with unstable coverage to determine whether having any instability had an effect on the likelihood of having a usual source of care. Next, they were compared to each sub-group of coverage changes (switches and breaks) separately to determine whether either or both types of instability (compared to having stable coverage) had an effect on likelihood of usual source of care. Results
Sample Description
31
excellent (p<.05) or very good (p<.01), and had a lower average K6 score (measuring recent psychological distress) than those with stable coverage (p<.01). They were also more likely to have graduated high school (p<.01) and work full-time (p<.01). Those with unstable coverage were more likely to be poor (p<.01), low income (p<.01), or middle income (p<.01). Both groups were similarly likely to live in the West or South, but those with unstable coverage were less likely to live in the Northeast (p<.01), more likely to live in the Midwest (p<.05), and more likely to live in urban areas (p<.01). Respondents with unstable coverage were more likely to have contributed data before, and less likely to have contributed data after, the recession.
32
Table 3.1 Characteristics of sample by insurance stability
Stable Coverage (comparison
group)
Any Unstable Coverage
Switch Break
n=5,488 n=2,394 n=1,254 n=1,140
Age in years
(mean) 46.4 43.4** 45.84 40.5**
Female 45.2% 52.9% 52.3%* 53.7%
White 80.1% 79.6% 80.7% 78.2%
Hispanic 10.3% 10.5% 9.0%* 12.3%*
Excellent health 10.3% 10.6% 11.4% 9.6%*
Very good health 18.8% 20.9%** 21.5%** 20.2%
Good health 28.0% 30.5% 31.1% 29.9%
Fair health 26.6% 24.8%* 23.9%* 26.0%
Poor health 16.4% 13.1%** 12.1%** 14.3%
Kessler 6 sum
(mean) 6.7 6.4** 6.11** 6.78
High school
graduate or beyond 76.7% 81.2%** 83.7%** 78.2%
Married 44.6% 41.0% 47.6%** 32.9%**
Lives alone 20.6% 19.2% 20.2% 18.0%**
Lives with
non-family others 6.1% 8.3%** 5.9% 11.3%**
Lives with family 73.3% 72.6% 74.0% 70.8%
Poor 24.8% 19.1%** 12.1%** 27.8%
Near poor 5.9% 6.9% 5.4% 8.7%
Low income 14.8% 17.5%** 14.0% 21.7%**
Middle income 29.4% 34.8% 37.0%** 32.2%
High income 25.1% 21.7% 31.5%** 9.6%**
Northeast US 18.1% 16.5%** 18.1% 14.6%**
Midwest US 23.8% 26.2%* 26.0% 26.5%*
South US 37.2% 37.4% 36.8% 38.3%
West US 20.9% 19.9% 19.2% 20.7%
Urban 77.9% 81.1% 82.4%** 79.5%*
Working full-time 35.1% 43.5% 45.5%** 41.2%**
Pre-recession
(before 2008) 34.7% 39.4%** 41.9%** 36.2%
During recession
(2008-2009) 21.8% 22.3% 20.4% 24.7%
Post-recession
(after 2009) 43.5% 38.3%** 37.7%** 39.1%
33
Research Question 1: Effect of Insurance Instability on Usual Source of Care
The two-stage least squares model estimated that insurance instability had an average marginal effect of -0.13 (BSE=0.08) on having a usual source of care among the subgroup of marginal
34
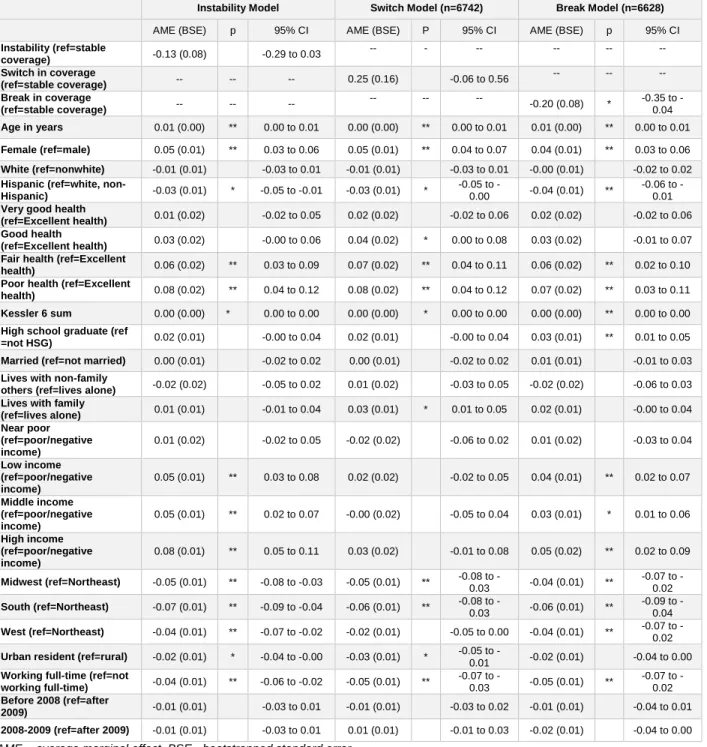
Table 2: Two-stage least squares models of the effects of any change in coverage, break in coverage, and switch in coverage on usual source of care among working-age adults with disabilities.
Instability Model Switch Model (n=6742) Break Model (n=6628)
AME (BSE) p 95% CI AME (BSE) P 95% CI AME (BSE) p 95% CI
Instability (ref=stable
coverage) -0.13 (0.08) -0.29 to 0.03
-- - -- -- -- --
Switch in coverage
(ref=stable coverage) -- -- -- 0.25 (0.16) -0.06 to 0.56
-- -- --
Break in coverage
(ref=stable coverage) -- -- --
-- -- --
-0.20 (0.08) * 0.35 to -0.04
Age in years 0.01 (0.00) ** 0.00 to 0.01 0.00 (0.00) ** 0.00 to 0.01 0.01 (0.00) ** 0.00 to 0.01
Female (ref=male) 0.05 (0.01) ** 0.03 to 0.06 0.05 (0.01) ** 0.04 to 0.07 0.04 (0.01) ** 0.03 to 0.06
White (ref=nonwhite) -0.01 (0.01) -0.03 to 0.01 -0.01 (0.01) -0.03 to 0.01 -0.00 (0.01) -0.02 to 0.02
Hispanic (ref=white,
non-Hispanic) -0.03 (0.01) * -0.05 to -0.01 -0.03 (0.01) *
0.05 to
-0.00 -0.04 (0.01) **
0.06 to -0.01
Very good health
(ref=Excellent health) 0.01 (0.02) -0.02 to 0.05 0.02 (0.02) -0.02 to 0.06 0.02 (0.02) -0.02 to 0.06 Good health
(ref=Excellent health) 0.03 (0.02) -0.00 to 0.06 0.04 (0.02) * 0.00 to 0.08 0.03 (0.02) -0.01 to 0.07 Fair health (ref=Excellent
health) 0.06 (0.02) ** 0.03 to 0.09 0.07 (0.02) ** 0.04 to 0.11 0.06 (0.02) ** 0.02 to 0.10 Poor health (ref=Excellent
health) 0.08 (0.02) ** 0.04 to 0.12 0.08 (0.02) ** 0.04 to 0.12 0.07 (0.02) ** 0.03 to 0.11 Kessler 6 sum 0.00 (0.00) * 0.00 to 0.00 0.00 (0.00) * 0.00 to 0.00 0.00 (0.00) ** 0.00 to 0.00
High school graduate (ref
=not HSG) 0.02 (0.01) -0.00 to 0.04 0.02 (0.01) -0.00 to 0.04 0.03 (0.01) ** 0.01 to 0.05 Married (ref=not married) 0.00 (0.01) -0.02 to 0.02 0.00 (0.01) -0.02 to 0.02 0.01 (0.01) -0.01 to 0.03
Lives with non-family
others (ref=lives alone) -0.02 (0.02) -0.05 to 0.02 0.01 (0.02) -0.03 to 0.05 -0.02 (0.02) -0.06 to 0.03 Lives with family
(ref=lives alone) 0.01 (0.01) -0.01 to 0.04 0.03 (0.01) * 0.01 to 0.05 0.02 (0.01) -0.00 to 0.04 Near poor
(ref=poor/negative income)
0.01 (0.02) -0.02 to 0.05 -0.02 (0.02) -0.06 to 0.02 0.01 (0.02) -0.03 to 0.04
Low income (ref=poor/negative income)
0.05 (0.01) ** 0.03 to 0.08 0.02 (0.02) -0.02 to 0.05 0.04 (0.01) ** 0.02 to 0.07
Middle income (ref=poor/negative income)
0.05 (0.01) ** 0.02 to 0.07 -0.00 (0.02) -0.05 to 0.04 0.03 (0.01) * 0.01 to 0.06
High income (ref=poor/negative income)
0.08 (0.01) ** 0.05 to 0.11 0.03 (0.02) -0.01 to 0.08 0.05 (0.02) ** 0.02 to 0.09
Midwest (ref=Northeast) -0.05 (0.01) ** -0.08 to -0.03 -0.05 (0.01) ** 0.08 to
-0.03 -0.04 (0.01) **
0.07 to -0.02
South (ref=Northeast) -0.07 (0.01) ** -0.09 to -0.04 -0.06 (0.01) ** 0.08 to
-0.03 -0.06 (0.01) **
0.09 to -0.04
West (ref=Northeast) -0.04 (0.01) ** -0.07 to -0.02 -0.02 (0.01) -0.05 to 0.00 -0.04 (0.01) ** 0.07 to -0.02
Urban resident (ref=rural) -0.02 (0.01) * -0.04 to -0.00 -0.03 (0.01) * 0.05 to
-0.01 -0.02 (0.01) -0.04 to 0.00
Working full-time (ref=not
working full-time) -0.04 (0.01) ** -0.06 to -0.02 -0.05 (0.01) **
0.07 to
-0.03 -0.05 (0.01) **
0.07 to -0.02
Before 2008 (ref=after
2009) -0.01 (0.01) -0.03 to 0.01 -0.01 (0.01) -0.03 to 0.02 -0.01 (0.01) -0.04 to 0.01 2008-2009 (ref=after 2009) -0.01 (0.01) -0.03 to 0.01 0.01 (0.01) -0.01 to 0.03 -0.02 (0.01) -0.04 to 0.00
AME – average marginal effect, BSE - bootstrapped standard error. * Difference between comparison groups significant at p < 0.05 ** Difference between comparison groups significant at p < 0.01
Research Question 2
35
gap in coverage (break) reduce the likelihood of having a usual source of care compared to stable coverage?
There was no significant local average treatment effect of switching on whether the respondent reported having a usual source of care (Table 2), according to the two-stage least squares model (AME 0.25, 95% CI -0.06 to 0.56). However, the bivariate probit switch model found an overall average marginal effect of 21 percentage points for switching (95% CI 0.07 to 0.36 p<.01). Older (p<.01) and female (p<.01) respondents were more likely to report a usual source of care, as were those in fair (p<.01) or poor (p<.01) self-rated health or those with higher levels of recent psychological distress (p<.05). Compared to those who lived alone, respondents who lived with family members were more likely to report a usual source of care in this model (p<.05). Higher levels of income were associated with greater likelihood of reporting a usual source of care, while living in the Midwest (p<.01), South (p<.01), or in an urban area (p<.05) were associated with a reduced likelihood. Working full-time was also associated with lower likelihood of having a usual source of care (p<.01).
In contrast, there was a significant negative effect of a break in coverage, based on both models (Table 2). Controlling for all other factors in the model, the average marginal effect of a break in coverage for the subgroup of marginal respondents was a 20 percentage point reduction in the likelihood of having a usual source of care among those affected by the instruments (95% CI -0.35 to -0.04, p<.05). Similarly, the bivariate probit break model reported a 19 percentage point reduction in the likelihood of having a usual source of care among those affected by the instruments (95% CI -0.36 to -0.03, p<.05). As in the other models, being older (p<.05) and female (p<.01) were associated with higher rates of having a usual source of care, as were poorer self-rated health (p<.01) and more psychological distress (p<.01). While education was not significant in the other models, in this model a high school degree was predictive of greater likelihood of reporting a usual source of care (p<.01).
3.5 Discussion
Effect of Insurance Instability on Usual Source of Care