Evaluation of the H2S Test As An Indicator of Waterborne Fecal Contamination
Lanakila “Ku” McMahan
A dissertation submitted to the faculty of the University of North Carolina at Chapel Hill in partial fulfillment of the requirements for the degree of Doctor of Philosophy in the Department of Environmental Science and Engineering, the Gillings School of Global Public Health.
Chapel Hill January 2011
ii © 2011
ABSTRACT
LANAKILA MCMAHAN: Evaluation of the H2S Test As An Indicator of Waterborne Fecal Contamination(Under the direction of Mark D. Sobsey)
A major limitation of the H2S test for the detection of fecal bacteria is the current uncertainty and variability of its sensitivity and specificity for bacteria of fecal origin based on data from available studies. The purpose of this research was to determine whether a quantitative H2S test could correctly identify fecally contaminated water samples and determine if there was any relationship between the test results and diarrheal disease risk. Using culture-based biochemical and culture-independent molecular
techniques, this research focused on determining the types of microbial community members, including fecal indicator organisms, pathogens, and other microbes present in human sewage samples that are detected in a quantitative H2S test as microorganisms of concern to human health. Sewage waters, natural waters from the United States, and household drinking water samples from central Vietnam were analyzed for the
iv
media. The isolates were then: (1) tested to determine whether they were H2S producing organisms, and (2) identified to the genus and species level using biochemical methods (primarily Enterotube and API 20E). Terminal Restriction Fragment Length
Polymorphisms (TRFLP), a quantitative molecular technique developed for rapid analysis of microbial community diversity, was used to identify microbial community members and understand microbial community differences in water samples. Overall, these experiments showed: (1) when a water sample tests positive for H2S, there are fecal bacteria in the water sample; (2) greater than 70 percent organisms isolated by the culture based biochemical identification method were also identified using TRFLP analysis; (3) although community composition differed and changed, there was a fairly stable group of identifiable microorganisms in the water samples; and (4) a quantifiable, low-cost version of the H2S test costing less than 0.75USD had a similar relationship to diarrheal disease as did standard E. coli methods for testing drinking water samples in a developing country.
Keywords: H2S test, microbial water quality, TRFLP, fecal indicator bacteria,
ACKNOWLEDGEMENTS
First, I would like to thank all of the people from the communities of in Central Vietnam and our EMW and UNC-CH research teams because without their help and patience, none of the field research would have been possible. I also received tremendous support from all of the staff and others that supported the work in Vietnam including our lab manager Douglas Wait. I would also like to thank Hien Vo Thi and Van Ly for all of their support and assistance while in the country. Hien’s expertise was a significant source of assistance in making the project a reality.
I would like to acknowledge the support of my doctoral dissertation committee: Mark Sobsey, Amy Grunden, Fred Pfaender, David Weber and Louise Ball. In addition, I have had a great experience working in the Sobsey lab and have to thank all the members for their help; especially my team of undergraduate research assistants. Without Joe Milner, Abhinav Komandur, Karen Roque, Mehrin Islam, Prasant Lokinendi, Naomi Fernando, Shampa Panda, and T Clayton, I would not have been able to get through all of the TRFLP and culture experiments to make the research plan a reality. I also have to give a mention to the members of the EMW team who worked tirelessly day and night to finish the research study.
vi
TABLE OF CONTENTS
LIST OF TABLES...xii
LIST OF FIGURES...xiv
ABBREVIATIONS ...xvi
Chapter 1: Overview and Objectives...1
1.1 Introduction and Background ... 1
Global Burden of Disease Attributable to Unsafe Water and Improper Sanitation ... 1
Reasons for Inadequate Water Quality Testing in Developing Countries... 2
Need for the H2S Test... 2
Importance of Improved Water Quality and Opportunities to Document it in Field Studies... 4
1.2 Objectives ... 6
Chapter 2: Literature Review ...8
2.1 Diarrheal Disease and Waterborne Illness... 8
2.2 Hydrogen Sulfide Producing Bacteria ... 9
2.3 H2S Test Format... 11
2.4 The H2S Test as a Fecal Indicator Test... 13
2.5 Modifications of the H2S test... 19
2.6 Currently Available H2S tests ... 21
Chapter 3: Determination of an appropriate H2S Test for field application ...23
viii
3.2 Materials and Methods... 24
3.3 Results ... 25
Comparison of 3 Broth Media ... 25
Comparison of MPN method at 24 vs. 48 hours ... 26
Comparison of 125mL Whirl-pak Bags vs. Plastic Bottles... 27
Comparison of H2S and E. coli MPN method ... 27
Cost of the H2S Compartment Bag Test... 28
Comparison of the H2S Compartment Bag Test and the IDEXX Quantitray system ... 32
3.3 Conclusions... 35
Chapter 4: Comparison of Culture-Based and TRFLP Analysis to Identify H2S Producing Microorganisms in Sewage ...36
4.1 Introduction and Background ... 36
4.2 Materials and Methods... 38
Culture-Based Biochemical Detection Methods ... 38
DNA Extraction... 40
PCR Conditions ... 41
TRFLP ... 41
Fragment Analysis... 42
In Silico© Output... 43
4.3 Results ... 47
Culture Based Biochemical Detection... 47
TRFLP Molecular Analysis... 48
Statistical Measure Comparing Culture-Based Method and TRFLP ... 50
Chapter 5: Comparison of Culture-Based and TRFLP Analysis to Identify H2S Producing Microorganisms from Multiple Natural
Water Sources...54
5.1 Introduction and Background ... 54
5.2 Materials and Methods... 55
Sampling sites... 55
Culture-based biochemical detection method... 56
DNA extraction... 57
PCR conditions ... 58
TRFLP... 58
Fragment analysis ... 59
Further Phylogenetic Assignment ... 61
Statistical Measure Comparing Culture-Based Method and TRFLP ... 62
5.3 Results ... 63
University Lake Molecular and Cultured Isolate Findings ... 63
FedEx Global Health Building Rainwater Cistern Molecular and Cultured Isolate Finding. ... 66
Duke Forest Artesian Well Molecular and Cultured Isolate Findings ... 67
NCSU Shallow Well Molecular and Cultured Isolate Findings... 69
Statistical Measure Comparing Culture-Based Method and TRFLP ... 70
5.4 Discussion ... 70
Chapter 6: Hydrogen Sulfide Producing Bacteria and Escherichia coli in household drinking water and diarrheal disease risk: evidence from central Vietnam…… ...73
6.1 Introduction... 73
6.2 Methods... 74
x
Data collection... 76
Diarrheal Disease and other Health Related Data ... 76
Water quality data... 77
Additional Data Collection... 78
Data Analysis... 79
6.3 Results ... 82
6.4 Discussion ... 88
Chapter 7: Discussion of the Feasibility of a Simple, Low-cost H2S Test for Fecal Contamination of Water in Developing Countries and Emergency Situations...94
7.1 Summary of Significant Results ... 94
Laboratory evidence ... 94
Field Performance of H2S CBT Test in determining microbial quality of an improved drinking water supply ... 95
Relationship between the H2S CBT Results and Human Health Risks... 96
7.2 Study Results and Relationship to Existing Evidence about the Performance H2S Test ... 97
Comparison of Laboratory Results... 97
Comparison of Field Performance Results... 99
7.3 Health Impact Study and other Evaluations of H2S Test vs. Human Health ... 102
7.4 Research Limitations... 102
7.5 Conclusions... 105
7.6 Further Research on the H2S Test... 107
Appendix 1. Microorganisms capable of producing hydrogen sulfide...109
Appendix 2. List of Genera Identified in Sewage by Experiment...113
Appendix 4. Biochemical analysis and TRFLP Protocols ...119
Appendix 5. Summary of Fragment Data for Sewage and
Natural Water TRFLP Experiments...126
xii
LIST OF TABLES
Table 2.1 The H2S Test as an Ideal Fecal Indicator ...15
Table 3.1 Comparison of H2S versus E. coli tests based on sample positivity or negativity for sewage and seeded water experiments under controlled lab conditions...28
Table 3.2 Comparison of H2S versus E. coli tests based on sample positivity or negativity for piped and treated water samples in Central Vietnam. ...28
Table 3.3. Criteria for low-cost simple drinking water test for E. coli and H2S producing bacteria ...31
Table 3.4. Comparison of the H2S Compartment Bag Test and the IDEXX Quantitray system at 27°C, 37°C, and 44°C...33
Table 4.1 Kappa values of agreement between results of culture based biochemical identification methods and the TRFLP molecular methods for bacterial isolates from positive H2S culture tests of sewage samples...51
Table 5.1 Kappa Values of Agreement between the Culture Based Identification Method and the TRFLP Molecular Method for the Natural Water Samples...70
Table 6.1 Household characteristics from individual observations for all study
participants over 4 household visits, by exposure status at time of visit...82
Table 6.2 Mean total coliform and E. coli counts (cfu/100ml), H2S (MPN/100ml) for samples taken from households (untreated and treated water)...83
Table 6.3 Correlation matrix of water samples compared by fecal indicator ...83
Table 6.5 Diarrheal disease Odds Ratio estimates fecal indicators in treated drinking water a,b,c,d...85
Table 6.6 Diarrheal disease Odds Ratio estimates of H2S producing bacteria in untreated drinking water by compartment bag category. a,b,c,d...86
Table 6.7 Diarrheal disease Odds Ratio estimates of E. coli in untreated drinking water by WHO category23. a,b,c,d...86
Table 6.8 Diarrheal disease Odds Ratio estimates of H2S producing bacteria in treated drinking water by compartment bag category. a,b,c,d...87
xiv
LIST OF FIGURES
Figure 1.1 A map of the Vietnam water quality study areas...6
Figure 3.1 Concentration of H2S Producing Organisms in various H2S Formats at 37°C (MPN/100ml) ...26
Figure 3.2 Concentration of H2S Producing Organisms in HACH Media at 24 vs. 48 hours at 37°C(MPN/100mL) Note that (A) and (B) were 2 different experimental trials ...26
Figure 3.3 Concentration of H2S Producing Organisms in Bags vs. Bottles at 37°C
(MPN/100mL) ...27
Figure 3.4 Concentration of H2S Producing Organisms (Samonella, Citrobacter, Proteus) at 37°C, 39°C, 41°C, 43°C, and 44°C, (MPN/100mL) ...34
Figure 4.1 A workflow diagram describing of the culture based biochemical identification and the TRFLP processes. ...40
Figure 4.2 A flow diagram describing the In Silico software (In Silico LLC, Fuquay-Varina, NC) process used to generate TRFLP community profiles (Johnson et. al. 2009)...44
Figure 4.3 Pathogens and H2S-Producing organisms identified in sewage samples using culture-based biochemical identification methods. ...48
Figure 4.4 TRFLP fragment patterns identified at the Genus level in genomic DNA isolated from H2S-positive liquid cultures of bacteria in sewage-contaminated
samples. ...49
xvi
ABBREVIATIONS
ANOVA- Analysis of Variance CI – Confidence interval
DENR- North Carolina Department of Environment and Natural Resources dNTP- Deoxynucleotide Triphosphate
EMW-East Meets West Foundation FC- fecal coliforom
GEE- Generalized Estimating Equations GBD – Global burden of disease
H2S- Hydrogen Sulfide
IRB- Institutional Review Board OR- Odds Ratios
MDG – Millennium Development Goals MPN- Most Probable Number
NGO – Non-governmental organization
NBCI- National Center for Biotechnology Information NCSU- North Carolina State University
NW- Natural Water
OWASA- Orange Water and Sewer Authority POU – Point of use
RDMA – USAID’s Regional Development Mission-Asia SES – Socioeconomic status
SRB- Sulfate Reducing Bacteria TC-Total Coliforms
TRFLP- Terminal Restriction Fragment Length Polymorphism TSA- Tryptic Soy Agar
UNICEF – United Nations International Children’s Fund USD- United States Dollar
Chapter 1:
Overview and Objectives
1.1 Introduction and Background
Global Burden of Disease Attributable to Unsafe Water and Improper Sanitation
It is estimated that 4% of all deaths are a result of the disease burden from inadequate water, sanitation and hygiene and that this accounts for more than 5% of the total disease burden worldwide (Prüss-Üstün and Corvalán 2007). Lack of access to safe water, improper sanitation and poor hygiene contribute to an ongoing global health and crisis resulting in millions of deaths and infectious disease morbidity burdens affecting billions of persons annually. Inadequate water, sanitation and hygiene account for roughly 94 percent of the 4 billion cases of diarrhea that WHO estimates occur globally each year (UNICEF/WHO. 2009).
and sophisticated, costly, well-equipped laboratory facilities. In the developing world especially in remote areas, and after natural disasters, such testing and the infrastructure to support it is rarely available or accessible.
Reasons for Inadequate Water Quality Testing in Developing Countries
In order to know if water is safe to drink and if WHO-recommended Water Safety Plans for hygienic water management are achieving microbially safe water, drinking water and its sources must be tested regularly. One of the greatest challenges in
implementing safe water programs in developing nations is the lack of a way for water consumers to identify when their water is and is not microbiologically safe. Outside of areas served by well-equipped centralized water infrastructure, there is a lack of capacity to test water for fecal contamination by even the simplest of methods. In these places, the water people drink is never tested for microbial contamination, and consumers have no way to know if their water is microbiologically safe, if it requires treatment, or if a treatment method they are using is working.
Need for the H2S Test
Given the lack of access to microbial testing of water in resource-limited settings, there is a need for simple, low cost tests for fecal indicator microbes that can be
3
fecal microbes in water can potentially reduce pathogen exposures and waterborne disease. The access of water providers, public health authorities, emergency/disaster relief agencies, and water consumers to such tests empowers, educates, builds capacity and enables people and institutions to make critical health-related management decisions about water quality.
To develop such tests, the appropriate fecal indicators must be chosen as targets. Hydrogen sulfide-producing (H2S) bacteria have been proposed as an alternative fecal indicator. Methods for detection of H2S bacteria were developed in the early 1980s to fill this need for a simple, reliable field test for use by village public health workers to detect fecal contamination in drinking water (Manja et al. 1982; Sobsey and Pfaender, 2002). The H2S test detects the presence of microbial hydrogen sulfide production as a black iron sulfide precipitate in suspension. The H2S method to detect fecal contamination has been compared to more traditional fecal indicator bacteria and their detection methods and has demonstrated relatively good correlation with conventional bacterial indicators of fecal contamination (Sobsey and Pfaender, 2002).
However, prior laboratory and field research from other studies have made it clear that there currently is inadequate data to advocate for the H2S test as an indicator because it fails to meet many of the criteria for an ideal or desirable fecal indicator. An ideal fecal indicator should be absent in unpolluted water and present when the source of pathogenic microorganisms of concern (fecal contamination) is present. As described by Kaspar et al., (1992), this may not be true of H2S producing organisms. H2S producing organisms may themselves be pathogenic depending on the concentration present in the water of interest. In addition it is presently unclear whether or not H2S producing organisms are normally present in greater numbers than the pathogenic microorganisms of interest, and that they respond to natural environmental conditions and water treatment processes in a manner similar to the pathogens of concern. This research will examine some of these areas in greater detail and examine sewage and natural water sources to determine if the quantitative version of the H2S test meets the requirements of an ideal fecal indicator in both laboratory and field settings.
Importance of Improved Water Quality and Opportunities to Document it in Field
Studies
5
importantly, if field studies conclusively show that the quantitative H2S test works as well or better than current fecal indicator tests, there would be further evidence to recommend its adoption as a simple, low-cost alternative to currently available testing. As the
National Research Council noted (2006), “The most important biological attribute is a strong quantitative relationship between indicator concentration and the degree of public health risk.”However, field studies examining microbiological testing, especially water sampling, are often extremely expensive and time-consuming, further limiting their implementation.
Fortunately, this research benefitted from an already ongoing collaboration between UNC and USAID in Southeast Asia known as WaterSHED that was conducting a post-implementation assessment of household microbial water quality examining E. coli as an indicator of fecal contamination in rural areas of central Vietnam with East Meets West (EMW) Foundation. WaterSHED focuses on a collaboration of NGO,
government, and increasingly, private sector led programs to increase access to water and sanitation improvements in the rapidly developing economies of Southeast Asia. The goal of EMW is the proper functioning and financial sustainability of clean water and
Figure 1.1 A map of the Vietnam water quality study areas
For a quantitative version of the H2S test to be an acceptable indicator, data is necessary on both its field application, it relationship with an accepted fecal indicator, and its relationship with human illness. The post-implementation study presents an opportunity to compare E. coli and H2S levels in diverse household drinking water samples and then to compare both indicators separately to diarrheal disease.
1.2 Objectives
1. Evaluate different formats of the H2S test and determine the most effective
format for field use by:
a. Evaluating the application of the H2S test through an estimation of the concentration of H2S bacteria from the most probable number method using multiple dilutions and sample volumes.
b. Comparing lab made and commercially-made H2S media for their performance for detection and quantification in wastewater and fecally contaminated water.
c. Comparing fecal contamination of water using an optimized H2S test versus an E. coli test when applied to samples of fecally contaminated water and wastewater.
7
2. Using biochemical and molecular methods, determine whether there are
similarities or differences in the bacterial communities of waters and wastewaters that produce positive H2S test results.
a. Examine bacterial communities in samples with known fecal contamination-associated fecal microorganisms and determine if the H2S test can correctly identify these samples. b. Examine bacterial communities in natural water samples with unknown compositions and concentrations of fecal organisms and determine if the H2S test can correctly identify fecal contamination in these samples.
c. Examine bacterial communities in household drinking water samples in a group of small Vietnamese communities with unknown levels of fecal organisms and determine if the H2S test can correctly identify the levels of fecal contamination in these samples compared to a standard test for E. coli.
3. Determine the relationship between the presence and numbers of H2S producing
bacteria in drinking water and diarrheal disease risks in a longitudinal study compare it to the presence and levels of the widely accepted E. coli fecal indicator.
a. Determine H2S levels in household drinking water samples over time. Compare these levels to E. coli levels.
Chapter 2:
Literature Review
2.1 Diarrheal Disease and Waterborne Illness
Diarrheal disease is a major cause of morbidity and mortality in young children. Recent estimates suggest that diarrhea accounts for more than 1.6 million deaths annually (WHO, 2006). Mortality from diarrheal disease has decreased over the past four decades yet a recent study on the global burden of the disease suggests that there has not be an accompanying decrease in morbidity (Kosek et al., 2003). The average child in the developing world experiences 3 or more diarrheal disease episodes per year; accounting for more than 4 billion cases of diarrhea annually.
Pathogens transmitted through the fecal-oral route often cause diarrheal disease. They are typically considered enteric pathogens because they can infect the
gastrointestinal tract and once shed into the environment via excreta they are capable of being transmitted in a variety of ways including through contact with contaminated water and person-to-person. Disease transmission by water can be classified into four
9
waterborne pathogens. Waterborne pathogens comprise a broad range of microorganisms ranging from viruses to bacteria to parasites. For example, a recent case-control study in Ecuador documented cases of diarrhea as a result of all three classes of pathogens: E. coli, Rotavirus and Giardia (Eisenberg et al., 2006).
The H2S test has existed since 1982 and has been suggested as a test for the presence of fecal indicator bacteria in water. As described earlier, data exists showing a fairly strong correlation between the results produced by the H2S test and those produced by E. coli and other fecal indicator tests. However, to date there are no published studies showing a relationship between levels of H2S producing organisms in drinking water and human illness. One of the goals of this research is to determine if there is a relationship between H2S producing organisms in drinking water sources and diarrheal disease.
2.2 Hydrogen Sulfide Producing Bacteria
There are several genera and species of bacteria that can produce hydrogen sulfide. Hydrogen sulfide is a key compound in the sulfur cycle, and many microbes mineralize or decompose organic sulfur (from living cells or of synthetic origin), oxidize elemental sulfur and inorganic compounds such as sulfides and thiosulfate, or reduce sulfate and other anions to sulfide. H2S is produced when bacteria consume sulfate
A major group of environmental bacteria producing H2S are referred to as sulfate
reducing bacteria (SRB), and are key players in the global sulfur cycle. These bacteria are ubiquitous and occur in a variety of habitats, including marine and freshwaters and their sediments, soils, biofilms, microbial mats, intestinal contents, termite guts, walls of "black smokers" (hydrothermal sea vents) and in association with marine worms (Sobsey and Pfaender 2002).
Based on 16S rRNA sequencing the SRB can be phylogenetically divided into five distinct lineages: (1) Gram-negative mesophilic SRB (delta-Proteobacteria), (2) Gram-positive spore forming SRB (Low G+C Gram-positive Bacteria), (3) thermophilic bacterial SRB (Nitrospira phylum), (4) thermophilic bacterial SRB
(Thermodesulfobacterium group), and (5) thermophilic archaeal SRB (Euryarchaeota). In surface and subsurface geohydrothermal environments (e.g., hot springs, subsurface and submarine hydrothermal vents, etc), H2S is produced by sulfur respiration with molecular hydrogen.
11
with fecal contamination. Moreover, rapid reaction of the iron with sulfide already present in a water sample could produce a darkening in an H2S test almost immediately upon addition of the sample.
The relationship of sulfate-reducing bacteria (SRB) and microbial mats is another recently discovered and described phenomenon, and may affect the results and
interpretation of the H2S test. Many recent studies have shown that the presence of oxygen is not necessarily toxic to SRB and that their habitat range goes beyond anoxic environment. As Minz et. al (1999) noted, “the highest rates of sulfate reduction yet documented in a natural system were observed in the highly oxic near-surface region of a cyanobacterial microbial mat. Thus, the contribution of SRB to biogeochemical cycling may be significantly greater than is now appreciated.” In addition, other studies have shown that sulfate reduction occurred consistently within the well-oxygenated
photosynthetic zone of the mats during both high and low light conditions (Dillon et al. 2007). These studies suggest that SRB may be found in more environments than previously thought and may increase the number of microenvironments in which H2S producing bacteria that are not necessarily of fecal origin may be found.
2.3 H
2S Test Format
able to reduce organic sulfur to sulfide (as H2S gas), which then reacts rapidly with iron to form a black precipitate.
Over the last two decades, various investigators have tested this method and modifications of it in tropical and temperate regions, including Indonesia, Peru, Paraguay, and Chile, Nepal, Bangladesh, and South Africa (Ratto et. al., 1989;
Kromoredjo and Fujioka, 1991, Kaspar et al., 1992; Castillo et. al., 1994; Venkobachar et al., 1994; Rijal and Fujioka, 2001; Genthe and Franck, 1999; Pant et al., 2002; Anwar et al., 2004; Oates et al., 2003; Tewari et al., 2003; Pathak and Gopal, 2005; Roser et al., 2005; Gupta et al., 2008), and compared it to traditional bacterial indicators of fecal contamination in water.
The H2S method does not consistently measure the presence of total coliforms, fecal coliforms or E. coli. However, many members of the fecal coliform family are known H2S producers including: Klebsiella pneumoniae, K. oxytoca, Enterobacter cloacae, and Citrobacter freundii (LeClerc et. al 2001). Both enteric and non-enteric bacteria from a variety of habitats can release sulfide from proteins, amino acids and other reduced sulfur compounds by reduction reactions, including some coliforms (e.g., Citrobacter spp. and Budvicia aquatica) and other enteric bacteria (e.g., Clostridium perfringens) (Sobsey and Pfaender 2002). Therefore, there are many bacteria that may produce a positive result in the H2S test.
Wetzel (2001) noted that there would be little sulfate for bacteria to use if the concentration of the substrate is low in freshwater. However, where sulfate
13
complex organic compounds such as those included as substrates in H2S test medium, instead requiring short chain organic acids and other products of fermentation. It is possible that they would not grow and give positive results in H2S tests. However, in mixed communities of microorganisms SRB could give a positive result because other bacteria (heterotrophs) would ferment sugars and provide the organic acids used by the SRB to give a positive result (Widdel, 1988). For a positive reaction to occur, the test sample would need to become anaerobic, allowing the fermentative bacteria to produce the required short-chain organic acids and other preferred SRB substrates and leading to the growth of SRB in the test sample. These conditions are not as likely to be achieved in the incubation times typically used in H2S tests (1-2 days), though they are possible.
2.4 The H
2S Test as a Fecal Indicator Test
Microbial water quality indicators are used in hazard identifications, exposure assessments, and to evaluate the effectiveness of risk reduction actions (Committee on Indicators for Waterborne Pathogens 2004). Currently E. coli, enterococci, and the fecal coliform group are considered the “gold standards” of microbial water quality testing. WHO and the EPA do not consider the H2S test to be in this category. To be considered an ideal fecal indicator, a test must have the following attributes:
• Correlates to health risk
• Similar (or greater) survival to pathogens • Similar (or greater) transport to pathogens • Present in greater numbers than pathogens
• Broad applicability • Precision
• Adequate sensitivity • Rapidity of results • Quantifiable
• Measures viability or infectivity
• Logistical feasibility (Training and personnel requirements, Utility in field, Cost, Volume requirements)
15 Table 2.1 The H2S Test as an Ideal Fecal Indicator*
Ideal Indicator H2S Test Comments Reference Correlated to
health risk
Unknown. No published health studies to date
Similar (or greater) survival and transport to pathogens
Yes Survival similar to Salmonella and
Clostridium spp. Given that they are H2S producing organisms
Nagaraju and Sastri (1999), Martins et al. (1997), Castillo et al. (1994),
Present in greater numbers than pathogens
Yes Multiple non-pathogenic species produced H2S including:
Citrobacter freundii,
Salmonella,Proteus mirabilis, Klebsiella spp., Enterobacter spp., Acinetobacter spp., Morganella spp.
Nagaraju and Sastri (1999), Castillo et al. (1994), Manja et al. (1982)
Specific to a fecal source or
identifiable as to source of origin
Yes Tested by comparison with other fecal indicators
Manja et al. (2001 & 1982), Nagaraju and Sastri (1999), Venkobachar et al. (1994), Nair et al. (2001)
Ratto et al. (1989), Kaspar et al. (1992) Castillo et al. (1994), Martins et al. (1997),
Kromoredjo and Fujioka (1991) Genthe and Franck (1999) Sivaborvorn (1988)
Specificity to desired target organism
No Multiple Organisms Produce H2S Ratto et al. (1989), Kaspar et al. (1992),
Venkobachar et al. (1994), Sivaborvorn (1988),
Martins et al. (1997),
Broad applicability
Yes 1. Test has been applied to groundwater, surface water, bore wells, dug wells, rainwater cistern, and municipal water supplies 2. Test has been conducted on waters from:
a. India b. Peru c. Chile d. Indonesia e. South Africa f. Thailand
See below.
Ratto et al. (1989),
Castillo et al. (1994), Martins et al. (1997),
Kromoredjo and Fujioka (1991) Genthe and Franck (1999) Sivaborvorn (1988)
Precision Yes among samples, No between labs
1. Test 100% matched TC in raw water. 81% match for treated waters.
2. 100% Agreement with E. coli
Martins et al. (1997)
Rijal et al. (2000)
Adequate sensitivity
Yes in most cases 1. 82% and 86% agreement with FC test
2. Similar to E. coli test
3. 95% Agreement with FC Tests
Genthe and Franck (1999)
Rijal et al. (2000) Ratto et al. (1989)
Rapidity of results
Yes 24 h heavy/moderate contamination. 48 h for light contamination.
Manja et al. (2001 & 1982), Nagaraju and Sastri (1999), Venkobachar et al. (1994), Nikaeen et al. (2010) Castillo et al. (1994), Martins et al. (1997),
Quantifiable Yes with MPN method
1. Similar detection by the MPN version of the H2S test and E. coli
2. 90% agreement with MPN results
Rijal et al. (2000)
Manja et al. (2001)
Measures viability or infectivity
Yes Genthe and Franck (1999)
Logistical feasibility (Training and personnel requirements; Utility in field; Cost; Volume requirements)
Yes Cheap and easy-to-use; Minor Training Needed; Moderate Volume; Demonstrated Field Use
Nikaeen et al. (2010), Genthe and Franck (1999), Nagaraju and Sastri (1999), Venkobachar (1994), Kaspar et al. (1992), Kromoredjo and Fujioka (1991), Ratto et al. (1989), Manja et al. (1982),
* Parts of Table Adopted from Sobsey and Pfaender 2002
As has already been noted, though the most important biological attribute is a strong quantitative relationship between indicator concentration and the degree of public health risk, no studies have been published comparing H2S-producing bacteria to human illness. The Committee on Indicators for Waterborne Pathogens (2004) does say that correlating prospective indicator concentrations and pathogen levels is an alternative means of demonstrating the relationship to health risk, and this is what most research on H2S-producing bacteria has done.
As Table 2.1 shows, many investigators have attempted to speciate the bacteria that produce positive results in the H2S test. Castillo et al. (1994) found a large variety of bacteria in samples giving positive reactions in the H2S test, primarily Clostridium perfringens and members of the Enterobacteriaceae (including Enterobacter, Clostridia, Klebsiella, Escherichia, Salmonella, Morganella) and other organisms known to cause illness in humans (Acinetobacter, Aeromonas). Ratto et al. (1989) found Citrobacter was a common organism in positive H2S tests.
17
origin. Moreover, the H2S test may detect bacteria that are naturally occurring in water and not of fecal origin. One of the major weaknesses of H2S test for the detection of fecal bacteria is the variation in sensitivity and specificity for bacteria of fecal origin obtained across studies. Nikaeen et al. (2010) found that a P/A H2S test had only 60.9% agreement with standard MPN technique for fecal coliforms.
Previous studies applying the H2S test to groundwater samples have demonstrated false positive results, where H2S-positive samples contained no fecal coliforms or E. coli (Kaspar et al., 1992; Pant et al., 2002). False negative results, where H2S-negative samples were found to contain E. coli, have been shown in other studies (Desmarchelier et al. 1992,Tewari et al., 2003). In study of groundwater contaminated by septic seepage, Roser et al., (2005) found that an assessment based on a single (p/a) result was unable to distinguish unambiguously between heavily contaminated and mildly contaminated waters. However, multiple test sets, especially the ten by 10 mL arrays, provided a clear distinction between the most and least contaminated locations. While H2S producers showed this pattern, average H2S producer counts were greater than E. coli or
Enterococci and therefore the test probably detected bacteria other than these indicators. On the other hand, the test appeared much more sensitive than measurements of somatic and F-specific coliphages and protozoan pathogens which were detected in septic supernatant samples only. Overall, the H2S test seems to have fairly high sensitivity, specificity and precision when comparing the results across studies.
(SRC), both of which are accepted microbial indicators of fecal contamination (Roser et al., 2005). In addition, Gawthorne et al. (1996), found that when FC and E. coli testing failed to indicate the presence of Salmonella, the H2S test was successful in indicating the presence of 4 different Salmonella species. These studies indicate a need for investigation of the microbial community present in samples that give positive results for the H2S test.
If there is sulfide already present in a water sample, the rapid reaction with the iron in the test media could produce a darkening in an H2S test almost immediately upon addition of the sample. For this reason, it is very important that the test procedure include visual checking for a rapid positive reaction, after a few minutes to one hour of incubation (Sobsey and Pfaender 2002). A rapid positive result is an indication that the sample already contains sulfides. Such a result cannot be interpreted as an indicator of fecal contamination. Rather, a minimum of 18 hours is required for an adequate
interpretation from a highly contaminated sample, with more time required for samples suspected to have low to moderate contamination.
19
2.5 Modifications of the H
2S test
A variety of H2S test formats have been previously evaluated. Variations include: Media composition
Media preparation procedures,
Test formats, such as paper strip, powder, and agar media
Test endpoints {presence-absence, Most Probable Number (MPN), and membrane filter}, Sample volumes
Incubation times
Incubation temperatures.
incubation at 25°C-44°C. Gupta et al. found that the incubation period had significant effect on the effectiveness of the H2S test was in comparison to E. coli MPN testing, and as incubation period increased from 24 to 48 h, the effectiveness also increased from 47% to 95 at room temperature and 63% to 96% at 37°C.
Manja et al. (1982) also conducted a comparative assessment of H2S tests at various incubation temperatures and periods with standard tests and found that H2S producing organisms are consistently associated with the presence of coliforms in water. Recently, Tambekar et. al (2010) analyzed 1050 water samples from various sources (open and tube wells, restaurant and hotel water samples) and compared H2S –producing bacteria to E. coli at both 27ºC and 37ºC after 18, 24, and 48 h of incubation. They found that the number of samples testing positive for both H2S and E. coli using MPN
methodology was only 50% at 24 hours and rose to 81% after 48 hours. There was a 62% and 89% correlation of H2S and E. coli at 37ºC after 24 and 48 hours respectively.
These studies suggest that the adding cystine or cystiene to the media with longer incubation times (24-48 hours) and incubation temperatures in the range of 25-35°C can increase the ability of the test to detect low levels (5 CFU per sample) of H2S producing bacteria (Sobsey and Pfaender 2002).
Though much of the research done on the H2S test has compared its results to standard E. coli, TC, and FC measures, there are only a few studies that used an MPN format. The MPN format would provide more information than the standard
21
of bacterial contamination in water to waterborne disease risks. However, there has been no systematic comparison of the various types of H2S tests used by different
investigators, and no effort to standardize the test procedure.
2.6 Currently Available H
2S tests
Until recently, test media or materials were not readily available from commercial sources, and all of the H2S tests required the use of media formulated in the laboratory and applied to paper strips manually. However, several commercial H2S tests are now available, providing a basis for uniformity and standardization of testing. In India, there have been efforts to have the medium made commercially and to implement performance criteria for the commercially prepared medium. In the United States the HACH
Company has marketed an H2S test kit (PathoScreen) for use by small labs and
consumers. However, in its current form this commercial test is probably too complex and costly to be used for water quality testing in the developing world.
Research and development studies have been done in India by UNICEF (United Nations Children's Fund)-India and its partners (Rajiv Gandhi National Drinking Water Mission, Department of Drinking Water Supply, Ministry of Rural Development, Government of India) to develop, evaluate and disseminate the specifications for a H2S test and field kit for use in drinking water (Manja et al., 2001). The test is recommended for use by community workers to monitor water supply sources, and is not advocated as a replacement for conventional coliform and other bacteriological testing. In addition researchers in Bangladesh, India, and other parts of south and southeast Asia are
2010). One such example is the use of the test in post-flooding situations in Pakistan when a presence/absence version of the H2S test was used to assess microbial water quality (WASH Cluster meeting notes 2010).
Chapter 3:
Determination of an appropriate H
2S Test for
field application
3.1 Introduction
Hydrogen sulfide-producing (H2S) bacteria have also been proposed as alternative fecal indicators. Methods for detection of H2S bacteria were developed to fill a need for a simple, reliable field test for use by village public health workers to detect fecal
contamination in drinking water (Manja et al. 1982; Sobsey and Pfaender, 2002). The H2S test detects the presence of microbial hydrogen sulfide production as a black iron sulfide precipitate in solution. The H2S method to detect fecal contamination has been compared to more traditional fecal indicator bacteria and their detection methods and has demonstrated relatively good correlation with conventional bacterial indicators of fecal contamination (Sobsey and Pfaender, 2002).
The ultimate goal of the work reported here was to establish and validate a low-cost test to detect and quantify fecal contamination of water. Once developed, the test can be made accessible and affordable to people and institutions who now lack access to tests to determine the microbial safety of their water. The objectives were to: 1) validate existing H2S bacterial detection methods at ambient incubation temperatures; 2) develop and evaluate simple, inexpensive test formats to detect E. coli and H2S-producing
3.2 Materials and Methods
This test was evaluated for accuracy, precision, sensitivity and specificity using three different formulations of H2S media: commercially available media (Hach,
Loveland, CO), autoclaved lab-made broth, and tyndalized lab-made broth. The lab-made broths were a modification of the recipe of Manja et al. (2001). The tyndalized media was made by boiling for 5 minutes, cooling for 6 hours, re-boiling for 10 minutes, cooling for 24 hours, and a third boil for 10 minutes. All of these formulations were compared at three different incubation times (24, 48, 72 hours), and two temperatures (25°C and 35°C). Tests were run using both plastic Whirl-pak bags and 125-mL polypropylene bottles as test containers.
For all broth samples, 450mL of PBS was placed into 5L glass bottles and 50mL of spiked sewage water (0.5mL of sewage into 499.5mL of University Lake water) was added and then serially ten-fold diluted to 10-6 in 5L bottles. 3-100mL samples of each broth were aliquoted into plastic 125mL polypropylene bottles. 5mL of both Tyndalized and Autoclaved broths and 1 HACH PathoScreen reagent packet were added to the 100mL samples. 10mL and 1mL out of each 100mL sample were then aliquoted into 16x150mm glass test tubes and 13x100 glass test tubes, which were then capped and incubated at 37°C for 24 and then 48 hours. After 24 and 48 hours, each sample was
examined for the production of the black precipitate that is the byproduct of the H2S reaction. The number of positive samples was then scored and a MPN value was computed from those measurements.
25
Salmonella by membrane filtration on Bismuth Sulfite Agar, and detection of H2S producing facultative anaerobes by membrane filtration on H2S agar (a formulation consisting of the Hach PathoScreen H2S media and Bacto-Agar). The mpn Compartment Bag Test (CBT) was developed after confirmation of the success of the H2S media and equipment comparisons were complete. The CBT was then tested and compared to standard microbial indicator testing at 27°C, 37°C, and 44°C using the molecular and
biochemical method described in Appendix 4.
Statistical comparisons of the different candidate fecal indicator microbes (E. coli, H2S-producing bacteria) were made with side-by-side with standard fecal indicator tests and standard incubation conditions by both parametric and non-parametric methods, such as t-tests, ANOVAs, and correlation analyses. All correlation analyses will include a significance test of completion and a 95% Confidence Interval of R2.
3.3 Results
Comparison of 3 Broth Media
As Figure 1 shows, there was no significant difference in levels of H2S producing bacteria for the commercially available HACH media vs. the lab-made H2S broths (p= 0.49). This was true in both protected source University Lake Natural water, natural water spiked with sewage, and undiluted sewage.
Figure 3.1 Concentration of H2S Producing Organisms in various H2S Formats at 37°C over 5 experiments (MPN/100ml)
Comparison of MPN method at 24 vs. 48 hours
As Figure 2 shows, there was no significant difference in the levels of H2S producing bacteria in the HACH media after 24 hours of incubation vs. 48 hours (p= 0.45).
Figure 3.2 Concentration of H2S Producing Organisms in HACH Media at 24 vs. 48 hours at 37°C(MPN/100mL) Note that (A) and (B) were 2 different experimental trials
0 10 20
(MPN/100mL)
HACH 24 Hours
Tyndalized Broth 24 Hours 0 2.5 5 7.5 10 12.5 15 17.5 20 22.5 25 27.5 30 32.5 35 37.5 40 42.5 45 47.5 50 HACH 24
Hours (A) Hours (B) HACH 24 Hours (A) HACH 48 Hours (B) HACH 48
(MPN/100mL)
27
Comparison of 125mL Whirl-pak Bags vs. Plastic Bottles
As can be seen in Figure 3.3, the bacterial numbers detected by an MPN H2S test incubated in plastic bags were slightly higher than numbers from tests incubated in bottles, but the difference was not significant after 48 hours (p= 0.31).
Figure 3.3 Concentration of H2S Producing Organisms in Bags vs. Bottles at 37°C (MPN/100mL)
Comparison of H2S and E. coli MPN method
The ability of the H2S test to detect fecal contamination was also compared to the detection of E. coli using the Colilert Quantitray MPN method. This analysis was done for natural water samples spiked with primary effluent (Table 3.1) and drinking water samples from Vietnam (Table 3.2). As shown in Table 3.1 and Table 3.2, comparison of presence or absence of H2S producing bacteria and E. coli in primary effluent spiked natural water gave similar results for both fecal indicators (p=0.0000).
0 1 2 3 4 5 6 7 8 9 10
Bags 24 hours Bottles 24 hours Bags 48 hours Bottles 48 hours
MPN/100mL
Table 3.1 Comparison of H2S versus E. coli tests based on sample positivity or negativity for sewage and seeded water experiments under controlled lab conditions.a
Test Outcomes + - Total
E. coli + 8 0 8
- 1 5 6
Total 9 5 14
Sensitivity 0.889 PPV 1
Specificity 1 NPV 0.833
Kappa 0.408
a (SE) =Sensitivity, (Sp) =Specificity, (PPV) =Positive Predictive Value, & (NPV)= Negative Predictive Value
In the indicator and methods comparison for water supplies in the Central region of Vietnam, given a positive H2S test, there was a 76% chance that there was also E. coli present in the water. Given a negative H2S test, there was a 65% chance that E. coli was not present in the water. If E. coli were absent from the water samples, there was a 82% chance that the H2S test was negative for the same volume of water.
Table 3.2 Comparison of H2S versus E. coli tests based on sample positivity or negativity for piped and treated water samples in Central Vietnam.a
H2S
Test Outcomes + - Total
E. coli (from
Colilert) + 467 145 612
- 359 653 1012
Total 826 798 1,624
Sensitivity 0.565 PPV 0.763
Specificity 0.818 NPV 0.645
Kappa 0.382
a(SE) =Sensitivity, (Sp) =Specificity, (PPV) =Positive Predictive Value, & (NPV)= Negative Predictive Value
Cost of the H2S Compartment Bag Test
29
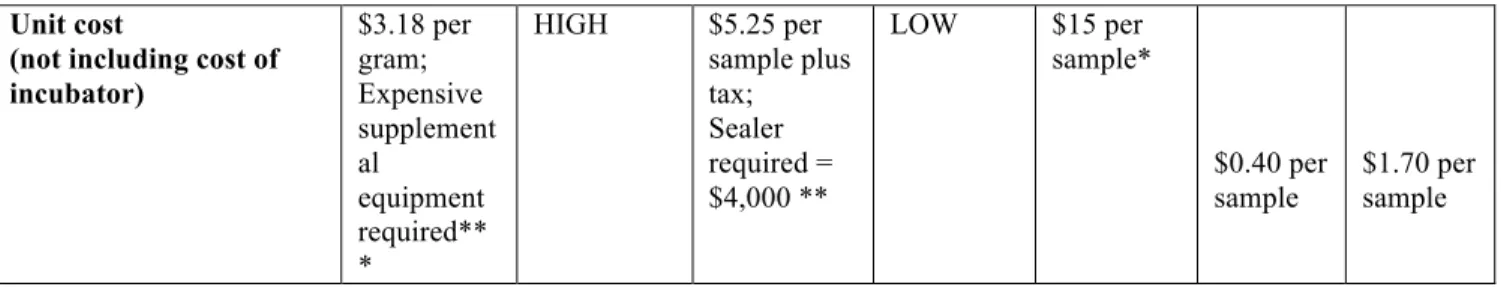
Table 3.3 shows, the availability of electricity, amount of space to run the test, amount of sample water available, the availability of trained personnel as well as the amount of money available for testing are just a few factors that must be considered when choosing a test. Other factors include:
• Volume of sample the test analyzes • Quantification method
• Need for electricity
• Need for supplemental equipment • 1 step vs. multiple step
• Perishability
• Portability/compactness • Convenience of application • Presence/absence
• Easily visualize E. coli on point (range of countable CFUs) • Sensitivity
• Specificity • Precision • Unit cost
• Performance of method at non-conventional temperatures
(National Research Council of the National Academies, 2004)
These factors are outlined in the table below and described according to method. The table is followed by detailed comparisons of the methods across criteria. The following abbreviations are used: Membrane filtration with MI agar (MI), membrane filtration with Bio-Rad agar (BR), Colilert method (COL), Petrifilm (PET), Easygel (EZ), and the H2S CBT (CBT). The unit cost of the test of particular importance, because it is only useful in developing country and emergency settings if it is affordable. None of the currently available fecal indicator tests are available at an affordable level for widespread use in low-resource settings. MTF and MF tests require expensive supplemental
equipment and materials such as membrane filter funnels, Petri dishes, and test tubes. The QT test costs $5.25 per 100 mL sample, which is still too expensive for widespread use in low-resource settings, and this cost does not include the $4000 QT sealer required to perform the test. While the EZ method does not require any expensive supplemental equipment, the unit cost per test is $15. In many low-resource areas of the world, a large portion of the population lives on less than $1-$2 a day. Thus, in order for a test to be affordable it would have to cost significantly less than those currently available.
31
Table 3.3. Criteria for low-cost simple drinking water test for E. coli and H2S producing bacteria
*(Micrology Laboratory, 2007)
** (IDEXX Colilert Customer Service Representative)
MI Agar BioRad Colilert Petrifilm EasyGel H2S CBT
E. Coli CBT Applied sample volume
for test
1 mL or 10 mL
1 mL or 10 mL
100 mL 1 or 5 mL 1 mL or 5 mL
100ml 100ml
Convenience of application
NO NO NO YES YES YES YES
Portability/compactness NO NO NO YES YES YES YES
Need for electricity YES YES YES YES YES NO NO
Need for supplemental equipment
YES YES YES NO NO NO NO
Single step vs. multiple step
Multiple Multiple Multiple 3 steps 4 steps 3 steps 3 steps
Perishable YES YES YES YES YES YES YES
Readily detectable endpoint
YES YES YES YES YES YES YES
Easily visualize fecal organism at endpoint (countable range of CFUs
Adequate Adequate Adequate Can be limited with small sample volume. Can be limited with small sample volume. Limited to less than 100MPN /mL Limited to less than 100MPN /mL
Broth vs. agar vs. pectin Agar agar Broth gelling agent
Pectin Broth Broth
Sensitivity YES YES YES NO NO YES YES
Specificity YES YES YES YES NO YES YES
*** (Fisher Scientific, 2008)
As can be seen above, the H
2S CBT is among the simplest tests to perform, and
is the lowest cost of all currently available fecal indicator tests. In addition, it
doesn’t require incubation in tropical environments, and requires no other
supplemental equipment.
Comparison of the H
2S Compartment Bag Test and the IDEXX
Quantitray system
An additional 9-week analysis was done to examine the effects of temperature (27°C, 37°C, and 44°C) on the H2S test performed in the compartment bag versus the IDEXX Quantitray system. In addition, molecular and cultivation microbial analysis was done to determine what organisms were found in positive H2S tests at different
temperatures and how that compared with the initial water sample before the H2S test was performed.
Table 3.4 shows that concentrations of H2S producing bacteria in the CBT compared to the QT were not significantly different at incubation temperatures of 25oC, or 37oC, or Unit cost
(not including cost of incubator)
$3.18 per gram; Expensive supplement al
equipment required** *
HIGH $5.25 per sample plus tax; Sealer required = $4,000 **
LOW $15 per sample*
$0.40 per sample
33
44oC. However, results at 44oC were significantly different between from results at 25oC, 37oC in both the CBT and the QT.
Table 3.4. Comparison of the H2S Compartment Bag Test and the IDEXX Quantitray system at 27°C, 37°C, and 44°C
Dunn's Multiple Comparison Test
Significant @ P < 0.05?
25 Tray vs 25 Bag No
25 Tray vs 37 Tray No
25 Tray vs 37 Bag No
25 Tray vs 44 Tray Yes
25 Tray vs 44 Bag Yes
25 Bag vs 37 Tray No
25 Bag vs 37 Bag No
25 Bag vs 44 Tray Yes
25 Bag vs 44 Bag Yes
37 Tray vs 37 Bag No
37 Tray vs 44 Tray Yes
37 Tray vs 44 Bag Yes
37 Bag vs 44 Tray Yes
37 Bag vs 44 Bag Yes
A subsequent analysis more closely examined the temperature range between or 37oC and 44oC to provide a maximum temperature value at which the H2S method can be guaranteed effective since ambient temperatures in some environments can sometimes surpass 44oC. It is important to determine if the CBT test cannot function in these environments and prompted a questioning of the maximum temperature at which this method could be effectively used. In an effort to determine this upper limit, we evaluated the growth of three different coliform bacteria (Salmonella, Citrobacter, Proteus) at incremental temperatures approaching 44ºC and estimated the concentration of the bacteria using the most probable number (MPN) method.
Figure 3.4 Concentration of H2S Producing Organisms (Salmonella, Citrobacter, Proteus) at 37°C,
39°C, 41°C, 43°C, and 44°C, (MPN/100mL)
As shown in Figure 3.4, none of the organisms grew substantially beyond 39ºC. Based on this information, and the results from the CBT versus Quantitray experiments, it is inadvisable to perform the H2S CBT above 39ºC.
0 5 10 15 20 25 30 35 40
37 39 41 43 44
MPN / 100 mL
Temperature (°C)
Temperature vs. MPN (As Average of 3 Trials)
35
3.3 Conclusions
The H2S MPN compartment bag is easy-to-use, economical, and fairly robust as a test that could also be used in low-resource settings. Laboratory testing has shown that there is no significant difference between the levels of H2S producing bacteria given 3 different broth recipes, at 24 and 48 hours, and in different sample containers. In addition, lab testing has shown that there is no significant difference between the levels of H2S producing bacteria in the standard methods and those determined by the compartment bag. Both laboratory and field-testing with potable and non-potable water samples showed that the presence of H2S-producing bacteria was strongly associated with the presence of E. coli.
Chapter 4:
Comparison of Culture-Based and TRFLP
Analysis to Identify H
2S Producing Microorganisms in Sewage
4.1 Introduction and Background
One of the major weaknesses of the H2S test for the detection of fecal bacteria is the variation in sensitivity and specificity for bacteria of fecal origin obtained across different studies. Previous studies applying the H2S test to groundwater samples have demonstrated false positive results, where H2S-positive samples contained no fecal
coliforms or Escherichia coli (Kaspar et. al 2009, Pant et. al 2002). False negative results, where H2S-negative samples were found to contain E. coli, have been reported in other studies (Tewari et. al 2003). The observed lack of uniformity, reported inconsistencies and the unavailability of the test in a ready-to-use, quantitative form in many locations are barriers to the widespread adoption and use of the H2S tests. For the H2S bacteria test to be an acceptable tool to evaluate water quality for the presence and magnitude of fecal contamination, data are needed indicating which microorganisms produce positive results in the test, under what conditions test results indicate actual fecal contamination of water, and ultimately a quantitative version of the test is needed to estimate the magnitude of fecal contamination.
37
testing water samples, for the test to be effective it must first be capable of detecting fecal bacteria when applied to sewage samples, as waters contaminated with human sewage are used as drinking water sources in many impoverished areas worldwide. Using culture-based biochemical and culture-independent molecular techniques, this research is focused on determining the types of microbial community members, including fecal indicator organisms, pathogens, and other microbes present in human sewage samples that are detected in a quantitative H2S test as microorganisms of concern to human health.
Molecular genetics techniques utilizing extracted nucleic acids now allow microbial community analysis to be coupled with a phylogenetic framework. Terminal Restriction Fragment Length Polymorphism (TRFLP) was the nucleic acid based method employed in this study because it provides a way to determine the presence of common species in a sample with or without culturing the organisms, facilitates finding major differences between communities, and allows for testing hypotheses based on a
comparison of samples (Kent et. al 2003). By using TRFLP, Liu et al. (1997) were able to distinguish all bacterial species in a model bacterial community, and the pattern was consistent with the predicted outcome. TRFLP analysis of complex bacterial
communities revealed high species diversity in activated sludge, bioreactor sludge, aquifer sand, and termite intestines (Blackwood et. al 2007, Kim and Marsh 2004). Others have also compared the results of TRFLP and the traditional culture-based approach and found that TRFLP often provides a more detailed analysis than the
from municipal sewage. If both techniques found that this new H2S test was effective with samples that should have organisms of concern, future analysis can focus on the effectiveness of the test with waters that may or may not contain organisms normally found in sewage and other fecal waste sources that are a concern to human health.
4.2 Materials and Methods
Culture-Based Biochemical Detection Methods
To determine the genera and relative numbers of bacteria present in sewage-spiked phosphate buffered saline (PBS) samples, grab samples of 120 ml volumes of raw untreated sewage were obtained on 3 separate occasions from the Orange Water and Sewer Authority (OWASA) wastewater treatment plant (Chapel Hill, NC). The OWASA system serves a university community having no major sources of industrial wastes. Each sample of collected sewage was considered a separate experiment, since samples were collected every 2 weeks over a six-week interval. From the 120-ml raw, untreated sewage sample, duplicate 10 ml aliquots were removed and pelleted at 3,500 rpm for 20 min, and the pellets were overlaid with 300 µl of the original sample and archived at -80°C for future DNA analysis (see Figure 1). PathoScreen reagent for H2S bacteria testing of a 100 ml water sample (Hach Company, Loveland, CO) was added to the remaining 100 ml of raw sewage in a 5-compartment MPN bag and incubated at 37°C for 24 h. The MPN bag is a clear polyethylene bag, 15 cm wide x 23 cm long (Whirl-Pak®, Nasco, Fort
39
PBS to a dilution of 10-5. Then, 100 µl volumes of each dilution were spread onto duplicate 13 x 150 mm diameter plates of the following agar media to isolate colonies: Bio-Rad RAPID' E. coli 2 agar, Salmonella-Shigella agar, Phenyl ethanol agar, m-Aeromonas Selective agar, and H2S agar (22). All plates were incubated aerobically at 37°C for 24 h. Isolates from spread plates were obtained by streak plating characteristic colonies onto Tryptic Soy Agar on three successive days. These colony isolates were archived in 0.8 ml of Tryptic Soy Broth at -80°C. The isolates were then tested to
determine if they produce H2S by culturing in H2S medium and were further identified at the genus and species level using standard biochemical identification test kits,
Figure 4.1 A workflow diagram describing of the culture based biochemical identification and the TRFLP processes.
DNA Extraction
41
through a 1% TAE Agarose gel containing 15 µl of ethidium bromide per 100 ml of
Agarose gel. Isolated gDNA was stored at -80ºC until it was used for PCR reactions.
PCR Conditions
3 µl volumes of each DNA sample were added to 97 µl of Master Mix (per sample: 10 µl 10X Reaction Buffer; 0.8 µl dNTP [Deoxynucleotide Triphosphate]; 83.7 µl PCR grade water; 0.5 µl each of the bacterial-specific 16S rDNA primers 8F-Hex 5’-AGA GTT TGA TC(A/C) TGG CTC AG and reverse primer 1492R 5’-GGT TAC CTT GTT ACG ACT T; 0.5 µl of Qiagen HotstarTaq DNA polymerase (Qiagen, Valencia,
California). Each DNA sample was amplified in triplicate. The forward primer for the PCR reaction was labeled on the 5’ end with a hexamide fluorescent marker to allow the terminal fragment to be tracked.PCR was performed in a Perkin-Elmer 9600
thermocycler by using an initial denaturation step of 15-min at 95°C, followed by 35 cycles consisting of denaturation (1 min at 94°C), annealing (1 min at 50°C), and
extension (2 min at 72°C) and a final extension at 72°C for 7 min. PCR replicates of each sample were then pooled and purified by using the UltraCleanTM PCR Clean-up Kit (MoBio Laboratories Inc, Solana Beach, CA) according to the manufacturer’s protocol.
TRFLP
µl of Reaction Buffer#4, 1µl BSA, 58µl PCR grade water, and 1µl of restriction enzyme. For MspI, 30 µl of purified PCR product (approximately 30 µg) was mixed with 10 µl of Reaction Buffer#4, 1µl BSA, 58µl PCR grade water, and 1µl of restriction enzyme. Restriction digests were incubated overnight at 37°C. For clean-up, restriction digests were heat treated at 60°C for 20 min to heat inactivate the restriction enzymes. The QIAquick Nucleotide Removal Kit (Qiagen, Hilden, Germany) was then used to purify the digested DNA according to the manufacturer’s protocol, except 50 µl of warmed (60°C) PCR grade water was added instead of kit elution buffer, and the water was allowed to incubate on the column for 5 min prior to elution of the DNA. DNA samples were then frozen at -20º C. Fragment detection was carried out at the MSU Genomics Technical Support Facility according to their detection protocols (http://gtsf.msu.edu/dna-fingerprinting-and-genotyping).
Fragment Analysis
Data tables containing fragment size and abundance data for each digest of the DNA of sewage samples was exported from GeneScan, and the resulting text files were sent for pattern detection by the In Silico© database. Each file contained all the detected fragments for a given restriction digest (e.g., data obtained from one of the HhaI digests for a sample would be contained in one file, MspI fragments would be contained in another file, and RsaI fragment data would be contained in a third file). Each entry in these data files contained fragment length size, retention time on gel, peak height, fragment identification number, and a peak area found in the sample. For calculation of the diversity indices, the TRFLP analysis peak area was used as the amount
43
the total fluorescence of the sample. The results for each diversity measure are representative of the number of fragments in each experimental sample.
In Silico© Output
Pattern detection and pattern identification were carried out using the In Silico©, software package (In Silico©, RTP, NC). The In Silico© output is a comprehensive dataset which includes the following diversity analysis values: Simpson Index of diversity, a measure of the richness (the number of different species per sample) and evenness; Reciprocal Simpson, an inverse of the Simpson’s index (lowest value is 1; the higher the value the greater the diversity); Species richness (the number of species within a community); and the Shannon Weaver diversity index, which is one of several diversity indices used to measure diversity in categorical data and takes into account the number of species and the evenness of the species. The index is increased either by having
additional unique species, or by having greater species evenness (Blackwood et. al 2007, Kim and Marsh 2004). In Silico© also provides information on the fragment parameters, including: total fragment utilization, which is the proportion of the fragments used in the analysis compared to the total number of fragments available; the total number of
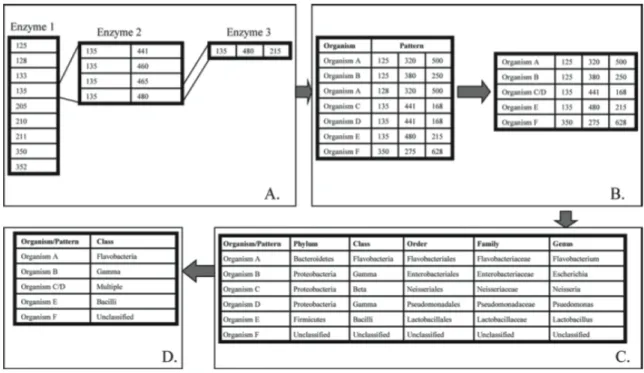
Figure 4.2 A flow diagram describing the In Silico software (In Silico LLC, Fuquay-Varina, NC) process used to generate TRFLP community profiles (Johnson et. al. 2009).
A) Fragments generated from separate restriction digests are sequentially matched to patterns found in the In Silico database. B) Matched patterns are compressed by removing extraneous patterns that belong to a single organism, as in organism A, or by combining multiple organisms that have the same pattern, as in organism C and organism D. C) Patterns are then matched to phylogenetic information in the In Silico software and reported at 5 different levels. D) In the final output of the In Silico software package, organisms are identified by genera. Note that the pattern belonging to organisms C and D is identified as “multiple” because the 2 organisms belong to different classes. Organism F is defined as unclassified because no phylogenetic information is available for the pattern.
45 type of microorganism.
The “unclassified” group of patterns differs from unmatched fragments because little or no phylogenetic information is deposited with their respective sequence. Unclassified patterns make up a large percentage of the data since sequences are often deposited without sufficient phylogenetic identification. Sequences in the “multiple classification” category fit into more than one distinct phylogenetic group and consist of all the unique species from phylogenetically different groups that match a single fragment pattern.
Further Phylogenetic Assignment
Given the relatively high percentage of fragment patterns from the In Silico© output that were either in the “Multiples” or “Unclassified” categories, further analysis was conducted. Any fragment pattern that was assigned to either the “Multiples” or “Unclassified” category was then re-analyzed by entering it into the BLAST tool in the NCBI nucleotide database (http://www.ncbi.nlm.nih.gov/nucleotide/), and the retrieved nucleic acid sequence listed in NCBI was then entered into the Michigan State University Ribosomal Database Project classifier website
(http://rdp.cme.msu.edu/classifier/classifier.jsp) using a 95% confidence threshold for