CHRONIC EARLY CHILDHOOD EXPOSURE TO INORGANIC ARSENIC IS ASSOCIATED WITH A TNF-MEDIATED PROTEOMIC SIGNALING RESPONSE
Lisa Smeester
A thesis submitted to the faculty at the University of North Carolina at Chapel Hill in partial fulfillment of the requirements for the degree of Master of Science in the Department of Environmental Sciences and Engineering in the Gillings School of Global Public Health.
Chapel Hill 2016
Approved by: Rebecca C. Fry
ABSTRACT
Lisa Smeester: Chronic Early Childhood Exposure to Inorganic Arsenic is Associated with a TNF-mediated Proteomic Signaling Response
(Under the direction of Rebecca C. Fry)
Exposure to inorganic arsenic (iAs) in drinking water remains a global issue of concern and is associated with a range of health outcomes, including immune dysfunction. Young children have been identified as a particularly sensitive population, yet mechanisms of adverse health outcomes are understudied. Here we set out to examine the effects of iAs exposure on circulating serum proteins in adolescents. To identify proteins as potential indicators of disease, levels of total urinary arsenic (U-tAs) and its methylated metabolites were determined and serum proteins assessed for differences in expression. The results indicate an enrichment of TNF-regulated immune and inflammatory response proteins that display decreased expression levels in relation to increasing U-tAs. Notably, when analyzed in the context of the arsenical
To MFC & MGS, for the countless hours of “bunny duty,” shifting birthday and holiday celebrations to more convenient dates, and your determination to find wi-fi in the middle of nowhere so I could connect to Sakai on our road trips. My decision to return to school threw our
lives into upheaval and never once was I met with anything but encouragement and understanding.
ACKNOWLEDGEMENTS
TABLE OF CONTENTS
LIST OF TABLES ... vii
LIST OF FIGURES ... viii
LIST OF ABBREVIATIONS ... ix
CHAPTER 1: INTRODUCTION ... 1
CHAPTER 2: METHODS ... 5
Study Subjects and Sample Collection ... 5
Questionnaires ... 5
Determination of arsenic concentrations in water and in urine ... 6
Assessment of protein expression in serum ... 6
Statistical Analyses ... 7
Functional Analyses of Proteins ... 7
CHAPTER 3: RESULTS ... 9
Study characteristics ... 9
Identification of proteins associated with total urinary arsenic and arsenic metabolites . 10 Transcription factor regulation of arsenic-associated proteins ... 13
CHAPTER 4: DISCUSSION ... 14
APPENDIX 1: SUPPLEMENTARY TABLE 1 ... 18
APPENDIX 2: SUPPLEMENTARY TABLE 2 ... 25
LIST OF TABLES
LIST OF FIGURES
Figure 1 – Arsenic metabolism is a multi-step process ... 3
Figure 2 – Total number of %iAs, %MMA, and %DMA associated proteins
as well as commonality among arsenical associated lists multi-step process ... 11 Figure 3 – Interacting network of U-tAs associated serum proteins and upstream
LIST OF ABBREVIATIONS
As Arsenic
iAs Inorganic arsenic BMI Body mass index
DAVID The Database for Annotation, Visualization, and Integrated Discovery DMAs DMA(III) + DMA(V)
DMAIII Dimethylarsinous acid DMAV Dimethylarsinic acid
EPA Environmental Protection Agency HRP Horseradish peroxidase
ICP-MS Inductively coupled plasma mass spectrometry IPA Ingenuity Pathway Analysis
KEGG Kyoto Encyclopedia of Genes and Genomes
MMAs MMA(V)+MMA(III)
MMA(III) Monomethylarsonous acid MMA(V) Monomethylarsonic acid ppb Parts per billion
TNF Tumor necrosis factor U-iAs Urinary inorganic arsenic U-DMAs Urinary DMA(III) + DMA(V) U-MMAs Urinary MMA(III) + MMA(V) U-tAs Urinary total arsenic
CHAPTER 1: INTRODUCTION
Exposure to elevated levels of inorganic arsenic (iAs) in drinking water remains a global issue of concern. Over 100 million people worldwide are exposed to levels of iAs in their drinking water that exceed the World Health Organization’s recommended limit of 10 µg/L (WHO 2011). While new populations continue to be identified, those at risk of elevated exposure include, but are not limited to, populations in Bangladesh, Mexico, the United States, and China, among others (Mandal and Suzuki 2002).
Chronic exposure to iAs is associated with a range of health outcomes in adults,
The mechanisms underlying the health effects of childhood exposure to iAs remain understudied. Previous studies examining immune functioning in iAs-exposed children suggest that iAs can act as an immunosuppressant. Specifically, it has been reported that children with iAs exposure exhibited decreased plasma concentrations of the Th1 cytokines, TNF-α and IL-2, and reduced responsiveness on functional immune tests (Soto-Peña, Luna et al. 2006, Ahmed, Moore et al. 2014). In support of these data, there is also evidence that iAs exposure during childhood impairs monocyte functioning and immune-specific reactive oxygen species (ROS) signaling (Pineda-Zavaleta, Garcı́a-Vargas et al. 2004, Luna, Acosta-Saavedra et al. 2010). Paradoxically, there is also substantial evidence that iAs acts as a pro-inflammatory agent in children. For instance, in utero exposure to arsenic is associated with an activation of
inflammation, including the NF-kB signaling cascade (Fry, Navasumrit et al. 2007, Bailey, Laine et al. 2014). Early life exposure has also been linked to iAs-induced chronic inflammation
mediated impaired lung function (Olivas-Calderon, Recio-Vega et al. 2015). Taken together, this suggests that iAs can act as an immunomodulatory agent during childhood and development, possibly impacting maturation of the immune system during a critical period of development (Luna, Acosta-Saavedra et al. 2010, Dangleben, Skibola et al. 2013). Such an effect may play a critical role in the development of the diverse adverse health effects associated with iAs
exposure.
Arsenic metabolism is a multi-step process (Figure 1), with six major arsenic species that have been identified in human urine. These species include inorganic arsenics (iAsIII and iAsV), which are metabolized to the monomethylated arsenic species (MMAs), monomethylarsenous acid (MMAIII) and monomethylarsonic acid (MMAV). MMAs are methylated again to become
(DMAV) (Tseng 2007). The efficiency of these methylation reactions has been identified as an important factor underlying the effects observed following iAs exposure as iAs, MMAs, and DMAs are differentially associated with As-related outcomes such as hypertension,
atherosclerosis, cancer, and chromosomal aberrations (Huang, Tseng et al. 2007, Tseng 2007).
Figure 1. Arsenic metabolism is a multi-step process. Arsenic is reduced from its V to III form by arsenic reductase, using glutathione (GSH) as an essential co-factor. Arsenic is methylated by Arsenic (+3 Oxidation State) Methyltransferase (AS3MT), using S-adenosyl methionine (SAM) as the methyl donor.
Additionally, we have previously demonstrated that urinary iAs is positively associated with lower gestational age and newborn length, while urinary MMAs is associated with lower gestational age and birth weight (Laine, Bailey et al. 2015). Therefore, inter-individual
differences in the efficiency of arsenic methylation may play a role in metabolite-specific associated disease risk. The impact that differences in iAs metabolism may have on protein expression during childhood is currently unknown.
CHAPTER 2: METHODS
Study Subjects and Sample Collection
The study sample for the present analysis represents a subset of 40 subjects of a cohort reported previously (Recio-Vega, Gonzalez-Cortes et al. 2014). Participants were children, both male and female, aged 6-12 years living in one of four rural communities in the Comarca Lagunera area, located in north-central Mexico. These communities represent those with the highest arsenic tap water levels (104-360 ppb) detected in the last 20 years in the area. Arsenic is present in the local water supply due to the over-extraction of groundwater. Children included in this study had mothers who remained in these communities for the duration of their pregnancy, and have since remained residents of these same communities.
Questionnaires
Information was collected through in-person interviews and included socio-demographic variables (education, socioeconomic status), lifetime residential history, lifestyle factors
Determination of arsenic concentrations in water and in urine
Drinking water samples (well) were collected from each rural community included in the study and analyzed for inorganic arsenic levels. Well water samples from each rural community are representative of the water that participants drank and is provided through the unique local water supply system. Individual exposure was assessed based on U-tAs. A first morning void urine sample was collected in sterile 120-mL screw-topped polypropylene containers. Urine samples were analyzed as described previously (Olivas-Calderon, Recio-Vega et al. 2015). Briefly, samples were analyzed at the Arizona Laboratory for Emerging Contaminants,
University of Arizona, Tuscon, Arizona. Urinary AsV, AsIII, MMAV, DMAV, and arsenobetaine were separated by HPLC and concentrations were analyzed by inductively coupled plasma mass spectrometry (ICP-MS). Standard Reference Water, SMR 1640 (NIST, Gaithersburg, MD, USA) and the freeze-dried Urine Reference Material for trace elements (Clinchek-control; RECIPE Chemicals instruments GmbH, Munich, Germany) were used as quality controls for urinary arsenic measurement.
Assessment of protein expression in serum
Subjects selected for proteomic assessment are representative of the extremes of exposure (median U-tAs high = 399.35 µg/L, median U-tAs low = 26.03 µg/L). As detailed in our prior
each serum sample. Briefly, primary amines of serum proteins are biotinylated and hybridized to a membrane array containing antibodies specific for each of the 507 protein targets, incubated with a horseradish peroxidase (HRP)-streptavidin conjugate, and detected by chemiluminescence following incubation with an HRP substrate buffer. The protein array contains two types of positive controls: a biotin-labeled protein, independent of the sample, that is spotted on each array in a series of known concentrations enabling signal intensity normalization across arrays, as well as an internal positive control which is an exogenous, nonmammalian protein added to the serum sample prior to biotinylation, serving as a control for the labeling and incubation steps.
Statistical Analyses
Statistical analyses were performed using Partek Genomics Suite software (version 6.6; Partek, Inc., St Louis, MO). All data were analyzed for their distribution patterns and
homogeneity, and filtering was used to remove any non-expressed proteins. Multivariable regression models were used to examine relationships between individual arsenic measures (U-tAs, %iAs, %MMAs, %DMAs) and the normalized, background-subtracted signal intensities of the 393 proteins. Age, sex, and body mass index (BMI) were selected as a priori covariates due to their potential influence on protein expression levels and were controlled for in the models. Statistical significance was defined as p < 0.05, with false discovery (type II error) controlled for using a q-value <0.1.
Functional Analyses of Proteins
CHAPTER 3: RESULTS
Study characteristics
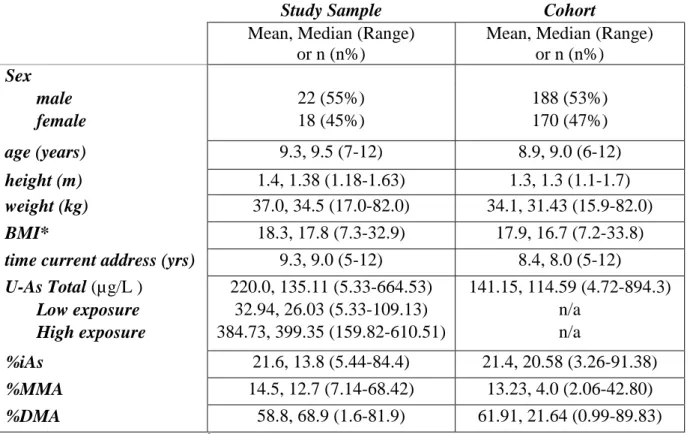
Demographic characteristics of the study sample (n=40), as well as those of the entire cohort (n=358), can be found in Table 1. These subjects were selected as representatives of the extremes of exposure (median U-tAs high = 399.35 µg/L, median U-tAs low = 26.03 µg/L).
Anthropometric characteristics recorded include sex, age, (years) weight (kg), and BMI (calculated as weight/height2). The majority of the subjects were male (n=22, 55%), have lived at their current residence their entire lives (n=36, 90%), and were, on average 9.3 years of age (range 7-12). Other possible sources of arsenic exposure, including diet (seafood, rice and others), agrochemicals, fuels, preservatives or other compounds containing arsenicals, were negligible (Recio-Vega, Gonzalez-Cortes et al. 2014).
Indicators of arsenic exposure examined include total urinary arsenic (U-tAs; µg/L), as well as the percentages of inorganic arsenic (iAs), monomethylated arsenicals (MMAs) and dimethylated arsenicals (DMAs) as indicators of arsenic metabolism. All samples were within detectable limits and U-tAs, defined as the sum of U-iAs, U-MMAs and U-DMAs, ranged from 5.33 g/L to 664.53 g/L. The average proportions of U-tAs were 24.4% iAs, 14.9% MMAs,
Table 1. Demographic and exposure characteristics of study population
Study Sample Cohort Mean, Median (Range)
or n (n%)
Mean, Median (Range) or n (n%) Sex
male 22 (55%) 188 (53%) female 18 (45%) 170 (47%) age (years) 9.3, 9.5 (7-12) 8.9, 9.0 (6-12) height (m) 1.4, 1.38 (1.18-1.63) 1.3, 1.3 (1.1-1.7) weight (kg) 37.0, 34.5 (17.0-82.0) 34.1, 31.43 (15.9-82.0) BMI* 18.3, 17.8 (7.3-32.9) 17.9, 16.7 (7.2-33.8) time current address (yrs) 9.3, 9.0 (5-12) 8.4, 8.0 (5-12) U-As Total (µg/L ) 220.0, 135.11 (5.33-664.53) 141.15, 114.59 (4.72-894.3) Low exposure 32.94, 26.03 (5.33-109.13) n/a
High exposure 384.73, 399.35 (159.82-610.51) n/a
%iAs 21.6, 13.8 (5.44-84.4) 21.4, 20.58 (3.26-91.38) %MMA 14.5, 12.7 (7.14-68.42) 13.23, 4.0 (2.06-42.80) %DMA 58.8, 68.9 (1.6-81.9) 61.91, 21.64 (0.99-89.83) * calculated as weight/height2
Identification of proteins associated with total urinary arsenic and arsenic metabolites
Figure 2. Total number of %iAs, %MMA, and %DMA associated proteins as well as
commonality among arsenical associated lists. Venn diagram illustrating the number of serum protein that have a statistically significant association between expression levels and urinary proportions of iAs, MMAs and/or DMAs.
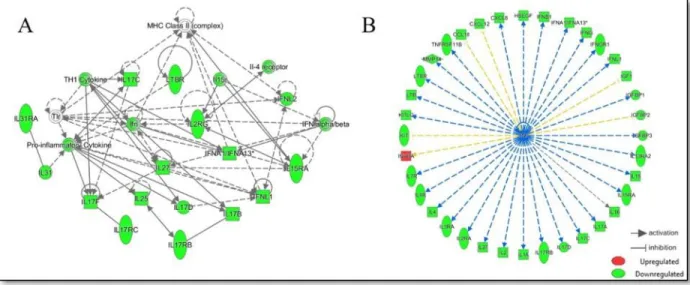
The 58 proteins identified as being significantly associated with U-tAs were analyzed for functional interactions (Appendix 2). Canonical pathway analysis revealed a strong enrichment of cytokine-mediated communication between immune cells (p= 1.12 x 10⁻²), comprised largely of a family of interleukins, including Interferon, Alpha 13 (IFNA1/IFNA13) and Chemokine (C-X-C Motif) Ligand 8 (CXCL8). Network analysis revealed a protein cluster involved in cellular development, cellular growth and proliferation (p= 1 x 10-34), which interacts with the major
Figure 3. Interacting network of U-tAs associated serum proteins and upstream regulation by TNF. Interacting network of U-tAs-associated serum proteins are identified (A). TNF is
predicted to regulate the expression of the majority (n=36, 62%) of the U-tAs associated proteins (B). Proteins are displayed as predicted to be upregulated (red) or downregulated (green).
A similar approach was used to investigate the pathways that were enriched among the proteins associated with the arsenical proportions. In relation to %iAs, canonical pathway analysis revealed several proteins involved in immune surveillance (p= 2.90 x 10⁻⁴), and include Platelet-Derived Growth Factor C (PDGFC) and Platelet-Derived Growth Factor D (PDGFD). Network analysis revealed a cellular growth and proliferation component (p=1.00 x 10⁻²⁴), mediated by ERK 1/2 kinase and containing several members of the PDGF family, which are responsible for cellular proliferation and differentiation.
organismal and cardiovascular system development and connective tissue disorders (p= 1 x 10-47), modulated by ERK 1/2 and NFkB.
In relation to %DMAs, proteins involved in immune surveillance, specifically
macropinocytosis signaling (p= 3.36x10⁻⁸), were altered and include Platelet Derived Growth Factor B (PDGFB), PDGFC, and PDGFD. Network analysis reveals cellular growth and proliferation (p= 1 x 10-33), and includes many members of the PDGF family modulated by NFkB. Additionally, DAVID was used to confirm all pathway analyses and showed Cytokine-cytokine receptor interaction as the common top KEGG pathway for U-tAs (p=3.76 x 10⁻²¹), %iAs (p=0.015), %MMAs (p= 6.80 x 10-09), and %DMAs (p=0.015).
Transcription factor regulation of arsenic-associated proteins
Analysis was performed for all arsenic-associated protein lists in order to identify key upstream regulators, including cell signaling molecules and transcription factors (Appendix 2). Tumor necrosis factor (TNF) was found to be the top regulator of the U-tAs-associated proteins (p=1.59 x 10⁻²⁷), and was predicted to be inhibited in relation to U-tAs. For the individual arsenicals, Dual Specificity Phosphatase 5 (DUSP5) was the top regulator of the %iAs-associated proteins (p=1.98 x 10⁻⁵), pyruvic acid was the top regulator of the
%MMAs-associated proteins (p=1.98 x 10⁻¹⁰), and for %DMAs-associated proteins, Fibroblast Growth Factor 2 (Basic) (FGF2) (p= 1.47 x 10⁻⁵) was the most significant regulator. Because of the small number of proteins in each arsenical-associated list, predicted effects (i.e., activation or
CHAPTER 4: DISCUSSION
We demonstrate a massive repression of immune-associated cytokines as U-tAs levels increase. Interestingly, TNF was identified as a key regulator of these repressed proteins. TNF has a known roll in immune response, apoptosis, inflammation, and cell migration, as well as having been implicated in numerous diseases (Naujokas, Anderson et al. 2013). Our prior research highlight TNF as a regulator of the newborn proteome (Bailey) as well as the newborn transcriptome (Fry, Navasumrit et al. 2007). Here we show that many of the identified
suppressed proteins are involved in the major histocompatibility (MCH) complex II, which is responsible for triggering localized inflammation and B cell activation in the adaptive immune response (Andrew, Jewell et al. 2008), and included many interleukins and interferons. These data highlight altered expression of cytokines known to play a role in adaptive and innate immune signaling and could provide a mechanistic hypothesis for increased risk of infection (Farzan, Li et al. 2016).
disease (Guha Mazumder 2005, Straub, Stolz et al. 2007, Coulon, Heindryckx et al. 2011, Ghatak, Biswas et al. 2011, Naujokas, Anderson et al. 2013, Mohammed Abdul, Jayasinghe et al. 2015). In addition to the TNFSF, members of the VEGF family also displayed a positive association with %MMAs. The VEGF family is a known regulator of angiogenesis (Detoraki, Staiano et al. 2009). VEGFB has been shown to play a role in cancer metastasis and tumor invasion (Yang, Zhang et al. 2015) and VEGFB expression has been found to be upregulated in ovarian, colorectal, renal, and prostate cancer (Gunningham, Currie et al. 2001, Hanrahan, Currie et al. 2003). VEGFC also plays a role in metastatic spread of certain tumor types (Gunningham, Currie et al. 2001). These data highlight differences in the expression of proteins with known association to arsenic-associated diseases.
While we have identified a large TNF-mediated response in relation to U-tAs with metabolite-specific differences, the study is not without its limitations. Despite being one of the largest proteomic studies to date, we have only assessed a fraction of the thousands of circulating serum proteins and due to the small sample size in the present study, associations seen should be confirmed in a larger cohort. Additionally, it possible that other environmental exposures and/or potential confounding variables not assessed in the present study may contribute to the observed differences. Moreover, while proteins identified have known associations with arsenic-related adverse outcomes it is unknown if the current cohort will present with such diseases. Future studies could examine both genomic and epigenetic mechanisms that may underlie the observed functional differences in protein expression (Bailey, Smith et al. 2016).
In summary, the data from the present study suggest that iAs acts as an
18
APPENDIX 1: SUPPLEMENTARY TABLE 1
Supplementary Table 1. Identification of proteins associated with total urinary arsenic (U-tAs) and proportions of arsenic metabolites (%iAs, %MMAs, %DMAs). Bold denotes statistical significance.
Protein
Symbol Protein Name Genbank ID
U-tAs p-val U-tAs q-val U-tAs Beta %iAs p-val %iAs Beta %MMA p-val %MMA Beta %DMA p-val %DMA Beta ACVR1 Activin A
receptor type 1 NM_001105.4 0.0097 0.0883 0.4032 0.9293 -0.0146 0.7729 -0.0473 0.8996 0.0207 CCL18
Chemokine (C-C
Motif) Ligand 18 NM_002988 0.0131 0.0902 -0.4097 0.9918 0.0018 0.5778 0.0961 0.9300 -0.0152
CXCL12
Chemokine (C-X-C Motif)
Ligand 12 NM_000609 0.0198 0.0909 -0.3834 0.6177 0.0855 0.0986 0.2775 0.4769 -0.1215
EDA2R
X-linked
ectodysplasin-A2
receptor NM_021783 0.7142 0.4957 0.0639 0.3523 0.1614 0.0133 0.4127 0.2153 -0.2139
FLT4
Fms-Related Tyrosine Kinase
4 NP_002011.2 0.9024 0.5469 -0.0214 0.5218 -0.1115 0.0296 0.3665 0.7461 0.0565 GPC3 Glypican 3 NM_00484 0.0218 0.0918 -0.3752 0.6067 0.0875 0.5085 -0.1122 0.6854 -0.0689
GPNMB
Glycoprotein (Transmembrane)
Nmb NM_001005340.1 0.0196 0.0909 -0.3854 0.6265 -0.0836 0.9730 -0.0058 0.6345 0.0817
HBEGF
Heparin-binding Epidermal
Growth factor NM_001945 0.0241 0.0947 -0.3635 0.4124 0.1366 0.8680 -0.0278 0.4419 -0.1282
HGFR
Hepatocyte growth factor
19
IFNAR1
Interferon alpha /
beta receptor 1 NM_000629.2 0.0168 0.0909 -0.3982 0.9882 -0.0026 0.4492 -0.1311 0.9046 0.0209
IFNAR2
Interferon alpha /
beta receptor 2 NM_000874 0.0068 0.0850 -0.4474 0.7065 0.0658 0.3869 -0.1504 0.8077 -0.0425 IFNB1 Interferon beta 1 NP_002167.1 0.0087 0.0883 -0.4324 0.9817 -0.0040 0.1934 -0.2229 0.8398 0.0351 IFNG Interferon gamma NM_000619 0.0064 0.0850 -0.4452 0.9154 0.0183 0.1571 -0.2405 0.9263 0.0160 IFNGR1
Interferon gamma
receptor 1 NM_000416 0.0040 0.0645 -0.4653 0.7794 0.0481 0.2235 -0.2070 0.9187 -0.0175
IGFBP1
Insulin-like growth factor binding proteins
1 NM_001013029 0.0020 0.0645 -0.4916 0.6951 0.0670 0.3847 -0.1479 0.7967 -0.0441
IGFBP2
Insulin-like growth factor binding proteins
2 NM_000597 0.0199 0.0909 -0.3659 0.6689 0.0699 0.6864 -0.0660 0.7212 -0.0584
IGFBP3
Insulin-like growth factor binding proteins
3 NM_001013398 0.0018 0.0645 -0.4895 0.5559 0.0990 0.8346 -0.0352 0.5892 -0.0908
IGFBP7
Insulin-Like Growth Factor
Binding Protein 7 NM_001253835.1 0.0028 0.0645 -0.4450 0.5445 0.0963 0.6734 0.0671 0.5186 -0.1026
IGFI
Insulin-Like Growth Factor 1
(Somatomedin C) NM_000618 0.0036 0.0645 -0.4616 0.3632 0.1527 0.8279 0.0367 0.3628 -0.1529 IL11 Interleukin 11 NM_000641 0.2372 0.2655 -0.2002 0.0429 0.3359 0.4338 0.1334 0.0381 -0.3436 IL13RA2
Interleukin 13
receptor alpha 2 NM_000640 0.0246 0.0947 -0.3772 0.7466 -0.0563 0.3317 -0.1681 0.6542 0.0780 IL15 Interleukin 15 NM_000585 0.0171 0.0909 -0.3984 0.7216 -0.0621 0.2347 -0.2051 0.6100 0.0888 IL15RA
Interleukin 15
20
IL17B Interleukin 17B NM_014443 0.0095 0.0883 -0.4179 0.8588 -0.0302 0.3705 -0.1510 0.7665 0.0504 IL17C Interleukin 17C NM_013278 0.0142 0.0902 -0.3816 0.9853 0.0030 0.6759 -0.0680 0.9675 0.0066 IL17D Interleukin 17D NM_138284 0.0032 0.0645 -0.4502 0.8869 0.0232 0.6395 -0.0762 0.9426 -0.0117 IL17F Interleukin 17F NM_052872 0.0028 0.0645 -0.4634 0.7662 0.0493 0.6039 -0.0858 0.8298 -0.0356 IL17RB
Interleukin 17B
receptor NM_172234 0.0033 0.0645 -0.4609 0.9577 0.0089 0.5335 -0.1040 0.9715 0.0060 IL17RC
Interleukin 17
receptor C NM_032732 0.0157 0.0909 -0.3864 0.5031 0.1116 0.6901 -0.0666 0.5544 -0.0986 IL1A
Interleukin-1
alpha NM_000575 0.0209 0.0909 -0.3806 0.2374 0.2006 0.8954 0.0226 0.2456 -0.1972 IL2 Interleukin 2 NM_000586 0.0105 0.0883 -0.4252 0.9783 -0.0047 0.3439 -0.1642 0.8745 0.0276 IL25 Interleukin 17E NM_172314 0.0022 0.0645 -0.4785 0.6599 0.0736 0.7495 -0.0535 0.7034 -0.0637 IL27
Interleukin-27
subunit alpha NM_145659 0.0212 0.0909 -0.3812 0.9133 -0.0187 0.3031 -0.1759 0.8038 0.0428 IL28A Interleukin-28A NM_172138 0.0145 0.0902 -0.3959 0.6518 -0.0764 0.3054 -0.1723 0.5621 0.0980 IL29 Interleukin-29 NM_172140 0.0133 0.0902 -0.4072 0.5031 -0.1150 0.7844 -0.0471 0.4926 0.1179 IL2RA
Interleukin 2 Rec
eptor, Alpha NM_000417.2 0.0075 0.0850 -0.4442 0.7537 -0.0550 0.2263 -0.2097 0.6371 0.0826 IL2RB
Interleukin 2
Receptor, Beta NM_000878 0.0073 0.0850 -0.4419 0.8717 0.0281 0.2472 -0.1993 0.9966 0.0007
IL2RG
Interleukin 2 Receptor,
Gamma NM_000206 0.0062 0.0850 -0.4475 0.8349 0.0361 0.3396 -0.1642 0.9453 -0.0119 IL31 Interleukin-31 NM_001014336 0.0102 0.0883 -0.4048 0.7376 0.0555 0.5097 -0.1089 0.8167 -0.0384 IL31RA
Interleukin-31
Receptor A NM_139017 0.0138 0.0902 -0.3886 0.6953 0.0647 0.5173 -0.1067 0.7733 -0.0476
IL3RA
Interleukin-3 receptor subunit
alpha NM_002183 0.0014 0.0645 -0.5067 0.6848 0.0696 0.4518 -0.1286 0.7739 -0.0493 IL4 Interleukin 4 NM_172348 0.0009 0.0645 -0.5211 0.6534 0.0764 0.6015 -0.0889 0.7181 -0.0615
IL4R
Interleukin-4 receptor alpha
21
IL7R
Interleukin-7 receptor subunit
alpha NP_002176.2 0.0040 0.0645 -0.4547 0.4267 0.1329 0.9951 -0.0010 0.4427 -0.1284 IL8 Interleukin 8 NM_000584 0.0183 0.0909 -0.3819 0.4580 0.1248 0.9545 -0.0096 0.4780 -0.1194 INHBA Inhibin, Beta A NM_002192.2 0.0263 0.0998 0.3398 0.3749 0.1401 0.8732 0.0253 0.3785 -0.1390 INHBB Inhibin, Beta B NP_002184.2 0.0066 0.0850 -0.4295 0.7378 0.0559 0.7646 -0.0500 0.7782 -0.0470
KIT
V-Kit Hardy-Zuckerman 4 Feline Sarcoma Viral Oncogene
Homolog NP_000213.1 0.0196 0.0909 -0.3818 0.7820 0.0472 0.2073 0.2124 0.6580 -0.0754 LCN1 Lipocalin-1 NM_002297 0.0228 0.0927 -0.3763 0.3310 -0.1660 0.2535 -0.1944 0.2704 0.1878
LRP1
Prolow-density lipoprotein receptor-related
protein 1 NM_002332 0.0147 0.0902 -0.3986 0.7725 -0.0494 0.2185 -0.2079 0.6523 0.0769
LTB
Lymphotoxin beta (TNFR Superfamily,
Member 3) NM_009588 0.0186 0.0909 -0.3706 0.8988 -0.0209 0.5577 -0.0960 0.8375 0.0337
LTBR
Lymphotoxin beta receptor (TNFR Superfamily,
Member 3) NM_002342 0.0143 0.0902 -0.3906 0.9040 0.0201 0.7164 -0.0605 0.9476 -0.0110
MMP11
Matrix
Metallopeptidase
11 NM_005940 0.0226 0.0927 -0.3717 0.5729 -0.0954 0.3424 -0.1599 0.4974 0.1147
MMP14
Matrix
Metallopeptidase 14
(Membrane-Inserted) NM_004995 0.0122 0.0902 -0.4027 0.9006 -0.0211 0.6989 -0.0651 0.8610 0.0295
MMP-15
Matrix
metalloproteinase
22
NRCAM
Neuronal cell adhesion
molecule NP_001032209.1 0.0243 0.0947 -0.3800 0.1244 -0.2645 0.8318 -0.0372 0.1296 0.2611
NRG3
Pro-neuregulin-3, membrane-bound
isoform XM_166086 0.5694 0.4402 -0.0991 0.0482 -0.3347 0.2681 -0.1915 0.0380 0.3506 OSTN Osteocrin NM_198184 0.0095 0.0883 -0.4194 0.9473 -0.0112 0.7407 0.0562 0.9860 0.0030
PDGFB
Platelet-derived growth factor
subunit B NP_002599.1 0.1536 0.2066 -0.2443 0.0651 0.3126 0.2294 0.2067 0.0498 -0.3313
PDGFC
Platelet-derived
growth factor C NM_016205 0.1593 0.2092 -0.2418 0.0268 0.3719 0.1752 0.2331 0.0190 -0.3924
PDGFD
Platelet-derived
growth factor D NM_025208 0.3386 0.3247 -0.1652 0.0174 0.3963 0.1510 0.2458 0.0117 -0.4177
PPBP
Pro-Platelet Basic Protein
(Chemokine (C-X-C Motif)
Ligand 7) NM_002704 0.2816 0.2935 -0.1845 0.0329 0.3563 0.2831 0.1839 0.0261 -0.3704 SCF Stem Cell Factor NP_000890.1 0.0212 0.0909 -0.3769 0.8750 0.0268 0.2152 0.2086 0.7459 -0.0551
Siglec-9
Sialic acid-binding Ig-like
lectin 9 NP_055256.1 0.1715 0.2164 -0.2357 0.0669 0.3124 0.1077 0.2758 0.0445 -0.3408 SLC2A3
Glucose
transporter 3 NM_006931 0.0605 0.1285 -0.3073 0.8080 -0.0408 0.0498 -0.3204 0.6151 0.0844
SLPI
Secretory Leukocyte Peptidase
Inhibitor NM_003064 0.2497 0.2769 -0.1981 0.0177 0.3953 0.1585 0.2415 0.0121 -0.4161
TFPI
Tissue factor
pathway inhibitor NM_006287 0.7176 0.4957 0.0612 0.0302 -0.3543 0.6011 -0.0884 0.0298 0.3550 TGFBR2
TGF-beta
23
TGFBR3
TGF-beta
receptor type III NM_003243 0.3210 0.3173 -0.1724 0.5610 0.1015 0.0194 0.3926 0.3786 -0.1532
TGFR2
TGF-Beta Receptor
Type IIB NM_001024847 0.2066 0.2446 -0.2171 0.5181 0.1121 0.0202 0.3878 0.3463 -0.1628 THPO Thrombopoietin NM_000460 0.3252 0.3185 -0.1713 0.5330 0.1090 0.0253 0.3776 0.3635 -0.1584 TMPO Thymopoietin NP_003267.1 0.3603 0.3282 -0.1581 0.0404 0.3452 0.0859 0.2921 0.0251 -0.3748
TNFRSF 10A
Tumor necrosis factor receptor superfamily
member 10A NP_003835.2 0.7093 0.4957 -0.0649 0.7890 0.0466 0.0231 0.3809 0.5712 -0.0985
TNFRSF 10B
Tumor necrosis factor receptor superfamily
member 10B NP_003833.4 0.9646 0.5665 -0.0078 0.8296 0.0376 0.0375 0.3518 0.6234 -0.0857
TNFRSF 10C
Tumor Necrosis Factor Receptor Superfamily,
Member 10C NM_003841 0.7995 0.5176 -0.0445 0.4532 0.1309 0.0178 0.3980 0.2940 -0.1824
TNFRSF 10D
Tumor Necrosis Factor Receptor Superfamily,
Member 10D NM_003840 0.8624 0.5335 -0.0304 0.4184 0.1410 0.0099 0.4295 0.2570 -0.1966
TNFRSF 11B
Tumor Necrosis Factor Receptor Superfamily,
Member 11b NP_002537.3 0.0165 0.0909 -0.3860 0.9787 -0.0045 0.6172 0.0839 0.9648 -0.0074
TNFSF10
Tumor Necrosis Factor (Ligand) Superfamily,
Member 10 NP_003801.1 0.8216 0.5245 -0.0393 0.8321 0.0369 0.0280 0.3689 0.6151 -0.0874
TNFSF11
Tumor Necrosis Factor (Ligand) Superfamily,
24
TNFSF15
Tumor necrosis factor ligand superfamily
member 15 NM_005118 0.8792 0.5371 -0.0265 0.5502 0.1037 0.0143 0.4076 0.3628 -0.1574
TNFSF4
Tumor Necrosis Factor (Ligand) Superfamily,
Member 4 NM_003326 0.0113 0.0883 -0.4071 0.8525 0.0314 0.4328 0.1317 0.7723 -0.0488
VEGFB
Vascular endothelial
growth factor B NM_003377 0.7961 0.5169 -0.0450 0.9062 0.0205 0.0206 0.3873 0.6700 -0.0741
VEGFC
Vascular endothelial
growth factor C NM_005429 0.8025 0.5181 -0.0435 0.8381 0.0355 0.0146 0.4061 0.5991 -0.0913
VEGFD
Vascular endothelial
growth factor D NM_182925.4 0.9529 0.5644 -0.0103 0.7751 0.0498 0.0182 0.3946 0.5518 -0.1034
WISP1
WNT1-inducible-signaling
25
APPENDIX 2: SUPPLEMENTARY TABLE 2
Supplementary Table 2. Canonical IPA pathways (A.), canonical KEGG pathways (B.), Upstream regulators (C.), and IPA molecular networks (D.) of the As-and arsenical-associated proteins.
A. IPA pathways
Pathway Canonical pathway description p-value Associated proteins in pathway U-tAs Role of Cytokines in Mediating Communication
between Immune Cells
1.12E-02
CXCL8, IFNA1/IFNA13, IFNB1, IFNG, IFNL1, IL2, IL4, IL15, IL25, IL27, IL17A, IL17F, IL1A
%iAs Macropinocytosis Signaling 2.90E-04 PDGFD, PDGFC
%MMA Retinoic acid Mediated Apoptosis Signaling
1.09E-09
TNFRSF10A, TNFRSF10B,
TNFRSF10C, TNFRSF10D, TNFSF10
%DMA Macropinocytosis Signaling 3.36E-08 MET, PDGFB, PDGFC, PDGFD
B. KEGG pathways
Pathway Canonical pathway description p-value Associated proteins in pathway
U-tAs Cytokine-cytokine receptor interaction 3.76E-21
CXCL12, CXCL8, ACVR1, IFNGR1, IFNG, IL1A, IL15RA, IL15, IL17RB, IL17A, IL2RB, IL2RG, IL2, IL25, IL3RA, IL4R, IL4, LTBR, LTB, TNFSF4
%iAs Cytokine-cytokine receptor interaction 1.50E-02 IL11, PDGFC, CXCL7 %MMA Cytokine-cytokine receptor interaction 6.80E-09
FIGF, EDA2R, TGFBR2, TNFSF11, TNFSRF10C, TNFSRF1D, VEGFB, VEGFC
26
C. Upstream regulators
Pathway Canonical pathway description p-value Predicted Activation
U-tAs TNF 1.59E-27 Inhibited
%iAs DUSP5 1.98E-05 no prediction
%MMA Pyruvic acid 1.98E-10 no prediction
%DMA FGF2 1.47E-05 no prediction
D. IPA networks
Network Most significant associated
functions p-value
Number of associated proteins in
network
Molecules in network
U-tAs
Cellular Development, Cellular Growth and
Proliferation, Hematological System Development and Function
1.00E-34 16
Eotaxin, ERK1/2, Fibrin, HDL, Ifn, IFN alpha/beta, IFNA1/IFNA13, IFNL1,
IFNL2, Iga, IL23, IL25, IL27, IL31, Il-4 receptor, Il15r, IL15RA, IL17B,
IL17C, IL17D, IL17F, IL17RB,
IL17RC, IL2RG, IL31RA,
INTERLEUKIN, LTBR, MHC Class II (complex), MHC II, Notch, Oas,
Pro-inflammatory Cytokine, SAA, TH1 Cytokine, Tlr
%iAs
Cardiovascular Disease, Hematological Disease, Cellular Growth and Proliferation
1.00E-24 8
27
%MMA
Organismal Development, Cardiovascular System Development and Function, Connective Tissue Disorders
1.00E-47 16
caspase, Collagen(s), death receptor, DR4/5, ERK1/2, FIGF, FLT4, Focal adhesion kinase, FSH, growth factor receptor, Growth hormone, IL1, Immunoglobulin, Mapk, p70 S6k, Pro-inflammatory Cytokine, SLC2A3, Tgf beta, TGFBR, TGFBR2, TGFBR3,
THPO, Tnf (family), TNFRSF10A,
TNFRSF10B, TNFRSF10C,
TNFRSF10D, TNFSF10, TNFSF11,
TNFSF15, Trail-R, Vegf, VEGFB,
VEGFC, WISP1
%DMA
Cellular Growth and Proliferation, Organismal Development, Cancer
1.00E-33 11
Akt, Ap1, Collagen(s), ERK, ERK1/2, GP130 dimer, Histone h3, IL11, Jnk, Mapk, MET, Met dimer, NFkB (complex), NRG3, P38 MAPK, p85 (pik3r), Pdgf (complex), PDGF (family), PDGF-CC, PDGF-DD, PDGFB,
PDGFC, PDGFD, PI3K (complex),
REFERENCES
Ahmed, S., S. E. Moore, M. Kippler, R. Gardner, M. D. H. Hawlader, Y. Wagatsuma, R. Raqib and M. Vahter (2014). "Arsenic Exposure and Cell-Mediated Immunity in Pre-School Children in Rural Bangladesh." Toxicological Sciences 141(1): 166-175.
Andrew, A. S., D. A. Jewell, R. A. Mason, M. L. Whitfield, J. H. Moore and M. R. Karagas (2008). "Drinking-Water Arsenic Exposure Modulates Gene Expression in Human Lymphocytes from a U.S. Population." Environmental Health Perspectives 116(4): 524-531.
Bailey, K. A., J. Laine, J. E. Rager, E. Sebastian, A. Olshan, L. Smeester, Z. Drobna, M. Styblo, M. Rubio-Andrade, G. Garcia-Vargas and R. C. Fry (2014). "Prenatal arsenic exposure and shifts in the newborn proteome: interindividual differences in tumor necrosis factor (TNF)-responsive signaling." Toxicol Sci 139(2): 328-337.
Bailey, K. A., A. H. Smith, E. J. Tokar, J. H. Graziano, K. W. Kim, P. Navasumrit, M.
Ruchirawat, A. Thiantanawat, W. A. Suk and R. C. Fry (2016). "Mechanisms Underlying Latent Disease Risk Associated with Early-Life Arsenic Exposure: Current Research Trends and Scientific Gaps." Environ Health Perspect 124(2): 170-175.
Coulon, S., F. Heindryckx, A. Geerts, C. Van Steenkiste, I. Colle and H. Van Vlierberghe (2011). "Angiogenesis in chronic liver disease and its complications." Liver International 31(2): 146-162.
Dangleben, N. L., C. F. Skibola and M. T. Smith (2013). "Arsenic immunotoxicity: a review." Environ Health 12(1): 73.
Detoraki, A., R. I. Staiano, F. Granata, G. Giannattasio, N. Prevete, A. de Paulis, D. Ribatti, A. Genovese, M. Triggiani and G. Marone (2009). "Vascular endothelial growth factors synthesized by human lung mast cells exert angiogenic effects." J Allergy Clin Immunol 123(5): 1142-1149, 1149 e1141-1145.
Farzan, S. F., Z. Li, S. A. Korrick, D. Spiegelman, R. Enelow, K. Nadeau, E. Baker and M. R. Karagas (2016). "Infant Infections and Respiratory Symptoms in Relation to in Utero Arsenic Exposure in a U.S. Cohort." Environ Health Perspect 124(6): 840-847.
Fry, R. C., P. Navasumrit, C. Valiathan, J. P. Svensson, B. J. Hogan, M. Luo, S. Bhattacharya, K. Kandjanapa, S. Soontararuks, S. Nookabkaew, C. Mahidol, M. Ruchirawat and L. D. Samson (2007). "Activation of Inflammation/NF-κB Signaling in Infants Born to Arsenic-Exposed Mothers." PLoS Genet 3(11): e207.
Ghatak, S., A. Biswas, G. K. Dhali, A. Chowdhury, J. L. Boyer and A. Santra (2011). "Oxidative stress and hepatic stellate cell activation are key events in arsenic induced liver fibrosis in mice." Toxicology and applied pharmacology 251(1): 59-69.
Gunningham, S. P., M. J. Currie, C. Han, K. Turner, P. A. Scott, B. A. Robinson, A. L. Harris and S. B. Fox (2001). "Vascular endothelial growth factor-B and vascular endothelial growth factor-C expression in renal cell carcinomas: regulation by the von Hippel-Lindau gene and hypoxia." Cancer Res 61(7): 3206-3211.
Hamadani, J., F. Tofail, B. Nermell, R. Gardner, S. Shiraji, M. Bottai, S. Arifeen, S. Huda and M. Vahter (2011). "Critical windows of exposure for arsenic-associated impairment of cognitive function in pre-school girls and boys: a population-based cohort study." International Journal of Epidemiology 40(6): 1593-1604.
Hanrahan, V., M. J. Currie, S. P. Gunningham, H. R. Morrin, P. A. Scott, B. A. Robinson and S. B. Fox (2003). "The angiogenic switch for vascular endothelial growth factor (VEGF)-A, VEGF-B, VEGF-C, and VEGF-D in the adenoma-carcinoma sequence during colorectal cancer
progression." J Pathol 200(2): 183-194.
Huang, Y.-K., C.-H. Tseng, Y.-L. Huang, M.-H. Yang, C.-J. Chen and Y.-M. Hsueh (2007). "Arsenic methylation capability and hypertension risk in subjects living in
arseniasis-hyperendemic areas in southwestern Taiwan." Toxicology and Applied Pharmacology 218(2): 135-142.
Laine, J. E., K. A. Bailey, M. Rubio-Andrade, A. F. Olshan, L. Smeester, Z. Drobná, A. H. Herring, M. Stýblo, G. G. García-Vargas and R. C. Fry (2015). "Maternal Arsenic Exposure, Arsenic Methylation Efficiency, and Birth Outcomes in the Biomarkers of Exposure to ARsenic (BEAR) Pregnancy Cohort in Mexico." Environmental Health Perspectives 123(2): 186-192. Luna, A. L., L. C. Acosta-Saavedra, L. Lopez-Carrillo, P. Conde, E. Vera, A. De Vizcaya-Ruiz, M. Bastida, M. E. Cebrian and E. S. Calderon-Aranda (2010). "Arsenic alters monocyte
superoxide anion and nitric oxide production in environmentally exposed children." Toxicol Appl Pharmacol 245(2): 244-251.
Mandal, B. K. and K. T. Suzuki (2002). "Arsenic round the world: a review." Talanta 58(1): 201-235.
Mohammed Abdul, K. S., S. S. Jayasinghe, E. P. S. Chandana, C. Jayasumana and P. M. C. S. De Silva (2015). "Arsenic and human health effects: A review." Environmental Toxicology and Pharmacology 40(3): 828-846.
Naujokas, M. F., B. Anderson, H. Ahsan, H. V. Aposhian, J. Graziano, C. Thompson and W. A. Suk (2013). "The broad scope of health effects from chronic arsenic exposure: update on a worldwide public health problem." Environmental health perspectives 121(3): 295-302. Olivas-Calderon, E., R. Recio-Vega, A. J. Gandolfi, R. C. Lantz, T. Gonzalez-Cortes, C. Gonzalez-De Alba, J. R. Froines and J. A. Espinosa-Fematt (2015). "Lung inflammation biomarkers and lung function in children chronically exposed to arsenic." Toxicol Appl Pharmacol 287(2): 161-167.
and superoxide anion production in monocytes from children exposed to arsenic and lead in region Lagunera, Mexico." Toxicology and Applied Pharmacology 198(3): 283-290.
Rager, J. E., K. A. Bailey, L. Smeester, S. K. Miller, J. S. Parker, J. E. Laine, Z. Drobna, J. Currier, C. Douillet, A. F. Olshan, M. Rubio-Andrade, M. Styblo, G. Garcia-Vargas and R. C. Fry (2014). "Prenatal arsenic exposure and the epigenome: altered microRNAs associated with innate and adaptive immune signaling in newborn cord blood." Environ Mol Mutagen 55(3): 196-208.
Rahman, M., N. Sohel, M. Yunus, M. E. Chowdhury, S. K. Hore, K. Zaman, A. Bhuiya and P. K. Streatfield (2013). "Increased Childhood Mortality and Arsenic in Drinking Water in Matlab, Bangladesh: A Population-Based Cohort Study." PLoS ONE 8(1): e55014.
Recio-Vega, R., T. Gonzalez-Cortes, E. Olivas-Calderon, R. C. Lantz, A. J. Gandolfi and C. Gonzalez-De Alba (2014). "In utero and early childhood exposure to arsenic decreases lung function in children." J Appl Toxicol 35(4): 358-366.
Smith, A. H., G. Marshall, J. Liaw, Y. Yuan, C. Ferreccio and C. Steinmaus (2012). "Mortality in young adults following in utero and childhood exposure to arsenic in drinking water." Environ Health Perspect 120(11): 1527-1531.
Soto-Peña, G. A., A. L. Luna, L. Acosta-Saavedra, P. Conde, L. López-Carrillo, M. E. Cebrián, M. Bastida, E. S. Calderón-Aranda and L. Vega (2006). "Assessment of lymphocyte
subpopulations and cytokine secretion in children exposed to arsenic." The FASEB Journal 20(6): 779-781.
Straub, A. C., D. B. Stolz, H. Vin, M. A. Ross, N. V. Soucy, L. R. Klei and A. Barchowsky (2007). "Low level arsenic promotes progressive inflammatory angiogenesis and liver blood vessel remodeling in mice." Toxicol Appl Pharmacol 222(3): 327-336.
Tseng, C.-H. (2007). "Arsenic Methylation, Urinary Arsenic Metabolites and Human Diseases: Current Perspective." Journal of Environmental Science and Health, Part C 25(1): 1-22.
Vahter, M. (2008). "Health Effects of Early Life Exposure to Arsenic." Basic & Clinical Pharmacology & Toxicology 102(2): 204-211.
WHO (2011). Guidelines for drinking-water quality, WHO Press. 1.