EFFECT OF CHINESE DEVELOPMENT ASSISTANCE ON COMPLIANCE WITH WESTERN AID CONDITIONALITY
James Mitchell Watkins
A thesis submitted to the faculty at the University of North Carolina at Chapel Hill in partial fulfillment of the requirements for the degree of Master of Arts in the Department
of Political Science.
Chapel Hill 2016
Approved by: Layna Mosley Lucy Martin
c
2016
ABSTRACT
James Mitchell Watkins: Effect of Chinese Development Assistance on Compliance with Western Aid Conditionality
(Under the direction of Layna Mosley)
TABLE OF CONTENTS
LIST OF TABLES . . . vi
LIST OF FIGURES . . . vii
LIST OF ABBREVIATIONS . . . viii
INTRODUCTION . . . 1
Determinants of Compliance with Conditionality . . . 3
Chinese Development Assistance. . . 5
Illustrative Cases . . . 8
Modeling Foreign Aid with Multiple Donor Types . . . 9
Infinitely Repeated Simultaneous Aid Game . . . 12
Data . . . 16
World Bank Conditionality Compliance . . . 16
Foreign Aid Data . . . 18
Control Variables . . . 19
Empirical Strategy . . . 22
Results . . . 23
Robustness Checks . . . 26
TABLES . . . 30
FIGURES . . . 34
APPENDIX A: DATA SOURCES AND DESCRIPTION . . . 36
APPENDIX B: ROBUSTNESS CHECKS . . . 37
LIST OF TABLES
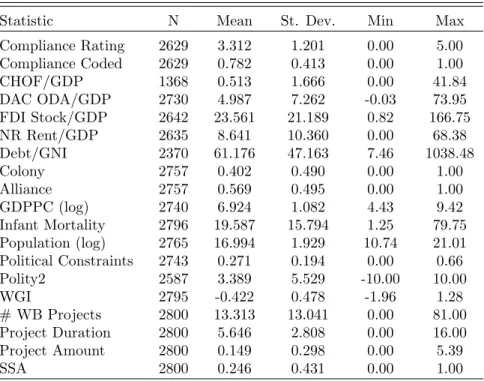
1 Descriptive Statistics . . . 30
2 Mixed Effects Regression Results . . . 31
3 Average Marginal Effects from Model 2 . . . 32
4 Country-level Regression Results . . . 33
5 Mixed Effects Regression Results- Project Sector Controls . . . 37
6 Mixed Effects Regression Results- SSA Sample Restriction . . . 38
7 Country-level Regression Results- SSA Sample Restriction . . . 39
8 Mixed Effects Regression Results- Disaggregated Chinese Official Finance . . . 40
LIST OF FIGURES
LIST ABBREVIATIONS
DAC Development Assistance Committee IMF International Monetary Fund ODA Official Development Assistance
OECD Organization for Cooperation and Development OF Official Finance
INTRODUCTION
The international development finance landscape is undergoing significant changes to its power structure. Emerging donors, including China, UAE, Saudi Arabia, India, and Brazil, are providing alternative sources of development assistance and beginning to challenge the existing international development regime (Woods 2008). Emerging donors are not members of the OECD Development Assistance Committee (DAC), an international forum comprised of 29 Western donor countries, the World Bank, International Monetary Fund (IMF), and United Nations Development Program (UNDP) (OECD 2002).1 The DAC and its devel-opment guidelines represent the established Western view on how develdevel-opment assistance should be delivered. Aid conditionality, government accountability, and multilateralism are central tenants of the existing DAC foreign aid regime.
China is by far the most prominent emerging donor and has become an important source of development assistance for developing countries. Chinese official finance (OF) for development purposes totaled over $450 billion (2009 USD) over the 2000-2012 period and has been concentrated in the infrastructure, energy, industrial, mining, and communications sectors (Strange et al. 2015, Brautigam 2009). Chinese development assistance is guided by the principles of mutual benefit and non-interference. In stark contrast with Western aid, Chinese development assistance often comes with few or no strings attached. China does not attach conditionality to its development assistance and has abstained from interfering in the domestic politics of recipient countries.
The rise of China as a significant source of development assistance has sparked a debate among scholars and development practitioners about its implications for economic develop-ment and governance in less-developed countries, particularly in Africa. Several scholars
have speculated that emerging donors might undermine the effectiveness of the Western aid regime and weaken the bargaining position of Western donors by offering alternative sources of funds (Woods 2008, Kjollesdal and Welle-Strand 2010, Li 2016). This study focuses on one particular mechanism through which Chinese assistance might undermine the Western aid regime: compliance with Western aid conditionality.
Aid conditionality is the attachment of policy conditions to the disbursement of aid. Aid conditionality is intended to induce policy reform and deter the misappropriation of aid by threatening to withdraw future transfers of aid if the recipient country fails to comply with the conditions of the aid agreement. Aid conditionality has been a standard tool used by international financial institutions (IFI) and the bilateral donors to improve aid effec-tiveness and address fungibility (Hernandez 2015). In the 1980s, the World Bank and IMF conditioned their loans and projects on economic policy reform under structural adjustment programs.2 In the post-Cold War period, the World Bank, IMF, and many Western bilateral donors have focused on the promotion of good governance and have increasingly attached governance and institutional conditions to disbursements of aid (World Bank 2005, Stone 2008). Examples of governance conditions attached to World Bank aid include increased transparency and implementation of anti-corruption strategies. Although aid conditionality is most often associated with the IFIs, all Western donors utilize conditionality to some extent (Radelet 2006). Western bilateral donors are more likely condition aid on democra-tization and human rights protection (Brautigam 2011). Western bilateral donors also often condition their aid on good standing in IFI programs.
Despite the extensive use of conditionality by Western donors, recipient country com-pliance with conditionality has been poor (Dollar and Svensson 2000, Ivanova et al. 2001, Easterly 2005). Compliance with aid conditionality depends on the donor’s credibility in en-forcing the conditions and the recipient’s incentives and capacity to pursue reforms (Wright
2After WWII, the IMF conditioned its loans on fiscal and current account deficits (Montinola 2010). However,
and Winters 2010, p. 72). To understand how Chinese development assistance impacts the incentives for compliance with Western aid conditionality in recipient countries, this study develops a formal model that incorporates Chinese development assistance into existing an aid-for-policy framework used to model aid conditionality (Bueno de Mesquita and Smith 2009, Bermeo 2016). The model is used in an infinitely-repeated simultaneous game to an-alyze the impact of Chinese development assistance on recipient country compliance with Western aid conditionality. The model predicts that Chinese development assistance has a negative impact on recipient country compliance with conditionality attached to Western aid. The model shows that Chinese development assistance limits the conditions, specifically the discount rate and reform cost, under which recipient countries are willing comply with Western aid conditionality. To test the implications of the formal model, the empirical anal-ysis focuses on the effect of Chinese development assistance on compliance with World Bank conditionality. Using the China AidData and World Bank IEG Project Assessment Rat-ings datasets, the study finds strong support for the hypothesis that Chinese development assistance has a negative effect on compliance with World Bank conditionality.
Determinants of Compliance with Conditionality
The literature on the determinants of compliance with aid conditionality has primarily fo-cused compliance with IFI conditionality. Specifically, the literature has aimed to explain why recipient country compliance with World Bank and IMF conditionality has been poor. Prominent explanations in the literature focus on the credibility of conditionality enforce-ment and domestic and structural factors that affect recipient incentives.
principle-agent arguments have also been developed in the context of the World Bank. Vreeland (2003) suggests that the poor record of IFI conditionality may be a result of poor enforcement. Given the bureaucratic interests of IFIs, the enforcement of conditionality is not a credible commitment, and aid recipients have no incentive to comply. An additional factor that impacts the enforcement of aid conditionality is the strategic importance of the aid recipient (Stone 2004, Kilby 2009, Dreher 2009). The literature suggests that donors are less likely to enforce conditions when the aid recipient is strategically important. If the enforcement of conditions is not a credible threat, aid recipients with strategic importance have no incentive to comply and implement policy reform.3
A separate branch of the literature has focused on recipient country incentives for com-pliance. Scholars have found that poor compliance may be attributed to domestic political factors and structural impediments in recipient countries such as regime type (Joyce 2006, Montinola 2010, Bearce 2009) and significant interests groups and veto players (Ianova et al. 2001, Drazen 2002, Mayer and Mourmouras 2002).4 Recent research by Girod and To-bin (2016) argues that revenue maximization of major sources of income can also explain recipient country compliance with conditionality. Citing Bueno de Mesquita (2005), Girod and Tobin (2016) argue that the primary reason that governments implement new policies is to increase government revenue, which improves to the likelihood of political survival. The authors stress the importance of understanding how a recipient government’s desire to maximize revenue impacts its incentives to comply with conditionality. Girod and Tobin
3Stone (2004) finds that IMF conditions are less likely to be enforced in recipient countries with ties to the
United States, Britain, and France. Additionally, Stone (2004) shows that the length of punishment for noncompliance with IMF conditions is significantly weaker for countries that are strategically important to the United States. Similarly, Kilby (2009) finds that recipient country alignment with the United States has a negative effect on the enforcement of World Bank conditionaility.
4Joyce (2006) finds that democracies are more likely to comply with IMF conditions than autocracies. Joyce
find evidence that FDI has a positive impact on compliance with World Bank conditionality, because governments expect compliance to maintain or increase their revenue from FDI in the future. In contrast, the authors find evidence that natural resource rents have a negative effect on compliance, because compliance with reforms will have a negative impact on the revenue source.
This study aims to contribute to the literature on aid conditionality compliance by demonstrating that Chinese development assistance is an additional source of income for developing countries that alters their incentives to comply with Western aid conditionality. Section 3 outlines China’s development assistance program and how it differs from West-ern aid, and Section 4 develops a formal model to analyze impact of Chinese development assistance on conditionality compliance.
Chinese Development Assistance
Following nearly 20 years of limited engagement in the area of international development, China revitalized its development assistance program in 2000 and quickly established itself as one of the largest bilateral donors by the end of the decade. Figure 1 depicts the rapid growth of Chinese development assistance since 2000, and Figure 2 reports the regional dis-tribution of Chinese assistance. The composition of Chinese development assistance differs dramatically from the composition of Western aid. Chinese assistance prioritizes infrastruc-ture, energy generation and supply, industrial and mining activities, and communications, whereas Western aid prioritizes debt relief, humanitarian and emergency relief, health, in-frastructure, and general budget support (Strange et al. 2015, Brautigam 2009). Chinese development assistance is financed through three forms: grants, interest-free loans, and con-cessional loans (PRC State Council 2011). China is not a member of the OECD DAC and does not follow the DAC classification of aid.5 A significant portion of Chinese
develop-5The DAC definition of ODA is as follows:“Grants or loans to developing countries and territories and to
ment assistance cannot be classified as Official Development Assistance (ODA) and instead comes in the form of Other Official Flows (OOF), a less concessional and more commercially-oriented form of finance that does not meet the DAC requirements for ODA (Dreher et al. 2015). OOF lacks a significant grant element or an explicit development purpose and can include export financing and other activities that promote the donor’s commercial interests (Strange et al. 2015). The allocation patterns of Chinese ODA and OOF vary substantially. Significant determinants of Chinese ODA include economic need, UN voting alignment, and recognition of Taiwan (Dreher et al. 2015). In contrast, the allocation of Chinese OOF is influenced by the presence of natural resources and level of trade with China, and high levels of corruption (Dreher et al. 2015).
Chinese aid is characterized by the principles of mutual respect of sovereignty and non-interference in internal affairs, equality and mutual benefit, and efficiency.6 First, Chinese
aid adheres to the principle of mutual respect of sovereignty and noninterference in inter-nal affairs. China is reluctant to intervene in the interinter-nal affairs of aid recipients or attach political or governance conditions to its aid. The principle of non-interference of Chinese aid fundamentally differs from Western donor’s use of economic, political, and governance conditionality. The only notable political condition that China places on development as-sistance is support for the One-China Policy, which prohibits recognition of Taiwan. The second principle of Chinese aid is equality and mutual benefit. Chinese aid is provided in support of development, but it also often provided in support of its own economic interests. Chinese aid is often associated with access to natural resources or access to new markets. China frequently provides development assistance in the form of concessional loans that are backed by commodities such as oil, metals, or minerals. Commodity-backed loans have
element of at least 25 per cent). Includes financial flows and technical co-operation.”(OECD 2002).
6China’s approach to aid was first outlined in “Eight Principles for Economic Aid and Technical Assistance
allowed countries with poor credit to gain access to credit without conditionality.7 China
also provides aid to finance industrial projects proposed by Chinese companies, primarily state-owned enterprises (SOEs). Lastly, Chinese aid has procurement requirements and is often highly tied to Chinese contractors. An additional feature of Chinese aid is efficiency. The Chinese negotiation and disbursement process is more efficient compared to Western aid, particularly aid from multilateral institutions. African countries have frequently raised concerns about the length of the negotiation and disbursement process for Western aid due to bureaucratic inefficiency (Li 2016, Woods 2008). Chinese aid is negotiated and allocated bilaterally and rarely allocated through multilateral delivery systems. China is able to ne-gotiate, disburse funds, and complete projects quickly due to the donor’s limited emphasis on environmental and social impact studies and the highly tied nature of the aid.
All three features make Chinese development assistance an attractive alternative to Western aid to developing countries. Almost every African country has received some form of development assistance from China in the last decade. Additionally, Chinese aid has become a notable competitor with World Bank projects due to its lack of conditionality and efficiency (Cheng et al. 2012). The guiding principles of Chinese development assistance demonstrate how China fundamentally differs from Western donors. China represents a different type of donor primarily defined by the principle of non-interference. The existence of multiple donor types with that offer aid with different levels of conditionality may have a significant impact on the effectiveness of Western conditionality. Specifically, the presence of a significant non-Western donor type could alter the incentives of recipient countries to comply with Western conditionality and as a result limit the conditions under which they comply.
Illustrative Cases
The cases of Angola and Zimbabwe are two illustrative cases of Chinese development as-sistance undermining Western aid conditionality. In 2004, Angola was involved in debt rescheduling negotiations with the Paris Club as well as in negotiations with the IMF for loans to fund post-war reconstruction efforts. Angola had a history of non-compliance with IMF programs in the 1990s and early 2000s, and the Paris Club demanded that Angola be in good standing in at least one IMF program as a condition for debt restructuring. The IMF program attached conditions of increased transparency of oil revenue as well as a limitations on short-term borrowing (Brautigam 2009). In 2004, China’s Export-Import Bank offered $2 billion worth of concessional oil-backed loans to Angola (Condon 2012).8 As a result, the Angolan government discontinued negotiations the IMF. The Chinese EXIM Bank subse-quently extended additional oil-back loans bringing the loan total to $10.5 billion in 2010 (Corkin 2011). After the Chinese EXIM bank loan was finalized, a group of European banks resumed large-scale lending to Angola using oil-back loans. Angola only recently resumed talks with the IMF after the collapse of commodity prices in 2015.
The case of Chinese engagement with Zimbabwe is a second notable example. The adoption of the land reform policy by the Zimbabwean government in 2000 drew intense criticism from the international community. US and European countries imposed sanctions on Zimbabwe for human rights violations and undermining the rule of law (Chun 2014). Zimbabwe was prohibited from obtaining assistance from both the IMF and the World Bank (Chun 2014). Rather than comply with Western conditionality and implement governance reforms, the Zimbabwean government turned to China for development assistance. Since 2000, Chinese aid has been a dominant source of development assistance for the country. Over the 2000-2015 period, Zimbabwe only received one World Bank project in 2010 (IEG). In the face of an economic recession, Zimbabwe resumed negotiations with the IMF in 2015
8The Chinese EXIM bank loans are classified as OOF. The rates were below market rates available to Angola
for the first time in over a decade.9 The availability of Chinese aid has allowed the Mugabe
government to disengage with the major Western multilateral donors and as a result avoid reforms in the area of governance.
Modeling Foreign Aid with Multiple Donor Types
Numerous formal models of foreign aid have modeled conditionality as a strategic interac-tion between a donor and recipient (Svensson 2000, Stone 2002, Morrison 2007, Bueno de Mesquita and Smith 2009, Bermeo 2016). With the exception of Stone (2002), no exist-ing model has considered multiple types of donors.10 Wright and Winters (2010) suggest
that models with two competing donor types with different conditions or different levels of enforcement could provide a valuable contribution to the literature on recipient country compliance with conditionality and policy reform. The model developed in this study incor-porates unconditional aid from China into the existing aid-for-policy model framework used by Bermeo (2016) and Bueno de Mesquita and Smith (2009). The aid-for-policy framework examines aid transfers from a potential donor to a recipient country in exchange for policy reform. Under an infinitely repeated and simultaneous aid-for-policy game, the model is used to investigate the impact of Chinese aid on the conditions under which cooperation is sustainable under a grim trigger strategy.
First, consider the following simultaneous stage game between a Western donor, D, and recipient government, X. The Western donor decides between the actions of allocating aid, A, to the recipient country and allocating no aid, NA. The recipient decides between the actions of implementing policy reform, R, and no reform, NR. The donor’s strategy set is defined as: sd= {A, NA}={1,0}. The recipient’s strategy set is defined as: sx= {R, NR}=
{1,0}.
When deciding to offer aid to a recipient country, the donor will compare its expected
9Zimbabwe reengaged with the IMF on a limited basis in 2013.
utility under an aid deal to its baseline utility. The donor’s utility in each period is defined as:
Ud =Sd(Rd−sxA) +sdω (1)
whereSdis the donor’s utility as function ofRd. Rdis the total amount of resources available
to the donor. Sd is assumed to be an increasing and concave function. Rd is assumed to be
exogenous and constant. A is the amount of Western aid allocated to the recipient country.
ωis the utility the donor receives from policy reform.11 Aandωare assumed to be exogenous and constant in each period. s1 is an indicator variable equal to 1 if the donor allocates aid.
sx is an indicator variable equal to 1 if the recipient implements policy reform. If the donor
offers aid to the recipient country (sd= 1), the resources and utility of the donor are reduced.
If recipient country implements policy reform (sx = 1), the donor receives additional utility
from reform.
For the donor to offer an aid deal, the increased utility from reform in the recipient country must at minimum offset the decreased utility resulting from the loss of resources. Thus, the following inequality is assumed:
Sd(Rd−A) +ω≥Sd(Rd) (2)
If this assumption does not hold, lending would never occur. The assumption states that the donor prefers to give aid if the recipient implements reforms but prefers to give no aid if the recipient does not reform. As Sd is strictly increasing, this assumption holds if sx = 1.
Under a cooperative equilibrium, the exchange of aid for policy reform is best outcome for the donor.
Turning to the recipient country, the recipient will compare its baseline utility to its
utility under an aid-for-policy deal. The recipient country’s utility is defined as:
Ux =Sx(Rt+C+sdA)−sxρ (3)
whereSxis the recipient country’s utility function of resources and Rx is the total amount of
domestic resources available to the recipient country. Sx is assumed to be an increasing and
concave function. Rx is assumed to be exogenous and constant in each period of the game.
C is the amount of Chinese aid the recipient country receives. ρis the cost of policy reform.
C and ρare assumed to be exogenous and constant. Again,sdis an indicator variable equal
to 1 if the donor allocates aid, and sx is an indicator variable equal to 1 if the recipient
implements policy reform.
result of negative social and environmental impacts of Chinese aid projects. Overall, Chinese aid does not explicitly condition its aid on policy reform, and any political costs imposed by Chinese aid are limited relative to the costs imposed by Western aid conditionality.
For recipient country compliance, the increased utility from Western aid must at mini-mum offset the decreased utility from the cost of policy reform. The recipient country will accept and comply with an aid deal if :
Sx(Rx+C+A)−ρ≥Sx(Rx+C) (4)
In a single stage game, the unique Nash equilibrium is no cooperation. The recipient will elect to implement no reform, because no reform strictly dominates reform. Therefore, the unique best response for the donor is no aid. Chinese aid does not factor into the outcome of the single shot game.
Infinitely Repeated Simultaneous Aid Game
Now consider an infinitely repeated version of the stage game from the previous section. Future payoffs are discounted by δd for the donor and δx for the recipient. As is the case
in many infinitely repeated games, this game may support multiple equilibria. This study examines the effect of Chinese aid on a cooperative subgame perfect equilibrium under a grim trigger strategy. The grim trigger strategy for each player is to cooperate initially and continue to cooperate if no player has ever defected. Cooperate translates into action A (Aid) for D and action R (Reform) for X. Defect translates into action NA (No Aid) for D and action NR (No Reform) for X.
ai =
1 if aj = (1,1)∀j < t or if t= 1
0 otherwise.
The donor’s present-discounted payoff payoffs under the cooperative strategy is equal to:
Sd(Rd−A) +ω
1−δd
(5)
For the cooperative strategy to be sustainable, the donor’s expected payoff from coop-eration must be greater than or equal to the expected future payoffs from a deviation to NA. The donor’s best deviation is to defect to NA and continue to play NA in the future. Under this deviation, the donor will receive utility from reform without providing aid to the recipient country. In any deviation from cooperation for either player, the future path of the game will be (NA,NR). For a cooperative strategy to be a subgame perfect equilibrium, the following equality must hold:
Sd(Rd−A) +ω
1−δd
≥ωt+
Sd(Rd)
1−δd
(6)
Solving for δd yields:
δd ≥1−
Sd(Rd−A) +ωt−Sd(Rd)
ω (7)
Turning to the recipient, the recipient’s expected payoffs under cooperation is equal to:
Sx(Rx+C+A)−ρ
1−δx
(8)
Sx(Rx+C+A)−ρ
1−δx
≥Sx(Rx+C+A) +
δxSx(Rx+C)
1−δx
(9)
Solving for δx yields:
δx ≥
ρ
Sx(Rx+C+A)−Sx(Rx+C)
(10)
For cooperation under a grim trigger strategy to be a subgame perfect equilibrium, no profitable deviation can exist for either player off path. Consider the previous history of
at−1 = (N A, N R). A deviation by the donor to action A decreases the donor’s expected
payoff by Sd(Rd)− Sd(Rd −A). A deviation by the recipient to action R decreases the
recipient’s expected payoff by ρ. After either deviation, the game continues on the path of (NA,NR). Therefore, once the game is off path of the cooperative strategy, neither player has a profitable deviation.
The comparative statics of equation (10) can provide insight into how Chinese aid affects recipient country compliance with conditionality. By assumption, S is concave S(x), and, therefore, ∂S∂x >0 and ∂∂22Sx <0. Taking the first derivative of equation (10) yields:
∂ ∂C :
ρ
Sx(Rx+C+A)−Sx(Rx+C)
= −ρ(S 0
x(Rx+C+A)−Sx0(Rx+C))
(Sx(Rx+C+A)−Sx(Rx+C))2
(11)
The numerator and denominator of the first order condition are both strictly positive.12
Therefore, ∂C∂ >0. As the amount of Chinese aid the recipient country receives increases,
δx increases. As δx increases, sustainable cooperation becomes less likely. As Chinese aid
increases, the range ofδfor which the recipient does not have a profitable deviation decreases. As a result, the number of scenarios under which cooperation is sustainable decreases.13
12−ρis strictly negative.
Sx0(Rx+C+A)−Sx0(Rx+C)<0. Sx0(Rx+C+A)> Sx0(Rx+C)∀A >0.
13This finding is consistent with the argument that as the domestic revenue of a recipient increases, the
The model can also provide usual insight on the effect of Chinese aid on the maximum cost of reform the recipient country is willing to pay in exchange for Western aid. Solving equation (9) for ρ yields:
ρ≤δx(Sx(Rx+C+A)−Sx(Rx+C)) (12)
∂
∂ρ <0. (13)
As the amount of Chinese aid the recipient receives increases, the maximum cost the recipient is willing to pay for Western aid deceases. This finding can also be observed from equation (10). Consider the numerator as the cost of Western aid and the denominator as the benefit from from Western aid. As the amount of Chinese aid increases, the benefit from Western aid shown in the denominator decreases. In order to hold δx constant, ρ must decrease.
Therefore, as the amount of Chinese aid increases, the cost of reform that the recipient is willing to accept decreases, holding the recipient’s discount rate constant.14
In summary, Chinese aid decreases the range of δx in which a cooperative equilibrium
strategy under a grim trigger strategy is a subgame perfect equilibrium. Additionally, Chi-nese aid decreases the maximum level of reform cost that a recipient country is willing to accept in exchange for Western aid. The presence of Chinese aid limits the conditions under which recipient countries are expected to comply with Western aid conditionality. Thus, the model generates the following hypothesis:
H1: Higher levels of Chinese development assistance in recipient countries decreases the
level of compliance with Western aid conditionality.
2016).
14This finding also suggests that increased competition from Chinese development could induce Western
Data
World Bank Conditionality Compliance
Although the formal model analyzes the effect of Chinese development assistance on com-pliance with Western aid conditionality in general and is applicable to Western bilateral and multilateral donors, the empirical analysis will focus on compliance with World Bank aid conditionality. The World Bank is the largest and most influential Western multilateral donor and is representative of the development goals of the major Western powers. The Independent Evaluations Group (IEG), a semi-autonomous branch of World Bank, conducts evaluations of all projects funded by the World Bank. The IEG has created a unique and comprehensive dataset of World Bank project performance that includes a measure of bor-rower compliance with aid agreements.
The IEG Project Performance Ratings dataset contains assessments of Borrower Perfor-mance for over 130 countries dating back to the 1970s. Borrower PerforPerfor-mance is defined as “the extent to which the borrower (including the government and implementing agency or agencies) ensured, quality of preparation and implementation, and complied with covenants and agreements, towards the achievement of development outcomes”(IEG 2015). Borrower Performance is created from the sub-measures of Government Performance and Implement-ing Agency Performance. This study utilizes Government Performance to measure recipient government compliance.15 Government Performance was evaluated based on the following
criteria: “(1) government ownership and commitment to achieving development objectives; (2) enabling environment, adequacy of beneficiary/stakeholder consultations and involve-ment; (3) readiness for implementation, implementation arrangements and capacity, and ap-pointment of key staff; (4) timely resolution of implementation issues; (5) fiduciary (financial management, governance, provision of counterpart funding, procurement, reimbursements, compliance with covenants); (6) adequacy of monitoring and evaluation arrangements;(7)
15Government Performance is referred to as IEG Borrower Compliance in previous versions of the IEG
relationships and coordination with donors/ partners/stakeholders; and (8) adequacy of transition arrangements for regular operation of supported activities after Loan/Credit clos-ing”(IEG 2015).
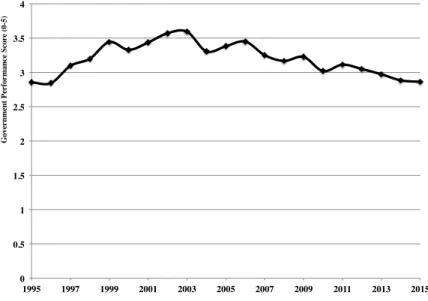
Data on Government Performance is available for over 2,600 of the 2,800 project agree-ments in the study period of 2000 to 2010. Government Performance is reported as highly unsatisfactory, unsatisfactory, moderately unsatisfactory, moderately satisfactory, satisfac-tory, or highly satisfactory. To create the primary dependent variable Compliance Scale, Government Performance is coded as 0 for highly unsatisfactory, 1 for unsatisfactory, 2 for moderately unsatisfactory, 3 for moderately satisfactory, 4 for satisfactory, and 5 for highly satisfactory. To address the issue that the classifications within satisfactory and unsatis-factory are not well delineated, a binary variable equal to 1 if Government Performance is satisfactory and 0 if unsatisfactory is calculated and utilized in addition to the ordinal scale (Girod and Tobin 2016). Figure 2 plots the trend in Government Performance ratings from 1995-2015 and depicts a downward trend in the compliance rating after 2003.
One potential concern with the Government Performance data is that the number and type of conditions attached to World Bank projects might vary substantially by country and region or across time. Girod and Tobin (2016), who also utilize the Government Perfor-mance rating from IEG dataset to measure conditionality compliance, analyzed the content of a random sample of 100 project agreements and found no evidence of bias in the con-ditions attached to agreements by country or region. Girod and Tobin (2016) found that the conditions attached to projects reflected the needs of the project sector and were similar across regions within each sector (p. 221). This potential concern is further addressed in the analysis of this study with control variables for strategic importance and sub-Saharan Africa and in the primary analysis and the use of country and year fixed effects in the secondary analysis.
that the World Bank attaches significantly fewer conditions on projects and loans to coun-tries that also receive aid from China. This finding from Hernandez (2015) should have a positive bias on the estimated effect of the Chinese development assistance on World Bank compliance. Fewer aid conditions should make the cost of compliance for recipients lower and have a positive effect on compliance.16 A final shortcoming of use of the IEG data
to measure the effect of Chinese developments assistance on compliance with World Bank conditionality is that the data fails to capture the extreme cases of disengagement with the World Bank such as in the cases of Angola and Zimbabwe described above. This shortcoming should also have a positive bias on the estimated effect of Chinese development assistance on World Bank compliance.
Foreign Aid Data
Data on Chinese OF commitments is collected from AidData’s Chinese Official Finance Dataset (Strange et al. 2015).17 Chinese development assistance data is available for the 2000-2012 period for over 100 countries. Unfortunately, the Chinese OF data from AidData does not have full coverage of Chinese aid projects or project amounts (Strange et al. 2015). However, China AidData is the most complete source of Chinese development assistance available that is reported at the country and year level. China does not report disaggregated statistics on its development assistance.
The Chinese development assistance data is categorizes into three types: ODA-like, OOF-like, and Vague OF. ODA-like flows meet the definition for ODA specified by the OECD DAC (Strange et al. 2015). As previously noted, OOF is defined as official financing that does not meet the DAC definition of ODA, because it lacks a significant grant element
16World Bank data on the number of conditions attached to projects is not currently publicly available for
use as a control variable but may be available to researchers upon request.
17To capture Chinese OF to all regions, this study utilizes aggregated data from the Aggregate Dataset
or an explicit development purpose. Vague OF is defined as any flow that constitutes official financing, but for which there is not enough information to confidently classify as ODA-like or OOF-ODA-like development assistance (Strange et al. 2015). The measure of Chinese development assistance used in this study is Chinese OF, which is the sum of ODA-like, OOF-like, and Vague OF flows. The formal model developed in this study does not make a distinction between ODA-like and OOF-like Chinese flows. Both types of development assistance are sources of unconditional assistance allocated to recipient countries and are hypothesized to have a similar impact on compliance with Western conditionality. Data on Chinese OF is reported in current USD. Chinese OF amounts are converted to into constant 2005 USD and divided by recipient country GDP at market prices in 2005 USD to create a measure of Chinese OF as a percent of recipient country GDP. In order to test the effect of Chinese OF on compliance during an aid project, the five-year average of Chinese OF as a percent of GDP prior to the completion of the World Bank project is used as the primary explanatory variable.18 A five-year average is in alignment with the average project duration of 5.6 years during the study period.
Data on DAC ODA is collected from the OECD International Development Statistics database. The DAC ODA data measures net disbursements of ODA by OECD countries and multilateral organizations. DAC ODA is also measured as a percent of recipient country GDP. Five-year lagged averages prior to the completion of the project are calculated and utilized in the analysis.
Control Variables
Both country-level and project-level variables are included in the analysis to control for de-terminants of compliance with aid conditionality. Like the aid variables, the control variables
18The calculation of the five-year average of Chinese OF as percent of GDP prior to project completion
are measured as averages over the five-year period prior to project completion unless stated otherwise. Based on the strategic importance literature, a binary control variable is included for former colonies of major World Bank donors using data from Rose (2005). Additionally, a binary control variable for alliance relationships with major World Bank donors is included using data from Leeds (2005). The binary variables are equal to 1 if the country is a former colony of or has a relationship with a major World Bank donor and 0 otherwise. Major World Bank donors include the United States, Germany, France, United Kingdom, Canada, and Japan.19
Variables for natural resource rents, FDI, debt level, and population are included to control for alternative sources of revenue that may affect compliance. Data on natural resource rents as a percent of GDP is collected from the World Development Indicators (WDI) database. Natural resource rents as a percent of GDP is averaged over the five-year period prior to the completion of the project. Data on FDI stock as a percent of GDP is collected from UNCTAD database. Following Girod and Tobin (2016), FDI stock as a percent of GDP is averaged over the five-year period prior to the start of the project in order to capture a recipients desire to maintain or increase FDI (p. 223). Data on external debt stocks as a percent of GDP was collected from the WDI database. External debt level is a measure of a country’s ability to access credit from private sources. Countries with high levels of external debt are likely unable to access credit and, therefore, more likely to comply with aid conditionality in order secure the revenue source in the future. Data on population is collected from the WDI database. Countries with larger populations have a larger tax that may decrease the importance of foreign aid as a source of revenue.20
Several variables are also included to control for the economic and institutional capacity of the recipient country including GDP per capita, infant mortality, political constraints, level
19Colony and Alliance data is drawn from the replication files of Girod and Tobin (2016).
20Data on tax revenue as a percent of GDP from the WDI database is also collected, but data coverage for
of democracy, and quality of governance. Data on GDP per capita data is collected from the WDI. GDP per capita is a measure of economic capacity and financial independence and could have a negative impact on compliance (Girod and Tobin 2016). GDP per capita is also a measure of institutional quality and could have a positive effect on compliance. Infant mortality rate data is collected from the WDI and measures institutional capacity to offer basic services. Political constraints is measured using the Henisz (2000) index, which measures a government’s ability to credibly commit to a policy. The index measures the number of veto players and their alignment across branches of government. Based on the literature on regime type and compliance, level of democracy is controlled for using the Polity2 index from the Polity IV dataset. Governance data is collected from the World Governance Indicators (WGI). To measure quality of governance, a composite index of the six WGI indicators of governance is created. The composite index is a simple average of six governance measures. The measures include voice and accountability, political stability and absence of violence, government effectiveness, regulatory quality, rule of law, and control of corruption. Each indicator ranges from -2.5 (poor quality of governance) to 2.5 (high quality of governance). Quality of governance is expected to have a significant positive effect on compliance.
and a detailed description of the variables and data sources is available in the Appendix A.
Empirical Strategy
To analyze the relationship between Chinese OF and compliance with World Bank condi-tionality, the following multilevel mixed effects generalized linear model will be employed:
Compit=β0+β1Xijt+u1jtXijt+v0t+u0jt (14)
whereCompijtdenotes the compliance rating for projecti in countryj in periodt. Xijtis the
vector of explanatory variables. u0jt is a random intercept for country, andv0t is a random
intercept for year. u1jt is a random coefficient for the vector of explanatory variables.
The hierarchal nature of the IEG Project Performance Ratings dataset aligns with a multilevel model framework. A multilevel model allows the country-level estimates produced from the model to capture both project- and country-level variation and offers a flexible com-promise between no pooling (fixed effects) and complete pooling (OLS). A multilevel random coefficients model assumes that mean unit effects are uncorrelated with the means of project-level variables or to the actual values of country-project-level variables. Multiproject-level random effects estimation also assumes the variance of unit effects is constant across units. A variation of the multilevel model specified in equation (14) will be estimated using the alternative binary measure of compliance. To test this specification, a multilevel mixed effects logit model is utilized. For all mixed effects models, LR tests comparing the multilevel model to a non-nested model will be performed. Cluster-robust standard errors are utilized in all specifications in the mixed effect GLM estimations but are not available for the mixed effect logit models.21
In order to check the robustness of the multilevel model assumptions, a secondary model based on country-level data will estimated using a fixed effects panel estimator. The primary
project-level dataset will be averaged to the country-level. The country-level data will be used to estimate the following model:
Compit=αi+βCHOF/GDPit−m+γZit+φt+it (15)
whereCompitdenotes the compliance rating for country i in periodt. ChODA/GDPit−m is
primary explanatory variable of interest and refers to the five-year average of Chinese OF as a percent of GDP prior to the project completion. Zit denotes the set of control variables,
αi is the country fixed effect, φt is the year fixed effect, andit is the error term.
The fixed effects model assumes that there is no correlation between the time-varying part of the error term and the independent variables and the dependent variable. The fixed effects model does assume there is correlation between the time-invariant part of the error term (ai) and the independent variables as well as the dependent variable. Fixed effects
estimation removes correlation between the time-invariant part of the error term and the independent variables and the dependent variable by differencing out the unit mean. Said differently, fixed effects removes the time-invariant part of the error term by specifying an indicator variable for each individual. Cluster-robust standard errors are utilized in all country-level model specifications.
Results
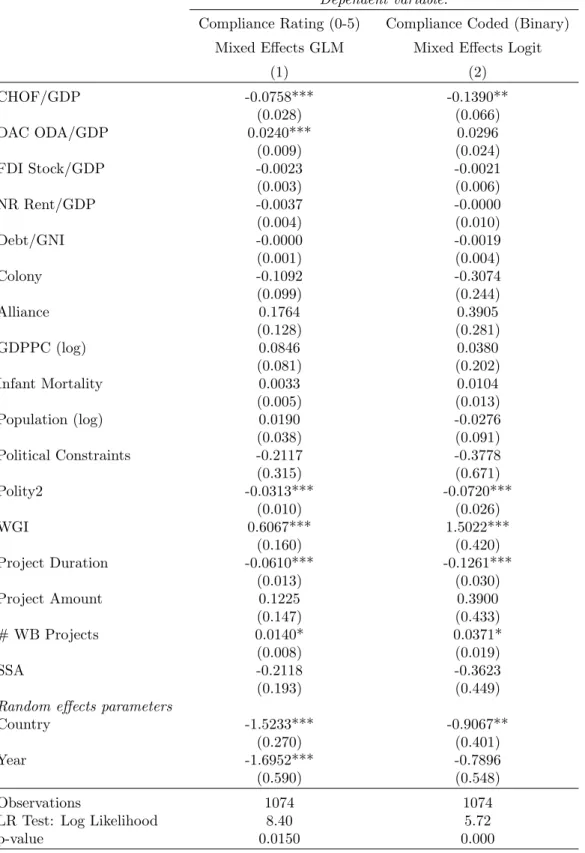
Table 2 presents the main results of the mixed effects model estimations. Models 1 reports the results of the mixed effects GLM model using the Compliance Rating dependent variable.22
Model 1 estimates equation (14). The coefficient estimate on CHOF/GDP is negative and statistically significant. A one percent increase in average CHOF/GDP prior to the project completion is associated, on average, with a 0.0758 reduction in Compliance Rating. A
22A mixed effects ordered logit model is also estimated and produces similar results as the mixed effects
one standard deviation (1.32) increase in CHOF/GDP is associated with a 0.10 decrease in Compliance Rating.23 This finding supports the hypothesis that CHOF/GDP has a
negative effect on compliance with World Bank conditionality. The control variables for Polity2 and Project Duration are found to be negative and statistically significant. The control variables for DAC ODA/GDP, WGI, and number of WB projects are found to be positive and statistically significant. A one standard deviation increase in DAC ODA/GDP (6.87) is associated with a 0.165 increase in Compliance Rating. Similarly, a one standard deviation (0.38) increase in WGI is associated with a 0.229 increase in Compliance Rating. The Likelihood Ratio test for Model 3 indicates the random effect parameters are not jointly equal to zero.
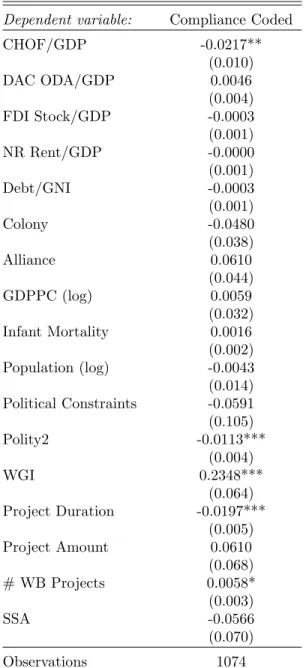
Model 2 in Table 2 reports the results of the mixed effects logit model using the alterna-tive binary dependent variable. CHOF/GDP is again found to be negaalterna-tive and statistically significant. For ease of interpretation, the average marginal effects are reported in Table 3. A one percent increase in CHOF/GDP results in a 2.17 percent decrease in the predicted probability of complying with a World Bank agreement holding all other variables constant. A one standard deviation (1.32) increase in CHOF/GDP is associated with a 2.87 percent reduction in the predicted probability of compliance. In contrast, a one standard deviation (.38) increase in WGI is associated with a 8.8 percent reduction in the predicted probability of compliance.
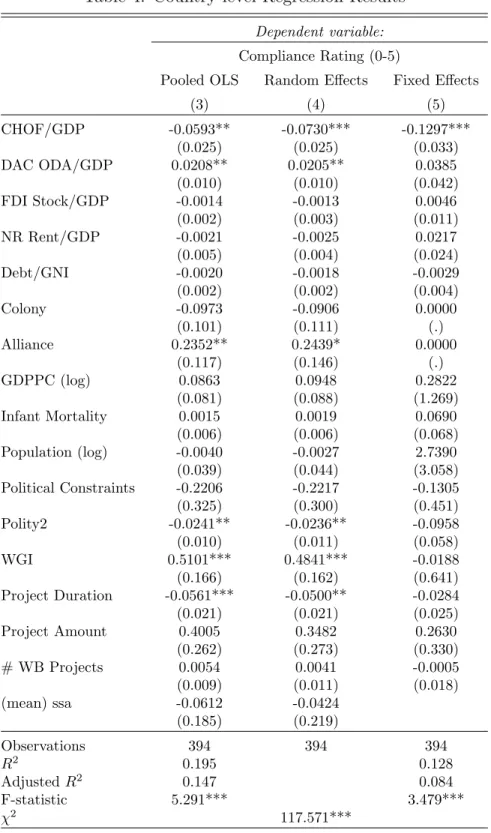
Table 4 presents the results for model estimations using the primary project-level data averaged at the country-level. Country-average data is utilized to addresses any potential bias that may exist in mixed effects estimations if the multilevel model assumptions do not hold. All of the estimations reported in Table 4 include year indicator variables. Model 3 reports the results of the country-level model estimated using pooled OLS, and Model 4 reports the results of the model estimated using a random effects estimator. In both models, the coefficient for CHOF/GDP is negative and statistically significant. The effect size for
CHOF/GDP estimated using random effects in Model 4 is consistent with the estimate produced by the mixed effects GLM model in Table 2. Model 5 reports the results of the model estimated with a fixed effects estimator. The coefficient on CHOF/GDP is found to negative and statistically significant. A one percent increase in CHOF/GDP within a country is associated with a 0.129 decrease in Compliance Rating, and a one standard deviation increase in CHOF/GDP within a country is associated with a 0.239 decrease in Compliance Rating. The “within” estimation of the effect size of CHOF/GDP is larger, in absolute terms, than the estimates produced from the random effects and multilevel estimations. Despite the use of an extensive set of control variables, the models in Table 4 explain a limited amount of the variation in compliance. The low adjusted R2 values raise some concern about potential
omitted variable bias.
To determine the most appropriate panel estimator in Table 4, Breusch-Pagan tests and Hausman tests are performed. To test between the random effects and pooled OLS estimations, a Breusch-Pagan test is performed. The null hypothesis that the error terms are independent within countries is rejected. Next, Hausman tests are performed between the pooled OLS and fixed effects estimations as well as between the random effects and fixed effects estimations. In both cases, the null hypothesis that the coefficient estimates between the specifications are not systematically different cannot be rejected. An alternative over-identification test (xtoverid in STATA), that permits the use of cluster-robust standard errors, also fails to reject the null hypothesis that fixed effects is a more appropriate estimator than random effects.24 The results fail to suggest that the fixed effects estimator is the most appropriate estimator. This suggests that fixed effects estimations in Models 5 may be inefficient as a result of discarding the variation in CHOF/GDP between countries.
Overall, the results of both multilevel model estimations consistently find that Chinese OF has a negative effect on recipient country compliance with World Bank conditionality.
24Year indicators are included in both tests. If year indicators are excluded, both tests reject the null
The estimated effect size of CHOF/GDP is somewhat limited substantively but is in line with the effect sizes of other explanatory variables found to be significant predictors of compliance. The coefficient estimates of CHOF/GDP might be impacted by the measurement of the variable using a 5-year average prior to project completion. As depicted in Figure 1, Chinese OF globally was fairly limited in the early 2000s relative to the 2006-2012 period. As a result, the measurement of the variable using a five-year lagged average likely has a moderating effect on the coefficient estimate. An updated Chinese AidData dataset with expanded temporal coverage is needed to test this hypothesis.
Robustness Checks
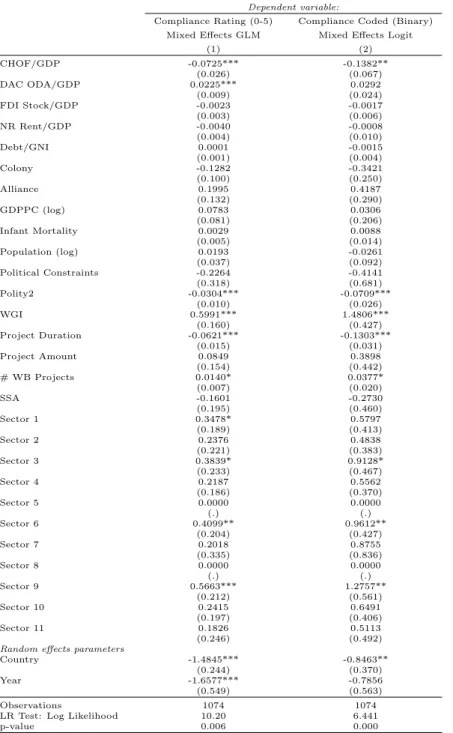
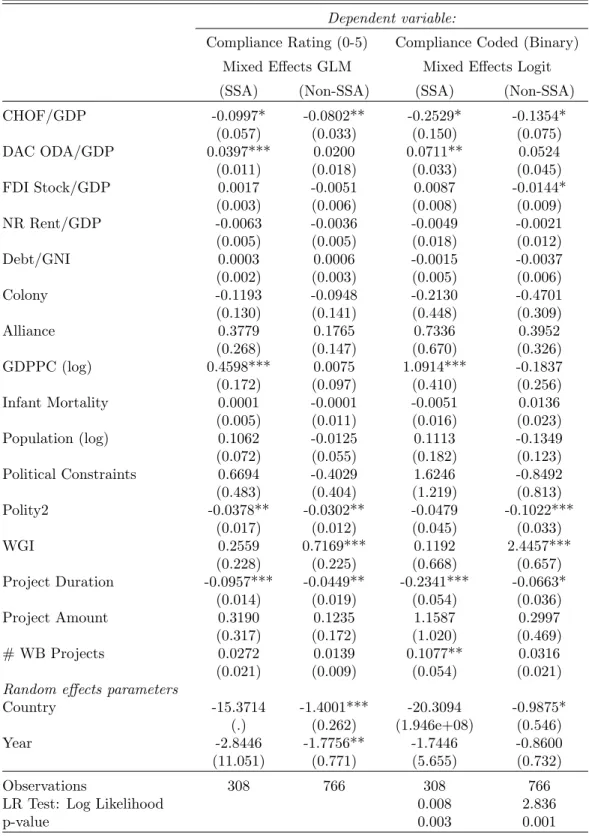
In addition to the secondary model, several robustness checks are performed to confirm the validity of the results. First, binary project sector variables are included in Models 1 and 2 to control for any variation in conditions across project sectors. The results are consistent with the reported results and are available in Table 5 in Appendix B. Second, an additional concern might be that Chinese assistance to Africa is driving the results. Sub-Saharan Africa has been a main focus of Chinese aid program and received over $94 billion in Chinese OF from 2000-2013 (Strange et al. 2015).25 The multilevel and country-level models
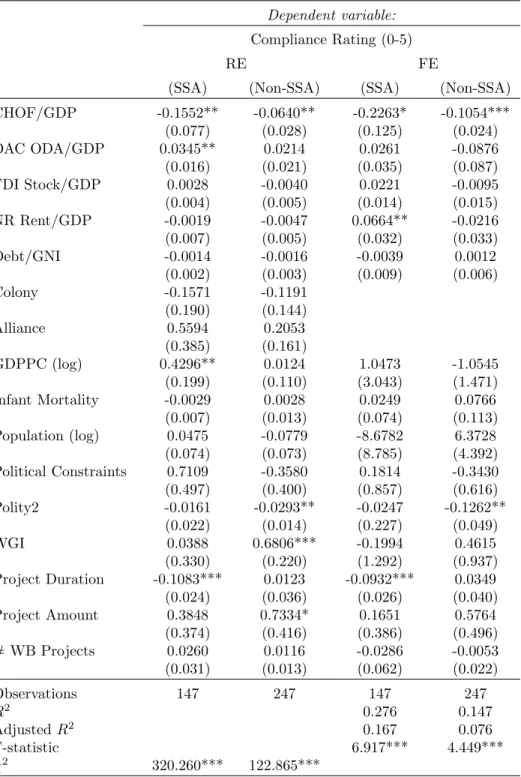
are re-estimated for SSA and non-SSA subsets of the data in Tables 6 and 7 and produce significant results for both subsamples of the data. However, the coefficient on CHOF/GDP is larger, in absolute terms, in the specifications using the SSA subset. Further analysis of the effect of Chinese aid on conditionality compliance in SSA should utilize the updated Chinese AidData (Version 1.3) dataset, which focuses solely on Chinese assistance to Africa. A final robustness check is performed using disaggregated Chinese OF measures. The models in Tables 2 and 3 are estimated using CHODA/GDP and CHOOF/GDP and reported in Tables 8 and 9 in Appendix B.26 Across the specifications reported in Tables 8 and 9,
25The ten largest Chinese aid recipients in SSA over the 2000-2013 period include Angola, Sudan, Ethiopia,
Ghana, Nigeria, DRC, South Africa , Zimbabwe, Kenya, and Mozambique.
post-CHOOF/GDP is found to be negative in statistically significant. CHODA/GDP is found to be negative but not statistically significant. As mentioned previously, the formal model developed in this study does not produce a theoretical distinction between the two forms of development assistance. The lack of statistical significance on the estimated coefficient for CHODA/GDP may be a result of its limited share of total Chinese OF. It is important to note that the measure of Chinese OOF also contains Vague OF, which is defined Chinese OF that cannot classified between ODA and OOF due to insufficient information.
The significant findings for CHOOF/GDP might also be related to the allocation pat-terns of Chinese development assistance. Evidence from Dreher et al. (2015) suggests that Chinese OOF is more likely to be allocated to countries with higher levels of corruption and/or natural resources than Chinese ODA. Despite the allocation patterns of Chinese OOF, the causal mechanism outlined in this paper is still valid. Chinese OOF provides an alternative source of unconditional development assistance that alters recipient government’s incentives to comply with Western aid conditionality. Countries with high levels of corrup-tion and/or natural resources are less likely to comply with Western aid condicorrup-tionality due to higher costs of policy reform. Policy reform, especially governance and anti-corruption reforms, in such countries can significantly alter the government’s access to rents. However, regardless a recipient’s initial likelihood of compliance, the presence of Chinese develop-ment assistance still decreases the reform cost a recipient governdevelop-ment is willing to accept in exchange for Western aid and decreases the likelihood of compliance.
Discussion and Conclusion
This study examines an important question about the effect of Chinese development assis-tance on the effectiveness Western conditionality by developing a formal model that incorpo-rates unconditional Chinese development assistance into the traditional aid-for-policy model framework between a Western donor and aid recipient. The model predicts that Chinese
development assistance limits the conditions (discount rate and reform cost) under which recipient countries are willing comply with Western aid conditionality. Empirical tests us-ing data on compliance with World Bank conditionality find support for the theory that Chinese development assistance has a negative impact on recipient country compliance with conditionality attached to Western aid.
The findings have several important implications for the effectiveness of Western aid and how Western donors disburse aid. China and other emerging donors are creating competition in the international aid system by offering attractive alternatives to Western aid. By alter-ing compliance incentives, Chinese development assistance undermines Western efforts to improve aid effectiveness and address fungibility through the use of conditionality. Chinese assistance also weakens the bargaining power of Western donors during the aid negotiation process. Western donors might respond to this increased competition from emerging donors by reducing the scope or number of conditions attached to aid.
TABLES
Table 1: Descriptive Statistics
Statistic N Mean St. Dev. Min Max
Table 2: Mixed Effects Regression Results
Dependent variable:
Compliance Rating (0-5) Compliance Coded (Binary)
Mixed Effects GLM Mixed Effects Logit
(1) (2)
CHOF/GDP -0.0758*** -0.1390**
(0.028) (0.066)
DAC ODA/GDP 0.0240*** 0.0296
(0.009) (0.024)
FDI Stock/GDP -0.0023 -0.0021
(0.003) (0.006)
NR Rent/GDP -0.0037 -0.0000
(0.004) (0.010)
Debt/GNI -0.0000 -0.0019
(0.001) (0.004)
Colony -0.1092 -0.3074
(0.099) (0.244)
Alliance 0.1764 0.3905
(0.128) (0.281)
GDPPC (log) 0.0846 0.0380
(0.081) (0.202) Infant Mortality 0.0033 0.0104 (0.005) (0.013) Population (log) 0.0190 -0.0276 (0.038) (0.091) Political Constraints -0.2117 -0.3778 (0.315) (0.671)
Polity2 -0.0313*** -0.0720***
(0.010) (0.026)
WGI 0.6067*** 1.5022***
(0.160) (0.420) Project Duration -0.0610*** -0.1261***
(0.013) (0.030)
Project Amount 0.1225 0.3900
(0.147) (0.433)
# WB Projects 0.0140* 0.0371*
(0.008) (0.019)
SSA -0.2118 -0.3623
(0.193) (0.449)
Random effects parameters
Country -1.5233*** -0.9067**
(0.270) (0.401)
Year -1.6952*** -0.7896
(0.590) (0.548)
Observations 1074 1074
LR Test: Log Likelihood 8.40 5.72
p-value 0.0150 0.000
Note: Robust standard errors are reported in parentheses for GLM specifications. LR tests performed on estimations without robust standard errors.
Table 3: Average Marginal Effects from Model 2
Dependent variable: Compliance Coded
CHOF/GDP -0.0217** (0.010) DAC ODA/GDP 0.0046 (0.004) FDI Stock/GDP -0.0003 (0.001) NR Rent/GDP -0.0000 (0.001) Debt/GNI -0.0003 (0.001)
Colony -0.0480
(0.038) Alliance 0.0610 (0.044) GDPPC (log) 0.0059 (0.032) Infant Mortality 0.0016 (0.002) Population (log) -0.0043 (0.014) Political Constraints -0.0591 (0.105) Polity2 -0.0113***
(0.004)
WGI 0.2348***
(0.064) Project Duration -0.0197***
(0.005) Project Amount 0.0610 (0.068) # WB Projects 0.0058* (0.003)
SSA -0.0566
(0.070)
Table 4: Country-level Regression Results
Dependent variable:
Compliance Rating (0-5)
Pooled OLS Random Effects Fixed Effects
(3) (4) (5)
CHOF/GDP -0.0593** -0.0730*** -0.1297*** (0.025) (0.025) (0.033) DAC ODA/GDP 0.0208** 0.0205** 0.0385 (0.010) (0.010) (0.042) FDI Stock/GDP -0.0014 -0.0013 0.0046 (0.002) (0.003) (0.011) NR Rent/GDP -0.0021 -0.0025 0.0217 (0.005) (0.004) (0.024) Debt/GNI -0.0020 -0.0018 -0.0029 (0.002) (0.002) (0.004) Colony -0.0973 -0.0906 0.0000
(0.101) (0.111) (.) Alliance 0.2352** 0.2439* 0.0000
(0.117) (0.146) (.) GDPPC (log) 0.0863 0.0948 0.2822
(0.081) (0.088) (1.269) Infant Mortality 0.0015 0.0019 0.0690 (0.006) (0.006) (0.068) Population (log) -0.0040 -0.0027 2.7390 (0.039) (0.044) (3.058) Political Constraints -0.2206 -0.2217 -0.1305 (0.325) (0.300) (0.451) Polity2 -0.0241** -0.0236** -0.0958 (0.010) (0.011) (0.058) WGI 0.5101*** 0.4841*** -0.0188 (0.166) (0.162) (0.641) Project Duration -0.0561*** -0.0500** -0.0284 (0.021) (0.021) (0.025) Project Amount 0.4005 0.3482 0.2630 (0.262) (0.273) (0.330) # WB Projects 0.0054 0.0041 -0.0005 (0.009) (0.011) (0.018) (mean) ssa -0.0612 -0.0424
(0.185) (0.219)
Observations 394 394 394
R2 0.195 0.128
AdjustedR2 0.147 0.084
F-statistic 5.291*** 3.479***
χ2 117.571***
Note: Robust standard errors are reported in parentheses. All specifications include year indicator variables.
FIGURES
Figure 1: Chinese Development Assistance by Flow Type
$- $10 $20 $30 $40 $50 $60 $70 $80 $90 $100
2000 2001 2002 2003 2004 2005 2006 2007 2008 2009 2010 2011 2012
2009 U
S
D
, Bi
ll
ion
s
Vague (Official Finance) OOF-like Official Investment ODA-like
Figure 2: Regional Distribution of Chinese Official Finance (2000-2012, 2005 USD)
East Asia & Pacific, 22%
Europe & Central Asia, 11%
Latin America & Caribbean, 31% Middle East & North
Africa, 1% South Asia, 12%
Figure 3: IEG Government Performance Score Trend (1995-2015, All Projects)
0 0.5 1 1.5 2 2.5 3 3.5 4
1995 1997 1999 2001 2003 2005 2007 2009 2011 2013 2015
G
ove
rn
me
n
t P
er
for
man
ce
S
cor
APPENDIX B: ROBUSTNESS CHECKS
Table 5: Mixed Effects Regression Results- Project Sector Controls Dependent variable:
Compliance Rating (0-5) Compliance Coded (Binary)
Mixed Effects GLM Mixed Effects Logit
(1) (2)
CHOF/GDP -0.0725*** -0.1382**
(0.026) (0.067)
DAC ODA/GDP 0.0225*** 0.0292
(0.009) (0.024)
FDI Stock/GDP -0.0023 -0.0017
(0.003) (0.006)
NR Rent/GDP -0.0040 -0.0008
(0.004) (0.010)
Debt/GNI 0.0001 -0.0015
(0.001) (0.004)
Colony -0.1282 -0.3421
(0.100) (0.250)
Alliance 0.1995 0.4187
(0.132) (0.290)
GDPPC (log) 0.0783 0.0306
(0.081) (0.206)
Infant Mortality 0.0029 0.0088
(0.005) (0.014)
Population (log) 0.0193 -0.0261
(0.037) (0.092)
Political Constraints -0.2264 -0.4141
(0.318) (0.681)
Polity2 -0.0304*** -0.0709***
(0.010) (0.026)
WGI 0.5991*** 1.4806***
(0.160) (0.427)
Project Duration -0.0621*** -0.1303***
(0.015) (0.031)
Project Amount 0.0849 0.3898
(0.154) (0.442)
# WB Projects 0.0140* 0.0377*
(0.007) (0.020)
SSA -0.1601 -0.2730
(0.195) (0.460)
Sector 1 0.3478* 0.5797
(0.189) (0.413)
Sector 2 0.2376 0.4838
(0.221) (0.383)
Sector 3 0.3839* 0.9128*
(0.233) (0.467)
Sector 4 0.2187 0.5562
(0.186) (0.370)
Sector 5 0.0000 0.0000
(.) (.)
Sector 6 0.4099** 0.9612**
(0.204) (0.427)
Sector 7 0.2018 0.8755
(0.335) (0.836)
Sector 8 0.0000 0.0000
(.) (.)
Sector 9 0.5663*** 1.2757**
(0.212) (0.561)
Sector 10 0.2415 0.6491
(0.197) (0.406)
Sector 11 0.1826 0.5113
(0.246) (0.492)
Random effects parameters
Country -1.4845*** -0.8463**
(0.244) (0.370)
Year -1.6577*** -0.7856
(0.549) (0.563)
Observations 1074 1074
LR Test: Log Likelihood 10.20 6.441
p-value 0.006 0.000
Table 6: Mixed Effects Regression Results- SSA Sample Restriction
Dependent variable:
Compliance Rating (0-5) Compliance Coded (Binary)
Mixed Effects GLM Mixed Effects Logit
(SSA) (Non-SSA) (SSA) (Non-SSA)
CHOF/GDP -0.0997* -0.0802** -0.2529* -0.1354* (0.057) (0.033) (0.150) (0.075) DAC ODA/GDP 0.0397*** 0.0200 0.0711** 0.0524 (0.011) (0.018) (0.033) (0.045) FDI Stock/GDP 0.0017 -0.0051 0.0087 -0.0144*
(0.003) (0.006) (0.008) (0.009) NR Rent/GDP -0.0063 -0.0036 -0.0049 -0.0021 (0.005) (0.005) (0.018) (0.012) Debt/GNI 0.0003 0.0006 -0.0015 -0.0037 (0.002) (0.003) (0.005) (0.006) Colony -0.1193 -0.0948 -0.2130 -0.4701 (0.130) (0.141) (0.448) (0.309) Alliance 0.3779 0.1765 0.7336 0.3952 (0.268) (0.147) (0.670) (0.326) GDPPC (log) 0.4598*** 0.0075 1.0914*** -0.1837 (0.172) (0.097) (0.410) (0.256) Infant Mortality 0.0001 -0.0001 -0.0051 0.0136 (0.005) (0.011) (0.016) (0.023) Population (log) 0.1062 -0.0125 0.1113 -0.1349 (0.072) (0.055) (0.182) (0.123) Political Constraints 0.6694 -0.4029 1.6246 -0.8492 (0.483) (0.404) (1.219) (0.813) Polity2 -0.0378** -0.0302** -0.0479 -0.1022***
(0.017) (0.012) (0.045) (0.033) WGI 0.2559 0.7169*** 0.1192 2.4457***
(0.228) (0.225) (0.668) (0.657) Project Duration -0.0957*** -0.0449** -0.2341*** -0.0663*
(0.014) (0.019) (0.054) (0.036) Project Amount 0.3190 0.1235 1.1587 0.2997 (0.317) (0.172) (1.020) (0.469) # WB Projects 0.0272 0.0139 0.1077** 0.0316 (0.021) (0.009) (0.054) (0.021)
Random effects parameters
Country -15.3714 -1.4001*** -20.3094 -0.9875* (.) (0.262) (1.946e+08) (0.546) Year -2.8446 -1.7756** -1.7446 -0.8600 (11.051) (0.771) (5.655) (0.732)
Observations 308 766 308 766
LR Test: Log Likelihood 0.008 2.836
p-value 0.003 0.001
Note: Robust standard errors are reported in parentheses for GLM specifications. LR tests performed on estimations without robust standard errors.
Table 7: Country-level Regression Results- SSA Sample Restriction
Dependent variable:
Compliance Rating (0-5)
RE FE
(SSA) (Non-SSA) (SSA) (Non-SSA)
CHOF/GDP -0.1552** -0.0640** -0.2263* -0.1054*** (0.077) (0.028) (0.125) (0.024) DAC ODA/GDP 0.0345** 0.0214 0.0261 -0.0876 (0.016) (0.021) (0.035) (0.087) FDI Stock/GDP 0.0028 -0.0040 0.0221 -0.0095 (0.004) (0.005) (0.014) (0.015) NR Rent/GDP -0.0019 -0.0047 0.0664** -0.0216 (0.007) (0.005) (0.032) (0.033) Debt/GNI -0.0014 -0.0016 -0.0039 0.0012 (0.002) (0.003) (0.009) (0.006) Colony -0.1571 -0.1191
(0.190) (0.144) Alliance 0.5594 0.2053 (0.385) (0.161)
GDPPC (log) 0.4296** 0.0124 1.0473 -1.0545 (0.199) (0.110) (3.043) (1.471) Infant Mortality -0.0029 0.0028 0.0249 0.0766 (0.007) (0.013) (0.074) (0.113) Population (log) 0.0475 -0.0779 -8.6782 6.3728 (0.074) (0.073) (8.785) (4.392) Political Constraints 0.7109 -0.3580 0.1814 -0.3430 (0.497) (0.400) (0.857) (0.616) Polity2 -0.0161 -0.0293** -0.0247 -0.1262**
(0.022) (0.014) (0.227) (0.049) WGI 0.0388 0.6806*** -0.1994 0.4615 (0.330) (0.220) (1.292) (0.937) Project Duration -0.1083*** 0.0123 -0.0932*** 0.0349 (0.024) (0.036) (0.026) (0.040) Project Amount 0.3848 0.7334* 0.1651 0.5764 (0.374) (0.416) (0.386) (0.496) # WB Projects 0.0260 0.0116 -0.0286 -0.0053 (0.031) (0.013) (0.062) (0.022)
Observations 147 247 147 247
R2 0.276 0.147
AdjustedR2 0.167 0.076
F-statistic 6.917*** 4.449***
χ2 320.260*** 122.865***
Note: Robust standard errors are reported in parentheses. All specifications include year indicator variables.
Table 8: Mixed Effects Regression Results- Disaggregated Chinese Official Finance
Dependent variable:
Compliance Rating (0-5) Compliance Coded (Binary)
(1) (2)
Mixed Effects GLM Mixed Effects Logit
CHODA/GDP -0.0672 -0.1443
(0.152) (0.312)
CHOOF/GDP -0.0686* -0.1193
(0.035) (0.073)
DAC ODA/GDP 0.0235*** 0.0289
(0.008) (0.024)
FDI Stock/GDP -0.0023 -0.0020
(0.003) (0.006)
NR Rent/GDP -0.0037 0.0002
(0.004) (0.010)
Debt/GNI 0.0000 -0.0018
(0.001) (0.004)
Colony -0.1051 -0.3062
(0.106) (0.247)
Alliance 0.1841 0.4083
(0.126) (0.281)
GDPPC (log) 0.0861 0.0407
(0.085) (0.203)
Infant Mortality 0.0039 0.0113
(0.005) (0.013)
Population (log) 0.0217 -0.0214
(0.039) (0.090)
Political Constraints -0.2014 -0.3477
(0.317) (0.678)
Polity2 -0.0316*** -0.0726***
(0.009) (0.026)
WGI 0.6084*** 1.5041***
(0.161) (0.419)
Project Duration -0.0608*** -0.1256***
(0.013) (0.030)
Project Amount 0.1221 0.3922
(0.146) (0.434)
# WB Projects 0.0142* 0.0378*
(0.008) (0.019)
SSA -0.2269 -0.3685
(0.199) (0.459)
Random effects parameters
Country -1.5287*** -0.9253**
(0.274) (0.412)
Year -1.6708*** -0.7734
(0.569) (0.534)
Observations 1074 1074
LR Test: Log Likelihood 8.40 5.630
p-value 0.015 0.000
Note: Robust standard errors are reported in parentheses. LR tests performed on estimations without robust standard errors. See Appendix A for descriptions of project sectors.
Table 9: Country-level Regression Results- Disaggregated Chinese Official Finance
Dependent variable:
Compliance Rating (0-5)
(RE) (FE)
CHODA/GDP -0.1237 -0.0982 (0.164) (0.235) CHOOF/GDP -0.0587* -0.1173***
(0.031) (0.034) DAC ODA/GDP 0.0204** 0.0393 (0.010) (0.044) FDI Stock/GDP -0.0012 0.0057 (0.003) (0.011) NR Rent/GDP -0.0024 0.0232 (0.004) (0.024) Debt/GNI -0.0017 -0.0028 (0.002) (0.004) Colony -0.0926
(0.117) Alliance 0.2565* (0.144)
GDPPC (log) 0.0918 0.3581 (0.092) (1.297) Infant Mortality 0.0024 0.0721 (0.006) (0.070) Population (log) 0.0001 2.8260 (0.044) (3.168) Political Constraints -0.1955 -0.1333 (0.302) (0.455) Polity2 -0.0242** -0.0950 (0.011) (0.059)
WGI 0.4947*** 0.0397
(0.164) (0.652) Project Duration -0.0485** -0.0274 (0.021) (0.025) Project Amount 0.3565 0.2674 (0.277) (0.331) # WB Projects 0.0044 0.0005 (0.011) (0.019)
SSA -0.0405
(0.227)
Observations 394 394
R2 0.121
AdjustedR2 0.074
F-statistic 3.461***
χ2 113.965***
Note: Robust standard errors are reported in parentheses. All specifications include year indicator variables.
REFERENCES
Bearce, David H. 2010. “Why foreign aid may be less effective at promoting economic growth in more democratic countries.” Unpublished manuscript. University of Colorado at Boulder .
Bermeo, Sarah. 2016. “Aid Is Not Oil: Donor Utility, Heterogeneous Aid, and the Aid-Democratization Relationship.”International Organization .
Bermeo, Sarah Blodgett. 2011. “Foreign aid and regime change: A role for donor intent.”
World Development 39(11):2021–2031.
Brautigam, Deborah. 2009.The dragon’s gift: the real story of China in Africa. OUP Oxford. Br¨autigam, Deborah. 2011a. “Aid With Chinese Characteristics: Chinese Foreign Aid and Development Finance Meet the OECD-DAC Aid Regime.” Journal of international development 23(5):752–764.
Br¨autigam, Deborah. 2011b. China, Africa and the International Aid Architecture. Technical report China and Africa: An Emerging Partnership for Development? Working Paper. Chapter 6: China, Africa and the International Aid Architecture.
Bueno De Mesquita, Bruce & Alastair Smith. 2009. “A political economy of aid.” Interna-tional Organization 63(02):309–340.
Cheng, Shuaihua, Ting Fang & Hui-Ting Lien. 2012. “China’s International Aid Policy and its Implications for Global Governance.” Research Center for Chinese Politics and Business Working Paper (29).
Condon, Madison. 2012. “China in Africa: What the Policy of Nonintervention Adds to the Western Development Dilemma.” PRAXIS: The Fletcher Journal of Human Security
27.
Copelovitch, Mark S. 2010. “Master or servant? Common agency and the political economy of IMF lending.” International Studies Quarterly 54(1):49–77.
Corkin, Lucy. 2011. “Uneasy allies: China’s evolving relations with Angola.” Journal of Contemporary African Studies 29(2):169–180.
Custer, Samantha, Zachary Rice, Takaaki Masaki, Rebecca Latourell & Bradley Parks. 2015. “Listening to Leaders: Which Development Partners Do They Prefer and Why.”
Williamsburg, VA: AidData .
De Mesquita, Bruce Bueno. 2005. The logic of political survival. MIT press.