RELATIONSHIP BETWEEN SEXUAL MINORITY COUPLES AND TOBACCO RETAILER DENSITY AND MARKETING
Joseph G. L. Lee
A dissertation submitted to the faculty at the University of North Carolina at Chapel Hill in partial fulfillment of the requirements for the degree of Doctor of Philosophy
in the Department of Health Behavior.
Chapel Hill 2015
Approved by: Kurt M. Ribisl J. Michael Bowling Adam O. Goldstein William K. Pan
ABSTRACT
Joseph G. L. Lee: Relationship between Sexual Minority Couples and Tobacco Retailer Density and Marketing
(Under the direction of Kurt M. Ribisl)
Introduction. Tobacco use is markedly higher among lesbian, gay, and bisexual (LGB) populations than heterosexuals. Higher density of tobacco retailers and more tobacco
marketing is found in neighborhoods with more low-income residents and more racial/ethnic diversity. Same-sex couples tend to live in similar neighborhoods, but the association of this demographic with tobacco retailer density or marketing have not been examined.
Methods. Data come from a study of 97 US counties, with tobacco retailers geocoded to census tracts and direct observation of marketing in 2,234 retailers in 2012. In the first study, I used spatial regression to test the relationship between the rate of same-sex couple
households and the number of tobacco retailers per 1,000 people in 17,667 census tracts. In the second study, I used multi-level models to test the relationship between the same-sex couple household rate in census tracts and retailers’ marketing characteristics. In both studies, I examined the association of the outcome variables in sex-stratified models, including neighborhood demographics and other environmental characteristics to examine confounding.
of interstate highways, and urbanicity, which are neighborhood correlates of higher tobacco retailer density. For male couples, the association persisted after control for these
characteristics. Contrary to our hypotheses, we found no evidence of tobacco industry
marketing at tobacco retailers differing by rates of same-sex couples in census tracts with the exception of three findings in the opposite direction of our hypotheses.
Conclusion. Same-sex couples reside in areas with higher tobacco retailer density, but tobacco retailer marketing characteristics may not differ substantially. While LGB disparities in tobacco use may be influenced by neighborhood environment, the magnitude of the
ACKNOWLEDGEMENTS
I started applying to PhD programs with a good deal of enthusiasm for taking my skills to the next level and then thought hard about opportunity costs. But, I really wanted to be able to design and evaluate better programs and use those skills to reduce health
disparities and improve health in my communities, from Appalachian through LGBT and beyond. I would not have made it into the program without the stellar mentorship (and
intervention at a neighborhood deli that I really had to get my PhD) from Adam O. Goldstein. I would not have made it through without the support and mentorship from Leah M. Ranney, who made sure I had a very, very thorough understanding of the opportunity costs of
graduate school and who provided exceptional guidance on managing teams of FDA inspectors.
My thanks to the Department of Health Behavior for moral support and Dean Barbara Rimer for financial support that allowed me to teach a much-needed course on LGBT health. Vangie Foshee provided exceptional guidance in her proposal development course that helped me secure an F31 grant to pay for my dissertation. UNC’s Gillings School of Global Public Health, from the master’s program through my PhD, has been unfailingly supportive and warm. It has been an honor to come from the Carolina family.
To Chris, Jen, Tim, and Susan at Lusconi, thank you for my Tuesday dissertation writing sessions and needed escape.
I could not imagine a more supportive and thoughtful advisor than Kurt M. Ribisl who magically balanced pushing me to do better and supporting my efforts, giving guidance and independence, and who keeps research both fun and ever relevant to pressing policy issues. My committee, Drs. J. Michael Bowling, Adam O. Goldstein, William K. Pan, and H. Luz McNaughton Reyes, was incredibly patient and helpful. Thank you!
None of this would have been possible without the loving support (and frequent inspiration to finish sooner) provided by my husband, Justin A. Clapp. You put up with so much dissertation- and research-related stress, creative financing, and time spent on research; I owe you for this degree, and I thank you for your love.
Lastly, following in the footsteps of Kurt Ribisl’s own dissertation, I have to acknowledge the inspirational example of a life with no dissertation work to do as demonstrated by two cats, Ruby and Jasper, who somnolently enjoyed the sun while I worked on my computer.
U01CA154281. The content is solely the responsibility of the authors and does not
TABLE OF CONTENTS
LIST OF TABLES ... xi!
LIST OF FIGURES ... xii!
CHAPTER 1: INTRODUCTION ... 1!
Background and Problem ... 1!
Why the Retail Environment Matters to Tobacco Use Initiation, Dependence, and Cessation and Disparities Therein ... 3!
Disparities in Tobacco Retailer Density ... 4!
Disparities in POS Tobacco Marketing ... 6!
Getting Into One’s Lungs: Applying Frameworks and Theories of Disparity ... 9!
Conceptual Overview ... 9!
Applicability of the Bernard Framework of Neighborhood Health Disparities ... 10!
“Get Thee to a City”: Internal Migration, Gay and Lesbian Enclaves, and Residential Patterning ... 14!
Establishment and Reproduction of Gay and Lesbian Enclaves ... 15!
Role of Internal Migration in Same-Sex Couple Density ... 17!
CHAPTER 2: IS THERE A RELATIONSHIP BETWEEN THE CONCENTRATION OF SAME-SEX COUPLES AND TOBACCO RETAILER DENSITY? ... 21!
Introduction ... 21!
Methods... 23!
Data Sources: Census Tract Characteristics ... 26!
Measures ... 26!
Analysis Strategy ... 28!
Modeling Approach ... 29!
Results ... 29!
Same-Sex Couples and Tobacco Retailer Density ... 29!
Sensitivity Analysis ... 33!
Discussion ... 34!
Principal Findings ... 34!
Strengths and Weaknesses of the Study ... 36!
Conclusion ... 36!
CHAPTER 3: RELATIONSHIP BETWEEN RETAILERS’ POINT-OF-SALE TOBACCO MARKETING AND RATE OF SAME-SEX COUPLES IN CENSUS TRACTS ... 38!
Introduction ... 38!
Methods... 41!
Selection of Counties ... 41!
Tobacco Retailer Sampling Frame ... 42!
POS Marketing Audit ... 43!
Demographic Data ... 44!
Analysis... 46!
Selection of Area Unit ... 46!
Statistical Approach ... 46!
Results ... 47!
Price ... 47!
Product Availability ... 48!
Role of Store Type, Neighborhood Characteristics, and County Rurality ... 48!
Discussion ... 56!
Limitations ... 58!
Conclusion ... 60!
CHAPTER 4: BUILDING OUR UNDERSTANDING OF TOBACCO-RELATED DISPARITIES AMONG LESBIAN, GAY, BISEXUAL, AND TRANSGENDER PEOPLE ... 61!
APPENDIX A. SAME-SEX COUPLE CORRECTION ... 72!
APPENDIX B. FLOW DIAGRAM OF STORE AUDITS ... 85!
APPENDIX C. ASSESSMENT OF STORE TYPE DIFFERENCES IN AUDIT REFUSAL ... 86!
APPENDIX D. SENSITIVITY ANALYSES OF RETAILER TOBACCO MARKETING CHARACTERISTICS ... 87!
LIST OF TABLES
Table 1. Key Measures and Definitions ... 26! Table 2. Same-Sex Couple Household Rate Predicting Tobacco
Retailer Density ... 30! Table 3. Dependent Variables by Domain of Marketing and
Inter-Rater Reliability ... 44! Table 4. Independent Variables ... 45! Table 5. Two-Level Weighted Models Associating Female Same-Sex
Couple Rate with Retailer Tobacco Marketing Characteristics,
Random Tract Intercepts ... 50! Table 6. Two-Level Weighted Models Associating Male Same-Sex
Couple Rate with Retailer Tobacco Marketing Characteristics, Random
Tract Intercepts ... 52! Table 7. Three-Level Weighted Models Associating Same-Sex Couple
Rate with Retailer Tobacco Marketing Characteristics, Random County
and Tract Intercepts (97 counties, U.S.A.) ... 54! Table 8. Unadjusted Odds of Non-Response by Neighborhood and
Store-Type Characteristics (n=2,231) ... 86! Table 9. Three-Level Models Associating Female Same-Sex Couple
Rate with Retailer Tobacco Marketing Characteristics, Random County
and Tract Intercepts (Control for County Population) ... 87! Table 10. Three-Level Models Associating Male Same-Sex Couple Rate
with Retailer Tobacco Marketing Characteristics, Random County and
Tract Intercepts (Control for County Population) ... 90! Table 11. Two-Level Models Associating Female Same-Sex Couple Rate
with Retailer Tobacco Marketing Characteristics, Random Tract
Intercepts (Control for County Population in Lieu of Survey Weights) ... 93! Table 12. Two-Level Models Associating Male Same-Sex Couple
Rate with Retailer Tobacco Marketing Characteristics, Random Tract
Intercepts (with Control for County Population in Lieu of Survey Weights) ... 95! Table 13. Three-Level Nested Models Associating Same-Sex Couple
Rate with Retailer Tobacco Marketing Characteristics, Random County and Tract Intercepts, 97 Counties, USA (Control for County Population
LIST OF FIGURES
Figure 1. Conceptual framework for creation and reproduction of
neighborhood disparities related to tobacco retailer density and marketing
based on Bernard et al.89 ... 11! Figure 2. Slide from Philip Morris USA Integrated Retail Demographic
Database presentation.99 ... 13! Figure 3. Counties included in sampling frame, n=97. ... 24! Figure 4. Same-sex couples per 1,000 partnered households classified
by natural breaks (Jenks) and mean number of tobacco retailers per 1,000 population, census tracts (n=17,667), 97 counties, U.S.A., in 2010 and
CHAPTER 1: INTRODUCTION Background and Problem
Tobacco dependence has become a global epidemic due to the marketing, distribution, and addictiveness of tobacco products. Indeed, a globally linked set of corporations have worked to make tobacco use normative, glamorized it, made products ubiquitous, and conducted calibrated campaigns to undermine public health interventions.1,2 To maintain a broad and profitable market, the tobacco industry has engaged in racketeering and knowingly misled the public.3 As a World Health Organization report notes, “Tobacco use is unlike other threats to global health. Infectious diseases do not employ multinational public relations firms. There are no front groups to promote the spread of cholera.
Mosquitoes have no lobbyists.”4(p.244) This multinational corporate enterprise is not without cost to society and to individuals. Tobacco use is a major cause of disability and premature death. Tobacco causes over 480,300 premature deaths and 5.4 million years of productive life lost annually in the United States.5 Tobacco dependence is causally related to cancer
incidence and myriad health morbidities.6
50% higher than among straight people.11 Data for transgender populations are scarce,* although disparities exist.12 Disparities in lung health and cardiovascular disease for LGB people are also likely related to tobacco use.13,14
The reasons for this disparity are only partially known, and research has focused primarily on the role of discrimination, stress, and stigma,15 specifically using the minority stress model.16 Briefly, tobacco use is hypothesized to be more common among populations for which discrimination and stigma result in added stress. Tobacco use can serve as a coping strategy for such stress, and stress can hinder quit attempts. Other ecological approaches may also help explain higher prevalence of tobacco dependence among LGB populations than among heterosexual populations.15 Although research has been limited, suggested
determinants include the role of LGB bars and the media environment. Researchers have suggested that the role of LGB bars as safe community spaces may promote tobacco use.17,18 In the media environment, tobacco use is highly visible in the LGB print press and in LGBT-themed movies while coverage of cessation is rare.19-21 Similarly, in LGB news blogs
discussion of the tobacco epidemic is rare and little focus is given to cessation.22 The tobacco industry has targeted its marketing directly at LGB communities.23,24
Although much of the tobacco industry’s targeting marketing is overt and present in the LGB press, the industry has also engaged in more subtle forms of marketing.23 These include emphasis on LGB workplace non-discrimination policies and participation in the Human Rights Campaign’s Workplace Equality Index25 as well as sponsorship of HIV/AIDS and arts organizations.26 In one of the industry’s most clearly articulated plans to market to gay men, cleverly titled Project Sub-Culture Urban Market (SCUM), RJ Reynolds planned to
make its products and their marketing ubiquitous in a neighborhood widely considered to be a gay enclave, San Francisco’s Castro.27 Project SCUM called for better “in store presence,” “store front presence,” and “consistent POS (point-of-sale)/PDI placements” with an
objective to “[p]enetrate fragmented/nontraditional outlets to increase Camel’s Distribution [sic] and presence.”27 It is notable that the tobacco industry, in its clearest example of marketing to LGB populations, focused on making tobacco products and marketing ubiquitous at the POS in neighborhoods where LGB people are concentrated.
This spatial component of marketing to LGB people has been largely ignored in studies of the etiology of LGB health disparities in tobacco.15 Yet there is emerging
demographic evidence that internal migration of LGB people within the United States results in the concentration of same-sex couples† in more diverse and lower-income neighborhoods, in regional cities, and in places where there are already more same-sex couples.28,29 These patterns are more complex than the common view of migration of LGB people to major cities.30 If these patterns put LGB people in spaces where there is disproportionate exposure to tobacco industry marketing, this could help explain the presence of large disparities in tobacco use for LGB populations compared to heterosexual populations.
Why the Retail Environment Matters to Tobacco Use Initiation, Dependence, and Cessation and Disparities Therein
Tobacco marketing at the point of sale (POS) is part of a broader marketing effort that is causally related to smoking initiation.31,32 The tobacco industry spends the majority (85%) of its reported marketing dollars at the POS in the United States.33,34 Eminent tobacco control researchers have argued that strategies can be judged by the industry’s [re-]action;35 that is, if POS marketing were not effective, corporate leaders would not invest so heavily in it33,34 or
protest restrictions so fervently. Two systematic reviews have synthesized the evidence of the impact of POS marketing on tobacco-related health behaviors, suggesting both sufficient evidence for policy intervention and the need for more prospective studies.36,37 Both a
National Cancer Institute monograph and the Surgeon General report indicate the importance of POS marketing.31,38
More specifically, tobacco marketing at the POS likely contributes to the
normalization of tobacco products,39 is associated with smoking initiation among youth,40,41 is associated with brand preference among youth,42 can prompt impulse purchases by
smokers,43,44 and serves as a primary communications channel for industry marketing efforts to patrons of retail stores, including children.45 Such communications are designed promote positive views of tobacco use and are often targeted to youth and people attempting to quit.
46-48 Being near to a store is associated with decreased likelihood of quitting49,50 and with
current smoking.41,51,52
Disparities in Tobacco Retailer Density
The first report of a disparity in tobacco retailer density found greater density of tobacco retailers in lower socio-economic status (SES) and higher African American census tracts by quartile in a single New York county.53 Further research identified similar
disparities in census tracts within an Iowa county.54 In the same Iowa county researchers found the opposite result when using geographically weighted regression (GWR),‡ which is typically used in an exploratory fashion, finding unexpected negative associations between density and percent African American.55 Among all 99 Iowa counties, however, at the county level of analysis, tobacco retailers were disproportionately present in areas with,
unexpectedly, higher incomes and, as expected, with higher percentages of racial/ethnic minorities.56,57 These differences in Iowa suggest the challenge of interpreting results from larger area units such as counties, which do not approximate neighborhoods, using a single county and using regression approaches that may be best suited to exploratory work.
Five studies examine tobacco retailer density in New Jersey using increasingly sophisticated analytic techniques. Fakunle and colleagues (2010) analyzed census tracts in two New Jersey counties and found differences in retailer density by quartile of median household income and racial/ethnic demographics in the expected direction.58 A statewide cluster analysis (i.e., a K-means cluster analysis) of tract characteristics found high retailer density in conjunction with higher percentages of African American and Hispanic residents and lower median income.59 Geographically weighted regression techniques yielded similar findings only after transformation to achieve normality of residuals.60 Last, spatial
regression§ approaches used at the census-tract level with statewide data found greater percentage Hispanic, lower median income, and greater percentage African American were predictors of greater tobacco retailer density.61
In New York, the density of retailers around New York City schools was not found to be related to race, ethnicity, or income in multivariable regression.62 A statewide analysis in New York using spatial regression at the census-tract level, however, found greater tobacco retailer density for lower SES and higher proportion African American areas.63
Fewer studies examine these findings in other areas of the United States. In randomly
§ That is, a regression model in which spatial autocorrelation or the “geographic influence of being near” is explicitly included in the model, thereby accounting for the problem of non-independence of contiguous area units. Such models can vary in their treatment of the dependent variable’s assumption of form using a spatial regression approach to ordinary least squares regression, Poisson regression, etc. Multi-level modeling
selected census tracts in Omaha, Nebraska, the percent of African American and percent of Hispanic residents were positively associated with tobacco retailer density while median income was negatively associated.64 Nationally, Rodriguez and colleagues found tobacco retailer density to be significantly and positively related to Hispanic ethnicity, poverty, and other indicators of SES using multivariable linear regression.65
Globally, disparities in tobacco retailer density by deprivation indices and other measures of SES have been found in Southeast Queensland, Australia;66 Western Australia;67 Ontario, Canada;68 Cologne, Germany;69 and New Zealand.70 However, one study from New South Wales, Australia, found no relationship between SES and retailer density71 until smoking prevalence was entered as a control.72
The patterns found across New York, Iowa, New Jersey, the United States as a whole, and even globally, when analyzed at appropriate area units (i.e., definition of neighborhood), show a consistent pattern of greater tobacco retailer density being associated with higher percentages of racial/ethnic minorities and lower income. These indicate greater access to tobacco products and the marketing at tobacco retailers provide cues to purchase tobacco products.43,73-75 The origin of these differences likely comes from two sources. First, the tobacco industry targets its marketing by neighborhood characteristics.76 Second, there are differences in store types where lower income and more diverse neighborhoods have smaller retailers and fewer chain retailers,77,78 likely due in part to historic underinvestment (e.g., redlining) of African American communities.
Disparities in POS Tobacco Marketing
neighborhoods is more complex than the evidence of disparities in tobacco retailer density. Lee, Henriksen, Rose, Moreland-Russell, and Ribisl (under review) conducted a systematic review of tobacco marketing disparities that identified 43 papers across the four P’s of
marketing:79 Price, Promotion, Product, and Placement. Although methodological quality and measures varied widely, several key findings suggest that disparities in marketing are present with more marketing in African American neighborhoods and there is greater volume of menthol marketing in African American neighborhoods. Additionally, several studies suggest differences in price: Menthol is found to be cheaper in neighborhoods with more African American residents.80
materials; however, they found little evidence of racial/ethnic disparities in marketing.84 In Oklahoma County, Oklahoma, John and colleagues found more tobacco marketing at stores in neighborhoods with lower income and more minority** population.83 These patterns from single cities show overall trends toward more marketing in neighborhoods with lower income and with more African American residents.
Several state- or province-wide studies confirm and extend these findings. Cohen and colleagues examined stores in 20 Ontario cities, finding more tobacco promotion in lower income areas after controlling for store type in a multi-level model.85 In California high school neighborhoods, Henriksen and colleagues found that as the percentage of African American students increased, the odds of a Newport promotion increased, the proportion of menthol advertising increased, and the cost of Newport cigarettes decreased; the same relationship was not found for the leading non-menthol brand, Marlboro.80 In Victoria, Australia, school neighborhoods, McCarthy and colleagues86 found that price discounts below the recommended retail price were disproportionally present in lower-income areas. Overall, these findings echo a previous systematic review of billboard and magazine marketing in black neighborhoods,†† which found higher amounts of marketing per person than in white neighborhoods.87 In sum, the presence of tobacco retailers and tobacco
marketing at the POS is not randomly distributed throughout the population. Although these studies present tantalizing evidence of neighborhood differences in tobacco marketing, which are already supported by differences in industry targeting of demographic groups,76 no
literature has examined neighborhood tobacco retailer marketing in relation to same-sex couples. The next section presents a conceptual overview of how tobacco retailer density and marketing can drive disparities. I then make the case that the spatial patterning of tobacco retailer density and marketing may overlap with the patterning of same-sex couples’ neighborhood selection.
Getting Into One’s Lungs: Applying Frameworks and Theories of Disparity Conceptual Overview
How does the density of tobacco retailers and the marketing of tobacco products get under one’s skin or, perhaps more aptly, into one’s lungs? Moreover, how might this contribute to population health disparities? I contextualize this research within a social ecological framework88 to detail how environmental factors such as tobacco industry
marketing can influence health behaviors. To expand this to the creation and reproduction of health disparities, I use a framework of neighborhood health disparities developed by
Bernard and colleagues.89 Yet these two frameworks only provide us with an understanding of how tobacco marketing matters and why its presence can influence health disparities. Additional consideration is required to conceptualize and guide understanding of the formation of same-sex dense neighborhoods, the migration of same-sex couples to those neighborhoods, and the characteristics of the spatial patterning thereof that might influence the relationship with the presence, types, and characteristics of tobacco retailers.
A recent systematic review shows that the literature measuring retail tobacco marketing is largely atheoretical with only a few mentions of broader theories and frameworks such as structural violence, diffusion of innovations, and community
has used domains of the Bernard framework89 to empirically examine neighborhood smoking disparities.91 Described in detail in the next section, this framework89 helps organize this project and provides the underpinnings of understanding the phenomena under study.
Although research on gay and lesbian space and place, or the “geography of sexualities,” was historically neglected,92 work in the 1980s and beyond in cultural
geography, economics, and demography has provided a rich set of research on the formation and maintenance of gay and lesbian neighborhoods as well as on internal migration patterns. I use this body of research to develop an empirically driven understanding of the formation of denser areas of same-sex couples and differences therein by gender that inform this dissertation research.
Applicability of the Bernard Framework of Neighborhood Health Disparities I use a theoretical framework of neighborhood health disparities developed by Bernard and colleagues.89 Derived from theories of structuration93 and reciprocity, Bernard and colleagues attempted to develop a framework that balanced individual agency and the social and physical structures of society in creating and reproducing health disparities at the neighborhood level. This framework allows for the role of historical processes that
the social ecological framework where domains of influence are essentially scaled up from micro- to macro-level influences, the domains of influence in the Bernard framework operate together within a single level: the neighborhood. Figure 1 shows an overarching framework, specific to the creation and reproduction of neighborhood disparities in tobacco retailer density and marketing volume that draws from Bernard et al.,89 Bronfenbrenner,88 and Sallis et al.94
Figure 1. Conceptual framework for creation and reproduction of neighborhood disparities related to tobacco retailer density and marketing based on Bernard et al.89
characteristics suggest components of the social and physical environment that contribute to the creation or reduction of health disparities. Specific examples from the Bernard
framework’s domains include the physical domain, whereby the presence of tobacco retailers, availability of specific tobacco products, and the presence of tobacco marketing contribute. The economic domain suggests the importance of neighborhood tobacco pricing and price promotions as well as minimum price floor policies. The institutional domain includes the enforcement of existing regulations on tobacco marketing as well as the governmental role in community investment (and thus the resources available and types of retailers) through banking policies. The community organization domain notes the
importance of local organization and empowerment to promote tobacco-related policies. Local sociability suggests the importance of resiliency against tobacco addiction and the
sharing of resources among community members. While I focus on the physical and economic domains of the Bernard framework in this dissertation, the others provide
additional context for understanding potential intervention points in tobacco retailer density and marketing disparities. Although this framework is not specific to LGB people, it provides a basis for understanding the relationship between neighborhoods and health disparities. Together, the domains of influence are useful in conceptualizing how neighborhood tobacco retailers and POS marketing can influence health and how there is potential for policy intervention at the neighborhood level.
state and federal policies, changed social norms to promote the acceptance of tobacco use, and saturated media environments with tobacco imagery.95 Thus, the four social domains of institutions, economics, local sociability, and community organizations have been influenced by lobbying, legal victories,2 corporate social responsibility campaigns,96,97 and
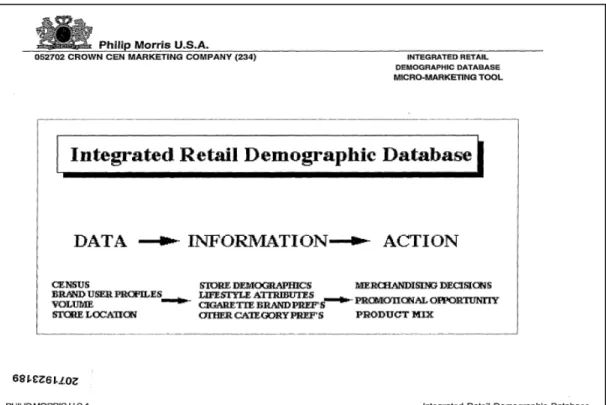
“philanthropy” to community organizations.98 The tobacco industry has been convicted3 of racketeering that subverted scientific findings and misled both the public and elected officials. Second, the tobacco industry plays a direct role in geodemographic marketing segmentation, thus carefully altering the physical presence of marketing materials and price promotions based on neighborhood characteristics to maximize sales. Figure 2 shows an example of this from a Philip Morris client presentation showing the use of neighborhood information to inform marketing strategies.
In summary, the tobacco industry and various macro-level forces influence neighborhoods and their retailers. At the same time, there is also social influence on same-sex couples’ neighborhood selection, toward which I now turn attention.
“Get Thee to a City”: Internal Migration, Gay and Lesbian Enclaves, and Residential Patterning
Movement to a city is something of a common theme in the historical and popular imagination about the “natural” trajectory of LGB lives.30,100 At first approach, gay and lesbian neighborhoods bring to mind San Francisco’s Castro; Washington, D.C.’s DuPont Circle; New York City’s Park Slope, Greenwich Village, and Chelsea; Paris’s Le Marais; and Tokyo’s Shinjuku Ni-chōme. Geographers have long tracked the development of LGB
neighborhoods,101 even diagramming the national distribution of gay bars.102 Cultural
geographers have catalogued the development of these neighborhoods across time in multiple cities,103-105 noting neighborhood differences by gender in both the development of
neighborhoods and their role in LGB life106 and examining the role of LGB space on identity formation.107,108 Researchers have identified the role of gay men and lesbians in
gentrification (i.e., reinvestment and renovation in neighborhoods that increases housing values and displaces existing residents when tax values rise quickly) and proposed stage-based models of neighborhood change (e.g., gay men move into red light districts with gay bars, housing renovations draw a broader population, and housing prices rise).109 Economists suggest that gay men, with fewer children and thus more resources, are drawn to cities with cultural amenities to a greater degree than opposite-sex couples.110 These approaches inform understanding of classic gay enclaves, but LGB people are also influenced by some of the same social forces that influence other people’s movement. Emerging research examines
is, an understanding of the geography of gay and lesbian neighborhoods and, more specifically, of overall LGB patterns of neighborhood selection must consider that these broad patterns of movement to a city are not universal and LGB people opt to live in the suburbs and the in rural areas well beyond the urban enclaves. In the next section, I discuss regional patterns of migration for LGB people and what we know about neighborhood selection.
Neighborhood, as cultural geographers and community psychologists remind us, has a meaning that is not entirely about physical space but also about a sense of place, shared history, and social connectivity.113 This sense of place and its role in LGB identity, housing selection, and activity space is also an important contributor to the spatial patterning of LGB lives. Given the research question driving the subsequent chapters—that same-sex dense neighborhoods may have more tobacco retailers and a greater volume of tobacco
marketing—understanding the formation of neighborhoods can help posit mechanisms behind identified disparities.
Establishment and Reproduction of Gay and Lesbian Enclaves
Early work on gay and lesbian neighborhoods noted two driving forces:
Research based in economics on the establishment of urban gay neighborhoods identified four stages of neighborhood development: 1) pre-conditions consisting of urban decline in red light districts; 2) emergence of clustering of gay bars and initial renovations in neighborhoods; 3) expansion and diversification of additional gay businesses, increasing housing availability, and growing density of gay households; and, 4) integration of the neighborhood into both gay and straight commerce with growing trendiness, construction of new apartment buildings, and suburban outflow of some early residents.109 Others have proposed a fifth stage of decline115 and offered empirical support for the gentrification of gay neighborhoods.116 Of course, although such a linear heuristic of neighborhood change is compelling, the dynamic social processes that alter neighborhoods are not so orderly and the future of gay and lesbian neighborhoods remains unknown.117 Real estate prices suggest a more complex pattern of influence on housing prices: using cross-sectional real estate sales data from Ohio, researchers found that the addition of a same-sex couple per 1,000
households was associated with increased housing values in progressive neighborhoods and lowered housing values in conservative neighborhoods.118
Although cities and their LGB neighborhoods have long captured [relatively] popular imagination, historians have investigated the presence of gay lives in places and spaces in rural areas119 and some work has explicitly examined gay life in the suburbs120 and rural areas.121-123 The formation and reproduction of the most visible urban neighborhoods interacts with in-migration to cities and out-migration to suburban areas.109 Thus, scholarly attention has increasingly turned to patterns of migration and residential selection and away from the most visible gay neighborhoods into examinations of rural, suburban, and
important part of one’s sexual identity development, even if one returns to their community of origin.108,111 Indeed, gentrification, access to other housing opportunities due to social acceptance, and legal recognitions are likely responsible for an ongoing changes to the spatial patterning of LGB populations. Thus, I next review the literature regarding internal migration of LGB people and the spatial patterns thereof.
Role of Internal Migration in Same-Sex Couple Density
In studies across multiple cities and in both rural areas and urban areas, gay and lesbian neighborhood selection is shown to be impacted by knowing someone in the neighborhood (i.e., social connections),124,125 the reputation of the neighborhood for being gay-“friendly,”122,125,126 and by the perception of an open-minded space.121 It is clear that housing patterns are not random; same-sex couples cluster in space resulting in national, regional, and local concentration.29,127 These are in addition to general trends toward amenities such as better weather, more jobs, and lower crime rates.128 It is unclear to what extent discriminatory policies play a role in housing selection, even though growing evidence suggests that wage penalties for gay men are present in states with more discriminatory policies129 and hiring discrimination is present to a greater extent in those same states.130 Because the burgeoning demographic literature on the movement and density of same-sex couples offers some conflicting findings, I present a brief review of the extant literature ordered by the size of the geographic unit used for analyses.
amenities and better climate and that the cultural amenities were more correlated with same-sex couples than social values about the morality of homosame-sexuality.110 Similar analyses by Walther and Poston found that at the MSA level better weather and lower crime rates were better predictors of same-sex couple indices than the political environment. Nonetheless, same-sex couples were more likely to be in MSAs that had fewer Republican voters.128 A more recent update of this research found same-sex couples more likely to be in places with low unemployment, higher temperatures, less conservatism, less discrimination, and larger size.131 Cooke and Rapino used the 2000 Census at the Bureau of Economic Analysis Area-level, which divides the contiguous United States into 177 areas. They found that for same-sex female couples, only movement toward less densely populated areas and the presence of other same-sex female couples were significant predictors of net migration, explaining 9% of the variance. For male same-sex couples approximately 17% of the variance in net migration could be explained by movement to less densely populated areas of the country as well as to areas scoring higher on an amenities index.28 These constitute patterns of migration at the regional level. I turn next to the zip code level, which better approximates neighborhoods within regions.
likely to live in neighborhoods with older housing than married couples, however, female sex couples and unmarried heterosexual partners have similar housing age; (5) same-sex couples are more likely to live in areas with higher crime rates than heterosame-sexual couples; and (6) same-sex male couples are more likely to live in areas with fewer owner-occupied homes than same-sex female or opposite sex couples.29
Hayslett and Kane used spatial regression to investigate same-sex couple density and neighborhood characteristics at the census tract level (n=226) in Columbus, Ohio.132 They found same-sex male couples were associated with neighborhood characteristics of
amenities, diversity, and openness while same-sex female couples were only associated with the presence of nearby density of same-sex couples. Spring examined same-sex couples in Census 2000 and Census 2010 using metrics of residential segregation in census tracts within the 100 census places (i.e., cities) with the highest population.133 Although same-sex couple segregation generally declined, there were still substantial levels of segregation within the 100 places at similar levels to economic/class segregation. Same-sex couple segregation was less extreme than racial/ethnic segregation. Other findings included greater segregation in areas of greater population, greater segregation in the South, and, for females, greater segregation in areas with higher median home prices.133
The following two chapters explore the relationships between tobacco retailer density, tobacco retailers’ marketing, and the concentration of same-sex couples in
CHAPTER 2: IS THERE A RELATIONSHIP BETWEEN THE CONCENTRATION OF SAME-SEX COUPLES AND TOBACCO RETAILER DENSITY?‡‡
Introduction
The lesbian, gay, and bisexual (LGB) population is routinely found to have a large, persistent disparity in tobacco use.10 In the 2012–2013 U.S. Adult Tobacco Survey, the prevalence of any tobacco use among LGB adults was 36% compared to 24% for heterosexual adults.134 Explanations for LGB tobacco use disparities typically focus on discrimination, structural stigma, and resulting stress.15 Media influence is another prominent explanation: LGB populations report high exposure24,135 and receptivity136 to targeted
tobacco industry marketing.23 Tobacco use is also normative in LGB print20 and
entertainment137 media. Other environmental influences have received too little attention, including the retail environment and concentration of stores that sell tobacco products (“tobacco retailers”) in neighborhoods. Emerging evidence shows that LGB people have unique patterns of migration and neighborhood selection.29,132,133 Yet a systematic review of the literature reveals no research examining whether tobacco retailers are more or less present in places where LGB people are more likely to live.15
Theories of neighborhood health disparities applied to tobacco retailer density suggest that tobacco retailers represent a physical presence that can hinder health by promoting ready access to tobacco products. Additionally these physical locations provide a channel for tobacco industry marketing and decrease search costs for tobacco products.89,91 Tobacco
retailers provide ubiquitous cues to smoke.37,43,44,138 Proximity to tobacco retailers is associated with decreased success in tobacco use cessation,49,139 although this may be true only in lower socioeconomic status neighborhoods.73 Tobacco retailer density has been associated with smoking behaviors51,140,141 and with youth initiation;52 however, some findings are mixed.49,141,142
There are both regional and local patterns of same-sex couple migration and
neighborhood selection in the United States.29 (We use the term same-sex couple to discuss migration and other aspects of research using census data, because individual sexual
orientation is not ascertained in the U.S. Census. In discussing broader literature regarding sexual orientation identity, we use LGB.) Indeed, similar levels of neighborhood segregation exist for same-sex couple households as for household income, although fewer than exist for race.133 Same-sex couples, like other couples, tend to migrate toward regions with better jobs, more temperate weather, lower crime, and more cultural amenities.28,110 Yet the political environment also matters for same-sex couples, with greater concentrations of same-sex couples in less conservative places128,131 and in regions with higher concentrations of other same-sex couples.28 Within these regions, however, neighborhood selection can be
influenced by several factors: Qualitative research finds strong evidence of the importance of other same-sex couples in neighborhood selection.125,126 These patterns of neighborhood selection differ somewhat by sex, with greater concentrations of same-sex male couples into fewer, more dense neighborhoods than for female same-sex couples.132 Same-sex couples, and male couples in particular, were more likely than opposite-sex couples to live in urban area zip codes, and in more racially/ethnically diverse zip codes with lower median
Existing evidence suggests racial minority and lower income neighborhoods have a disproportionately higher density of tobacco retailers. The first report of a disparity in tobacco retailer density found greater density of tobacco retailers in lower socioeconomic status (SES) and higher proportion African American census tracts by quartile in a single New York county.53 Similar findings have been identified in Iowa;54 New Jersey with added disparities for tracts with more Hispanic residents;58-61 New York state;63 for poverty and Hispanic residents in Chicago, Illinois;143 and for Hispanic residents and lower income in Omaha, Nebraska.64 In one national study, tobacco retailer density was related to Hispanic ethnicity, poverty, and other indicators of lower SES.65
In this national study, we sought to identify if same-sex couples live in areas with higher tobacco retailer density and to assess if the association is independent from other neighborhood characteristics.
Methods Data Sources: Tobacco Retailers
This is a secondary analysis of data from Advancing Science and Policy in the Retail Environment (ASPiRE), funded by the National Cancer Institute’s State and Community Tobacco Control Research Initiative. ASPiRE is a consortium of the Center for Public Health Systems Science (CPHSS) at Washington University in St. Louis, MO; the Stanford
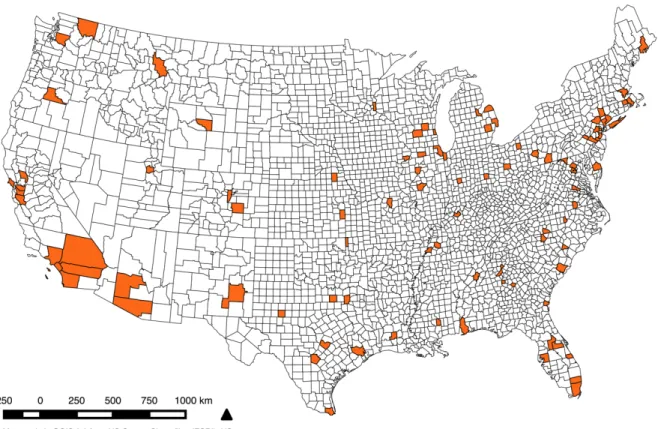
Chromy.144 This resulted in 97 unique counties (Figure 1) in which 26% of the U.S. population (79 million people) resides.145
Figure 3. Counties included in sampling frame, n=97.
Data cleaning removed stores without addresses, removed punctuation and spaces, removed suite numbers, replaced PO boxes, and removed non-street address (e.g., airport) stores. The cleaning process eliminated discount department stores other than Walmart, separate stores within Walmarts (e.g., Walmart Bakery), retained only the top 50 pharmacy chains, and removed stores known to not sell tobacco (e.g., ABC stores, Aldi, Trader Joe’s, Whole Foods). This was conducted separately for NAICS Association and ReferenceUSA lists. Lists were then merged by zip code and address and de-duplicated.
A national review of food stores found that commercial lists like those used in this study are a viable data source for large-scale studies146 and the use of these commercial databases has been validated using ground truthing in a state without tobacco retail licensing.147 Previous research has also validated the use of commercial lists to measure tobacco retailer density, finding that commercial lists did not show disproportionate under- or over-reporting of state-licensed tobacco retailers by area demographics in Washington.65 Data Sources: Same-Sex Couples
Census 2010 that caused misclassification of sex in door-to-door data collection by census workers, thereby causing some estimates of same-sex couples to exceed the total possible number.149,150 To correct for this error, we applied a state-level error-rate correction developed and recommended by Gates.151
Data Sources: Census Tract Characteristics
Census tract demographic variables on race/ethnicity and total population were available from Census 2010.152 We used the Census Bureau’s American Community Survey (ACS), 5-Year Estimates, 2008–2012, for income.153 ACS data were unavailable for eight census tracts.
Measures
Following earlier research,53,59,61,63,64 we conducted all analyses at the census tract level. Census tracts represent the best available area unit to reflect neighborhood processes for our purposes, having been designed to define homogenous community areas154 and provide a large enough population to also analyze small subgroups (i.e., same-sex couples). Measure definitions are reported in Table 1 by their role as dependent variable, independent variables, and explanatory variables. Percentages were divided by ten (e.g., 12% = 1.2) for scaling purposes.
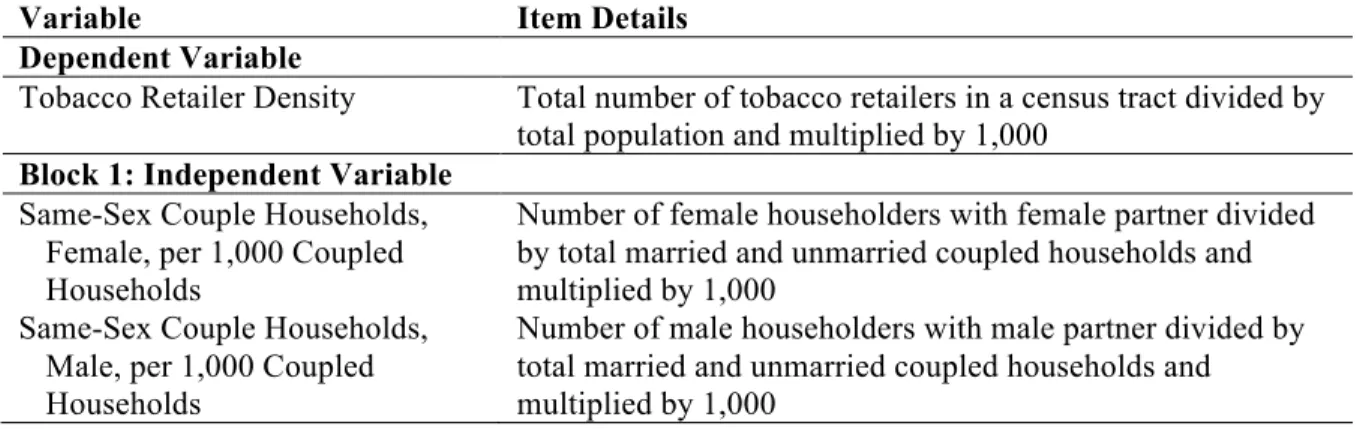
Table 1. Key Measures and Definitions
Variable Item Details
Dependent Variable
Tobacco Retailer Density Total number of tobacco retailers in a census tract divided by total population and multiplied by 1,000
Block 1: Independent Variable Same-Sex Couple Households,
Female, per 1,000 Coupled Households
Number of female householders with female partner divided by total married and unmarried coupled households and multiplied by 1,000
Same-Sex Couple Households, Male, per 1,000 Coupled
Block 2: Explanatory Variables Percentage African-American
Population in 10-point increments
Percentage of the total population reporting Black or African-American race alone or in combination with another race divided by ten
Percentage Hispanic Ethnicity in 10-point increments
Percentage of the total population reporting Hispanic or Latino origin divided by ten
Median Annual Household Income, Adjusted to 2012 USD
Median household income in the past 12 months, in 2011 inflation-adjusted dollars divided by 1,000
Block 3: Explanatory Variables
Presence of Interstate Highway Dichotomous (0 = No, 1 = Yes)
Rurality County-level ordinal U.S. Department of Agriculture Urban-Rural Continuum Codes (range 1 - 9, from most to least urban)
Tobacco retailer density was computed as the number of tobacco retailers divided by 1,000 population in a given census tract. Because of non-normality in the distribution of tobacco retailer density (skew: 7.9, p=0.02; kurtosis: 139.3, p=0.04), we tested various transformations with an offset of 0.3 to see which transformation’s Pearson correlation with same-sex couple rates best approximated a non-parametric correlation coefficient between the female and male same-sex couple household rates with tobacco retailer density,
respectively, rs(n=17,675) = 0.09 (p<0.001) and 0.14 (p<0.001). Of these, a square-root
transformation provided the best option (skew: 1.8, p=0.02; kurtosis: 9.5, p=0.04). We then ran analyses using both transformed and untransformed dependent variables. Because patterns of significance and direction were not sensitive to the transformation, we used Loomis and colleagues' method—we left our dependent variable untransformed so as to facilitate interpretation.63
There are multiple ways to calculate the density of same-sex couples, and they are very highly correlated.128 We choose to follow an approach used by Walther et al.131 that calculates a same-sex couple rate per 1,000 coupled households, shown for male couples:
! #!!"#$!!"#$!!"#!!"#$%&!!"#$%!!"#$
Data from an earlier study155 showed that particularly in suburban and rural areas retailers clustered at exits along interstate highways. Thus we created a dichotomous measure of presence of an interstate highway within a tract.156 We used the U.S. Department of Agriculture’s (USDA) 2013 Rural-Urban Continuum Codes for county urbanicity.157 Data management was conducted in SPSS v. 22 (IBM, Chicago, Illinois) and QGIS v. 2.2
(www.qgis.org). Data analysis was conducted with GeoDa v. 1.6.0 (Arizona State University, Tempe, Arizona).
Analysis Strategy
Because some census tracts are not residential or have very few people, rates of demographic characteristics can be unstable. We thus excluded census tracts with fewer than 250 households (n=266 tracts) and retained 17,675 tracts (or 98.5% of the original sample). We then excluded eight tracts for which no economic data were available. All model results are reported using n=17,667 tracts.
Given gendered differences in spatial patterns of same-sex couple migration, we stratified all analyses by sex of same-sex couple. When statistically modeling phenomena with a spatial component, key tenets of linear regression are violated by non-independence of observations based on shared characteristics due to their proximity.158 We identified spatial clustering of the dependent variable (Moran’s I = 0.10, p = 0.001). Indeed, ordinary least squares regression residuals showed significant spatial clustering (Female: Moran’s I = 0.08, p = 0.001; Male: Moran’s I = 0.07, p = 0.001). Therefore, we used spatial regression models
the influence of the dependent variable in one location on nearby locations. Spatial error models address the influence of omitted independent variables over space. Past tobacco retailer density analyses have used a spatial lag approach.61,63 Lagrange Multiplier Tests indicated the spatial error model was more appropriate for our data. We set all critical values at α=0.05 and used two-tailed tests. Finally, we graphically displayed results using a dot and 95% confident interval plot, using Jenks natural breaks in the data.159
Modeling Approach
We selected variables for model building based on the existing literature of tobacco retailer density and same-sex couple demography discussed previously. We approached modeling in three blocks, stratifying by sex. First, we entered the same-sex couple household rates, defined as same-sex coupled households per 1,000 coupled households. We then added tract-level characteristics for income and racial/ethnic composition. Last, we added variables for the presence of interstates and rurality, as indicated by USDA Rural-Urban Continuum Codes (see Table 1). We compared models using changes in R2 and likelihood ratio tests. Last, we conducted sensitivity analyses for edge effects (i.e., a boundary problem in spatial analysis), where the lack of data on neighboring units at the borders of the area under study can influence results.160
Because there were no human subjects, the UNC Office of Human Research Ethics exempted this research from further review (#13-2602).
Results Same-Sex Couples and Tobacco Retailer Density
households per 1,000 coupled households was 6.66 for same-sex female couples (range 0 to 68.74, sd=5.96, median=5.21) and 10.07 for same-sex male couples (range 0 to 562.35, sd=23.77, median=3.26).
Results from spatial regression show that higher rates of both female and male same-sex couples were associated with a higher density of tobacco retailers (Table 2). However, the magnitude of this association was small: For each additional same-sex household per 1,000 households, the number of tobacco retailers per 1,000 people increased by 1/100. For both sexes, the first model explained only 6% of variance. Figure 2 illustrates the bivariate relationship in natural breaks of same-sex couple rates.
Table 2. Same-Sex Couple Household Rate Predicting Tobacco Retailer Density
(Same-sex coupled households per 1,000 coupled households and tobacco retailer density per 1,000 population in census tracts (n=17,667), 97 counties, U.S.A., respectively, stratified by sex of couple.)
Female Male
Model Variable Estimate SE p Estimate SE p 1 Constant 1.18 0.03 <0.001 1.17 0.02 <0.001
Same-sex couple rate 0.01 <0.01 <0.001 0.01 <0.01 <0.001 Lag coefficient, Lambda 0.44 0.02 <0.001 0.40 0.02 <0.001 Overall model R2 = 0.06; AIC = 64849 R2 = 0.06; AIC = 64714
2 Constant 1.83 0.06 <0.001 1.71 0.05 <0.001 Same-sex couple rate <0.01 <0.01 0.19 0.01 <0.01 <0.001 % Black race (10 points) <0.01 0.01 0.82 0.01 0.01 0.35 % Hispanic ethnicity (10
points)
-0.04 0.01 <0.001 -0.03 0.01 <0.001 Median household
income (1000s)
-0.01 <0.01 <0.001 -0.01 <0.01 <0.001 Lag coefficient, Lambda 0.43 0.02 <0.001 0.39 0.02 <0.001 Overall model R2 = 0.07; AIC = 64613 R2 = 0.08; AIC = 64448 3 Constant 1.73 0.08 <0.001 1.57 0.07 <0.001
Same-sex couple rate <0.01 <0.01 0.15 0.01 <0.01 <0.001 % Black race (10s) <0.01 0.01 0.83 0.01 0.01 0.30 % Hispanic ethnicity
(10s)
Presence of interstate highway
0.26 0.03 <0.001 0.27 0.03 <0.001 Rurality level 0.01 0.04 0.70 0.04 0.03 0.22 Lag coefficient, Lambda 0.43 0.02 <0.001 0.38 0.02 <0.001 Overall model R2 = 0.08; AIC = 64483 R2 = 0.08; AIC = 64348
Note: Using a row-standardized second-order (including lower orders) queen weights matrix and a spatial error model. AIC = Akaike information criterion, SE = standard error
We examined whether including area-level demographic characteristics of race, ethnicity, and income explained the bivariate association in Model 1. For female same-sex couples, the addition of other neighborhood indicators explained the relationship between same-sex couple households and tobacco retailer density. For male same-sex couples, however, a significant positive association of same-sex households and tobacco retailer density was independent of other neighborhood demographics.
A third block of variables looked at whether physical area–level characteristics would offer additional explanation of this association. Thus, in this third model, we included
variables for the presence of an interstate and rurality level. These did not fully explain the relationship between male same-sex couples and tobacco retailer density but did offer significant improvements in both models.
Sensitivity Analysis
To assess the sensitivity of our findings to edge effects, which can influence results in spatial analysis,160 we re-ran all analyses in a subset of 15,085 tracts after removing all census tracts at the edges of counties. Our findings were sensitive to the removal of edge tracts. For female same-sex couples excluding edge tracts, there was a negative association with tobacco retailer density, which is in the opposite direction of our main findings. Estimates became more pronounced: -0.05 in Model 1 and -0.07 in Models 2 and 3.
Significance was maintained between female same-sex couples and tobacco retailer density in each model (p<0.01). For men, estimates were similar for each model (0.01), but control for tract demographics and physical characteristics resulted in a marginally significant relationship between male same-sex couple rate and tobacco retailer density in Models 2 (p=0.07) and 3 (p=0.08). Thus, our findings for female same-sex couples show substantive differences when edge tracts are removed while the removal of edge tracts has less influence on our findings for male same-sex couples.
Further examination revealed quantitative differences in edge vs. non-edge tracts, all p<0.01: Edge tracts have fewer African American residents (M=11% vs. 15%), fewer
Hispanic residents (M=15% vs. 29%), higher median income ($74,379 vs. $63,489), lower population density per square mile (M=4,737 vs. 8,895), and a lower same-sex couple
patterns of residential segregation. Future research using areas with fewer edges (e.g., an entire state instead of a sample of non-contiguous counties) is indicated.
Discussion Principal Findings
Same-sex couples tend to live in neighborhoods where tobacco retailer density is greater, and for male same-sex couples this association persists even after adjustments for neighborhood income, race/ethnicity, and other correlates of higher retailer density. An increase of 100 same-sex couple households in the rate of same-sex households was associated with an additional tobacco retailer for every 1,000 residents in census tracts. Although the association between the density of same-sex households and tobacco retailers was relatively small, such findings matter to our understanding of population-level influences on health.162 This study is the first to suggest a role for neighborhoods in understanding the etiology of LGB tobacco-related health disparities.
That the relationship between same-sex couples and tobacco retailer density can be explained by area demographics for female same-sex couples but not for male same-sex couples suggests differences by sex in the mechanisms by which same-sex couple households come to be associated with tobacco retailer density. Two processes may be involved in this. First, retailer density can be explained by theories of organizational ecology,163 which consider available resources to promote the founding, evolution, and closing of retail locations. Neighborhood resources for retailers may be influenced by historical
for other reasons, have more tobacco retailer density. Mechanisms could include differences in childrearing (less for male couples)165 and interest in school quality; in perceived safety of neighborhoods, which may differ by gender,166 although some studies find no differences for lesbian women and gay men;167 and in income (lower for women).168 There is evidence that LGB people are subject to wage and hiring discrimination, the latter of which may differ by state.129,130,169 Same-sex couples are not as wealthy as the popular imagination holds.170 Lesbian couples are also affected by gender-based inequity in pay compared to heterosexual couples and gay male couples.168
Early research on gay neighborhoods described a process of territorialization, rooted in masculine behavior and need to create gay [male] space.114 Others describe a process by which gay male neighborhoods were created out of red light districts.109,115 In qualitative research, these patterns of neighborhood formation do not parallel the formation of lesbian neighborhoods.106,124-126 Alternatively, declining residential segregation for same-sex
couples133 and rural and suburban neighborhood selection108,120,123 as well as the feasibility of returning to communities of origin with growing social acceptance111 could be different by gender and result differences in our models. Regardless of the different mechanisms, our findings show both the rate of male and female same-sex couples are associated with greater tobacco retailer density.
city occupies the center of the tract and many edge tracts are larger and suburban in nature. Future research should explore this more fully.
Strengths and Weaknesses of the Study
There are several strengths and limitations to this research. We selected an area unit we viewed to be most conceptually appropriate for neighborhoods and selected variables for model building a priori based on the existing literature. The statistical approach explicitly modeled spatial dependence. We note two important limitations: First, census data only provide information on same-sex couples; were data on individual sexual orientation available they might provide different results. Although the census undercounts some racial/ethnic minorities,171 census data represent a high-quality data source. Second, there is no national licensing of tobacco retailers. Although we used a unique, high-quality list of tobacco retailers that has been validated in similar studies,65,147 there is an unknown amount of error in identifying current tobacco retailers. Additionally, we did not have information on retailer type.
Future research should examine (1) activity space as an area unit172 because we did not have data on individual households, (2) the potential role of edge effects because we were unable to rule them out, (3) the role of tobacco retailer policy interventions on density for neighborhoods with more same-sex couples, and (4) changes in gay and lesbian
neighborhoods133,173 in relation to tobacco retailer density. Conclusion
CHAPTER 3: RELATIONSHIP BETWEEN RETAILERS’ POINT-OF-SALE TOBACCO MARKETING AND RATE OF SAME-SEX COUPLES IN CENSUS
TRACTS Introduction
Lesbian, gay, and bisexual (LGB) people are at much higher risk of tobacco use than their straight counterparts.10 In addition to more than 50% higher smoking prevalence than for straight people,134 LGB people are more likely to smoke menthol brands, flavored little cigars, filtered little cigars, and use e-cigarettes than heterosexual people.134,178-180 Data for transgender populations are scarce,12 although similar disparities likely exist.181 The reasons
for these disparities are only partially known, and research has focused primarily on the role of discrimination, stigma, and stress.15 Researchers have also suggested that the role of LGB bars as safe community spaces may promote tobacco use,17,18 that the media environment may contribute as tobacco use is normative in the LGB print press and in LGBT-themed movies,19-21 and that tobacco industry marketing targeted directly at LGB communities
contributes to disparities.23,24,136
In one of the tobacco industry’s plans to market to gay men titled Project Sub-Culture Urban Market (SCUM), RJ Reynolds Tobacco Co. planned to make its products and their marketing ubiquitous in a neighborhood considered to be a gay enclave, San Francisco’s Castro.23,27 Project SCUM called for better “in store presence,” better “store front presence,”
one of the clearest examples of tobacco industry targeted marketing to LGB people,
Reynolds sought to make its marketing ubiquitous in tobacco retailers in a gay neighborhood. In studies of the etiology of LGB health disparities in tobacco,15 neighborhood-level marketing to LGB people has been largely ignored although some research has examined political and social environments at the county level and school level in relation to LGB youth smoking.182 Yet there is emerging demographic evidence that internal migration of LGB people within the United States results in the concentration of same-sex couples§§ in certain types of neighborhoods, in regional cities, and in places where there are already more same-sex couples.28,29,133 These patterns are more complex than the common view of
migration of LGB people to major cities,30 potentially reveal decision-making regarding migration that is informed by sexual orientation identity,111,121 and indicate that LGB people have, as a population, unique spatial patterning.28,29,132,133 If LGB people live in places where there is disproportionate exposure to tobacco industry marketing, exposure to this marketing could partially explain the presence of large disparities in tobacco use for LGB populations compared to heterosexual populations because such marketing can stymie quit attempts. Indeed, demographic research suggests that same-sex couples often live in lower income and more diverse neighborhoods,29 especially male same-sex couples.132 Tobacco industry marketing is frequently found at greater volume at retailers in poorer and less white neighborhoods.76,83,87,183,184 Neighborhoods with more black residents have more menthol marketing,80,81,185 lower menthol prices,80 and more little cigar marketing.186 E-cigarettes are more available in higher-income neighborhoods and neighborhoods with more white
residents.187 Thus, same-sex couples are, as a population, more likely to live in a more
racially/ethnically diverse neighborhood with lower income; these neighborhoods are likely to have disproportionate tobacco market due to industry targeting of African American neighborhoods and lower-income neighborhoods.87
Tobacco marketing at the POS is part of a broader marketing effort that is causally related to smoking behaviors.31,32 Both a National Cancer Institute monograph and the Surgeon General report highlight the importance of POS marketing to tobacco prevention and control.31,38 The tobacco industry spends the majority (85%) of its reported marketing dollars at the POS in the United States.33,34 Two systematic reviews have synthesized the evidence of the impact of POS marketing on tobacco-related health behaviors, suggesting sufficient evidence for policy intervention.37,188 Because tobacco use starts during
adolescence,31 POS tobacco marketing is relevant to our understanding of LGB tobacco use disparities through its role in stymieing quit attempts. Greater volume of tobacco marketing at retailers in neighborhoods with more same-sex couples could delay quit attempts or make them more likely to fail.37,43,74,75,139,188,189
We aimed to examine the association between census tracts’ rate of same-sex couple
households and tobacco retailers’ marketing. Because this is the first study to explore the rate
of same-sex couples in neighborhoods in relation to retailers’ POS marketing, our hypotheses
are driven by two competing approaches. First, same-sex couples tend to live in more diverse
neighborhoods,29 which are the same neighborhoods that are more likely to be targeted by the
tobacco industry.81,83,87 These neighborhoods have smaller, non-chain stores with more
marketing.77,78,190 Second, same-sex couples have been associated with neighborhood
gentrification115,116 and rising home prices,118 which are associated with less POS tobacco
of demographic evidence29 but recognizing that this study is the first to investigate this
relationship.
Given the LGB tobacco disparities that exist (higher smoking prevalence, higher menthol use, and higher use of flavored little cigars) we hypothesized store marketing characteristics that would contribute to those disparities in hypotheses 1–7. We then hypothesized the likelihood of stores’ sale of e-cigarettes based on evidence that same-sex couples live in more diverse neighborhoods.187 The rate of same-sex couple households in census tracts is:
H1–2: Positively associated with the presence of (H1) promotional offers and
(H2) Newport-specific (i.e., menthol) promotional offers.
H3: Not associated with the advertised price of Marlboro Red cigarettes at tobacco retailers.
H4: Negatively associated with the price of Newport-brand mentholated cigarettes at tobacco retailers.
H5–6: Positively associated with numbers of (H5) total marketing materials
and (H6) total number of exterior marketing materials.
H7–8: Positively associated with (H7) the likelihood of the sale of flavored
cigars and (H8) negatively associated with the likelihood of the sale of
e-cigarettes.
Methods Selection of Counties
This study is part of a nationally representative study of point-of-sale (POS) tobacco
counties with replacement and with probability proportionate to population size using a
Chromy144 technique in SAS 9.2 with minimal replacement. This resulted in 100 counties (97
unique) where approximately one-quarter of the U.S. population lives.145
Tobacco Retailer Sampling Frame
For the 97 counties, retailer address and phone data were purchased from two sources
in 2012: North American Industry Classification System (NAICS) Association and
ReferenceUSA. We requested lists of stores with primary and/or secondary classification as
one of the following: supermarkets and other grocery (except convenience) stores;
convenience stores; tobacco stores; gasoline stations with convenience stores; warehouse
clubs and supercenters; news dealers and newsstands; beer, wine, and liquor stores;
pharmacies and drug stores; discount department stores; and other gasoline stations. Codes
were selected for store types most likely to sell tobacco.
Data cleaning was conducted using a cleaning protocol that removed stores with no
addresses, removed punctuation and spaces, removed suite numbers, replaced PO boxes, and
removed non-street address (e.g., airport stores). The cleaning process included eliminating
discount department stores other than Walmart, removing separate stores within Walmarts
(e.g., Walmart Bakery), retaining only the top 50 pharmacy chains, and removing stores
known to not sell tobacco (e.g., state-owned liquor stores, Aldi, Trader Joe’s, Whole Foods).
This was conducted separately for NAICS Association and ReferenceUSA lists. Lists were
then merged by zip code and address and manually de-duplicated.
As part of data cleaning for in-person data collection regarding marketing at the
point-of-sale, up to 55 randomly selected stores per county from the cleaned sampling frame