RESIDENTIAL MERCURY CONTAMINATION AND EXPOSURE IN HUANCAVELICA, PERU
Nicole A. Hagan
A dissertation submitted to the faculty at the University of North Carolina at Chapel Hill in partial fulfillment of the requirements for the degree of Doctor of Philosophy in the Department
of Environmental Sciences and Engineering in the Gillings School of Global Public Health.
Chapel Hill 2014
iii ABSTRACT
Nicole A. Hagan: Residential Mercury Contamination and Exposure in Huancavelica, Peru (Under the direction of J. Jason West)
Between 1564 and 1810, nearly 17,000 metric tons of mercury (Hg) vapor were released to the environment during cinnabar refining in the small town of Huancavelica, Peru. Much of this vapor deposited locally. The present study investigated the extent of residential Hg exposure today due to historic Hg contamination by: (1) determining total Hg concentrations in adobe bricks, dirt floors, surface dust, and air in 60 residences and comparing these concentrations across four different neighborhoods; (2) characterizing the species and bioaccessibility of Hg present in residences and evaluating potential exposure risks against international health benchmarks, and (3) characterizing and evaluating personal Hg exposures using total Hg concentrations in hair, total and speciated Hg measurements in residential samples, and self-reported questionnaire data.
Concentrations of total Hg in adobe bricks, dirt floors, and surface dust ranged from 8.00 to 1070 µg/g, 3.06 to 926 µg/g, and 0.02 to 9.69 µg/wipe, respectively, with significant
differences across the four neighborhoods. A strong correlation between total Hg concentrations in adobe bricks and dirt floors confirmed that the bricks were likely made on-site.
iv
exceed health benchmarks for soluble Hg. The apparent public health threat is much lower when standards are compared against the soluble Hg present, rather than against total Hg.
Total Hg concentrations in hair ranged from 0.10 to 3.6 µg/g, similar to concentrations found in the U.S. and lower than concentrations in other Hg-exposed populations around the world. Total Hg concentrations in hair were significantly related to gender (p<0.001), living in a neighborhood where smelters were previously located (p=0.021), smoking status (p=0.003), frequency of house cleaning (p=0.019), and frequency of fish consumption (p=0.046).
v
vi
ACKNOWLEDGEMENTS
I would like to express my sincerest gratitude to those who have provided guidance, assistance, and support throughout my dissertation research. I would like to thank David Leith for his continued encouragement and assistance throughout this process. Your dedication and commitment to my education and success have been imperative in my development as an individual research scientist.
I would like to offer my appreciation for my committee members: David Leith, Jason West, Steve Wing, Rose Cory, John Vandenberg, and Nicholas Robins. You have all challenged me to think critically about my research questions and the importance of the results to the broader scientific community.
To my Baity family – Dave, Maryanne Boundy, Joe Pedit, Maiko Arashiro, Jenia Tufts, and Robert Bush – what would I have done without you? From assistance with day-to-day lab questions and procedures to the comradery and support, I would have never made it without you.
I would like to thank Heileen Hsu-Kim, Susan Halabi, Daniel Richter, Ruben Dario Espinoza Gonzales, and Enrique Ecos for continued support and guidance throughout this research.
vii
Funding support for this research was provided by a pilot grant from the Duke Global Health Institute, an Oak Ridge Institute Science and Education fellowship at the U.S. EPA National Center for Environmental Assessment, Office of Research and Development, and the EPA/UNC Toxicology Training Agreement CR-83515201-0, with the Curriculum in
Toxicology, University of North Carolina at Chapel Hill.
viii
TABLE OF CONTENTS
LIST OF TABLES ... xiii
LIST OF FIGURES ... xiv
CHAPTER 1. INTRODUCTION ... 1
1.1 Common chemical forms of mercury ... 1
1.2 Mercury in the environment ... 2
1.2.1 Mercury in the atmosphere ... 3
1.2.2 Mercury in soil... 5
1.3 History of cinnabar mining ... 6
1.4 Mercury contamination in Huancavelica ... 7
1.5 Health effects of mercury ... 9
1.6 Motivation ... 10
1.7 Objectives ... 11
ix
CHAPTER 2. RESIDENTIAL MERCURY CONTAMINATION IN ADOBE
BRICK HOMES IN HUANCAVELICA, PERU ... 19
2.1 Introduction ... 19
2.2 Methods ... 21
2.2.1 Sample collection ... 22
2.2.2 Sample preparation and Hg analysis ... 24
2.2.3 Statistical analysis... 24
2.3 Results ... 25
2.3.1 Total Hg in adobe bricks, dirt floors, and surface dust ... 25
2.3.2 Elemental Hg vapor in indoor air ... 27
2.4 Discussion ... 27
2.4.1 Differences in total Hg in adobe bricks, dirt floors, and surface dust between neighborhoods ... 27
2.4.2 Relationships between total Hg in adobe bricks, dirt floors, and surface dust ... 28
2.4.3 Differences in elemental Hg vapor between neighborhoods ... 31
2.4.4 Implications for potential health effects from exposure ... 32
2.5 Conclusions ... 33
x
CHAPTER 3. MERCURY SPECIATION AND BIOACCESSIBILITY FROM
ADOBE BRICKS AND DIRT FLOORS IN HUANCAVELICA, PERU ... 38
3.1 Introduction ... 38
3.2 Materials and Methods ... 40
3.2.1 Study area ... 40
3.2.2 Sample collection ... 40
3.2.3 Analytical methods ... 41
3.2.4 Statistical methods ... 42
3.3 Results ... 43
3.3.1 Recovery of Hg in SSEs and GI extractions... 43
3.3.2 Comparisons between extraction methods ... 45
3.3.3 Comparisons between adobe brick and dirt floor samples ... 46
3.4 Discussion ... 46
3.4.1 Comparisons between extraction methods ... 46
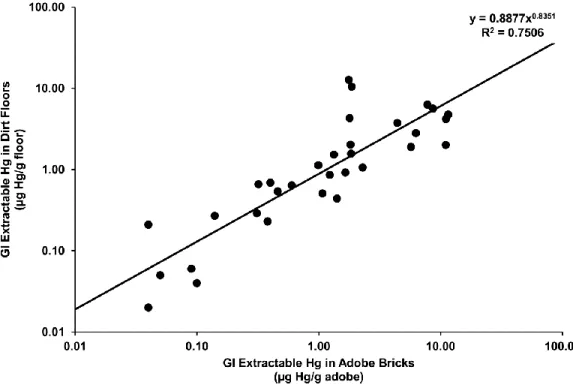
3.4.2 Relationship between sample types ... 48
3.4.3 Implications for risks from soil ingestion ... 49
3.5 Conclusions ... 53
xi
CHAPTER 4. MERCURY HAIR LEVELS AND FACTORS THAT INFLUENCE
EXPOSURE FOR RESIDENTS OF HUANCAVELICA, PERU ... 58
4.1 Introduction ... 58
4.2 Methods ... 59
4.2.1 Residential samples ... 59
4.2.2 Hair samples and questionnaire data ... 60
4.2.3 Statistical analyses ... 60
4.3 Results ... 61
4.3.1 Correlations between Hg in hair and Hg in residential samples ... 61
4.3.2 Relationships between Hg in hair and other factors ... 62
4.4 Discussion ... 65
4.4.1 Relationship between Hg in hair and Hg in residential samples ... 65
4.4.2 Relationships between Hg in hair and other factors ... 65
4.4.3 Comparison of total Hg concentrations in hair in Huancavelica and elsewhere ... 67
4.4.4 Limitations of the present study ... 68
4.5 Conclusions ... 70
REFERENCES ... 71
xii
5.1 Scientific findings ... 73
5.2 Future research questions ... 74
5.3 Implications for intervention and remediation ... 75
REFERENCES ... 79
xiii
LIST OF TABLES
Table 2-1. Pearson correlation coefficients, sample size, and p-value for log-transformed total Hg concentrations in adobe bricks, dirt floors, and surface dust by neighborhood ... 30
Table 3-1. Current health benchmarks for oral exposure to inorganic Hg ... 39
Table 3-2. Extractable Hg in adobe bricks and dirt floors expressed on a mass basis (µg/g) and as a percentage of total Hg (%) from residences in
Huancavelica, Peru ... 44
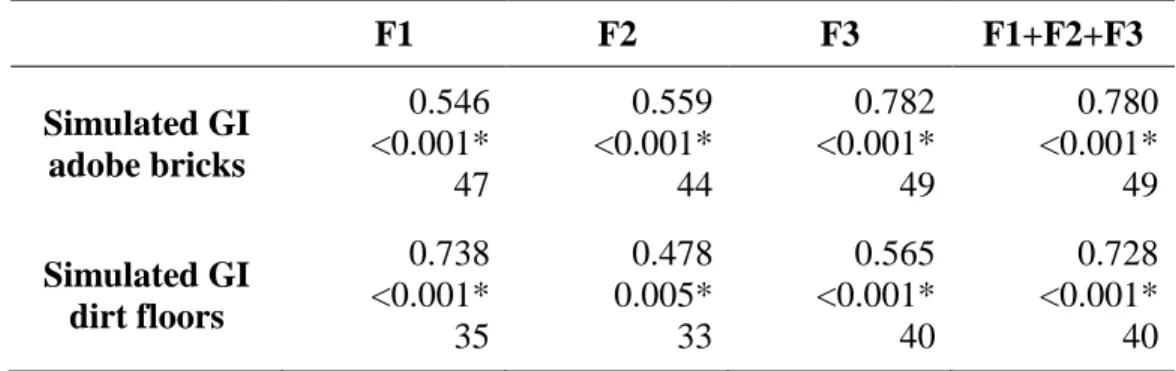
Table 3-3. Pearson correlation coefficients, p-values, and sample sizes for log-transformed mass of extractable Hg in adobe bricks and dirt floors ... 45
Table 3-4. Level of soil contamination (LSC) that may result in health
benchmark value exceedance for a 10 kg child with varying ingestion rates ... 51
Table 4-1. Pearson correlation coefficients (r), p-values (p), and sample sizes (n) for log-transformed mass of total Hg in hair and log-transformed mass of total Hg in residential samples ... 62
Table 4-2. Concentrations of total Hg in hair for populations with different
exposures... 69
xiv
LIST OF FIGURES
Figure 1-1. Global mercury cycle (Source: adapted from US EPA 1997) ... 2
Figure 2-1. Map of historic smelter locations and neighborhoods sampled in 2010 in Huancavelica, Peru ... 22
Figure 2-2. Total Hg concentrations in adobe bricks and dirt floors by
neighborhood ... 26
Figure 2-3. Total Hg concentrations in surface dust by neighborhood ... 26
Figure 2-4. Elemental Hg vapor concentrations in indoor air by neighborhood ... 27
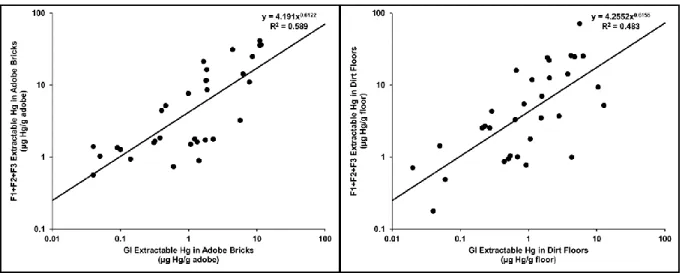
Figure 3-1. Least squares regression for mass of F1+F2+F3 extractable Hg (µg/g) versus simulated GI extractable Hg (µg/g) ... 47
Figure 3-2. Least squares regression for mass of Hg (µg/g) from simulated GI extractions in adobe bricks and dirt floors ... 49
Figure 3-3. Least squares regression for mass of Hg (µg/g) from simulated GI extractions in adobe bricks and dirt floors with Level of Soil Contamination (LSCs) for EPA Reference Dose (RfD) ... 52
Figure 4-1. Total Hg concentrations in hair based on gender (n=116) ... 62
Figure 4-2. Total Hg concentrations in hair based on living in a neighborhood with historical cinnabar smelter activity (n=117) ... 63
Figure 4-3. Total Hg concentrations in hair based on smoking status (n=117) ... 63
Figure 4-4. Total Hg concentrations in hair based on frequency of house cleaning (n=109) ... 64
Figure 4-5. Total Hg concentrations in hair based on frequency of fish
1
CHAPTER 1. INTRODUCTION
This research presents results of a study that investigated residential mercury
contamination and exposure in the city of Huancavelica, Peru. Mercury (Hg) exists in varying chemical forms and is present in all compartments of the environment. Cinnabar, or mercury sulfide (HgS), has historically been mined and refined into liquid Hg, resulting in contamination at these sites around the world. Residents of Huancavelica are exposed to Hg as a result of past cinnabar refining not only from the ambient environment, but also from building adobe brick houses using Hg-contaminated soil. Exposure to Hg from inhalation and ingestion may lead to adverse health outcomes, including neurological and renal effects.
1.1 Common chemical forms of mercury
In the environment mercury (Hg) exists in chemical and physical forms whose properties and chemical behaviors depend strongly on its oxidation state. These three primary oxidation states are elemental (Hg0), mercurous (Hg22+), and mercuric (Hg2+). Elemental Hg exists as a heavy, silvery-white liquid under ambient temperatures and pressures that vaporizes under ambient conditions (Schroeder and Munthe 1998; US EPA 1997).
2
common Hg-containing compounds found in the environment include mercuric salts (i.e., HgCl2, Hg(OH)), cinnabar (HgS), methylmercury compounds (CH3Hg+, CH3HgCH3), methylmercuric chloride (CH3HgCl) and methylmercuric hydroxide (CH3HgOH) (US EPA 1997).
1.2 Mercury in the environment
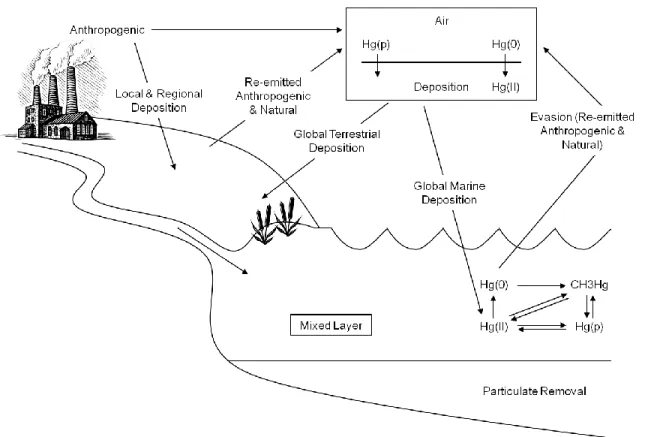
Mercury is a naturally occurring element in the earth’s crust and is the only metal that exists as a liquid at room temperature. Mercury is emitted into the environment from both natural and anthropogenic sources and is cycled between all compartments of the environment, as shown in Figure 1-1. Mercury can be emitted naturally via emissions from oceans and lakes, biomass burnings, volcanic eruptions, and geothermal activity (US EPA 1997). Anthropogenic emissions are often a result of combustion processes, including coal combustion, smelting operations for other metals (e.g., gold, copper, lead, and zinc), cement production, and waste incineration
3
(Pirrone et al. 2010; UNEP 2002, 2008). Mercury is transformed and transported in the air, deposited onto the earth’s surface, and stored in or emitted by soil, water, and air, being continuously cycled in the environment and oxidized and reduced to different species of Hg. 1.2.1 Mercury in the atmosphere
The four basic processes involved in the fate and transport of Hg in the atmosphere include: emission to the atmosphere, transformation and transport in the atmosphere, deposition from the air, and reemission to the atmosphere. Natural emissions occur primarily as the
elemental Hg species. Naturally occurring emissions of Hg are the result of either pre-industrial equilibrium of Hg (e.g., flux from soil) or mobilization of Hg from geologic deposits (e.g., volcanic eruptions). Anthropogenic emissions of Hg include both gaseous and particulate mercury. Gaseous Hg includes elemental and divalent species of Hg, whereas particulate Hg is primarily divalent Hg (US EPA 1997). Present-day global emissions of Hg are estimated at 7527 metric tons per year; approximately 69% of these emissions result from natural sources while 31% are released from anthropogenic sources (Pirrone et al. 2010).
4
the water phase than the air phase. Gaseous and particulate forms of divalent Hg are scavenged by precipitation and washed out via wet deposition. Because of its reactivity and water solubility, the removal of gaseous divalent Hg occurs more readily and effectively than the removal of particulate divalent Hg (Gochfeld 2003; US EPA 1997).
Elemental Hg does not undergo any of the major processes of deposition in the atmosphere because of its high vapor pressure and low water solubility. However, potential removal mechanisms from the atmosphere include plant-leaf uptake and transformations in cloud water. Studies in forest canopies have found that gas exchange at the leaf surface followed by the assimilation of Hg in the interior of the leaf during daylight hours can cause the accumulation of elemental Hg vapor (US EPA 1997). However, this process only occurs if the atmospheric concentration of elemental Hg vapor is greater than the concentration in the local ecosystem. If the concentration of elemental Hg is greater in the ecosystem, the forest canopy acts as a source and releases elemental Hg vapor into the atmosphere (US EPA 1997).
Gaseous elemental Hg can be transformed into divalent Hg (gaseous and particulate forms) in cloud water. This transformation leads to the deposition of divalent Hg onto land and water that can occur far from the original emission source because of the slow uptake of
elemental Hg by the cloud water. In terms of Hg pollution, this mechanism has been suggested to be globally important, whereas local pollution is more often the result of direct wet deposition of anthropogenic divalent Hg (US EPA 1997).
5
(US EPA 1997). Thus, under certain conditions, sinks of atmospheric Hg become sources of atmospheric Hg.
1.2.2 Mercury in soil
Once deposited from the atmosphere onto the earth’s surface, divalent Hg species can undergo many chemical and biological transformations. Soil conditions, including temperature, humic content, and pH, promote the production of inorganic divalent Hg compounds, including HgCl2, Hg(OH)2, and inorganic divalent compounds containing organic anions. In general, inorganic divalent Hg compounds are soluble and mobile. However, in soil, these compounds interact with organic matter, primarily humic and fulvic acids, and mineral colloids and become less soluble and immobile. Most of the Hg present in soil is bound to organic matter and is only released in runoff as a result of being attached to suspended humus or soil present in runoff water. Dissolvable organic ligands and other types of dissolved organic carbon can have Hg absorbed onto their surfaces and in this case, Hg can be released in runoff as the dissolved phase (US EPA 1997).
Although divalent Hg and its compounds account for 97% to 99% of Hg found in soils, elemental Hg and organomercurials can result from reactions in the soil. Elemental Hg can be formed in soil through reduction of divalent species by humic substances and photolysis. Elemental Hg can diffuse through the soil and be reemitted into the atmosphere. In the presence of microbial reactions, methylmercury can form from the transformation of divalent Hg
6
1.3 History of cinnabar mining
Cinnbar (or mercury sulfide, HgS) is a bright red crystalline mineral found throughout the earth’s crust. Cinnabar, also known as vermillion due to its brilliant red color, has historically been used in paints, felting, and medicine by many cultures around the globe. While mined in limited quantities in pre-Colombian times, it was with the introduction of the process of amalgamation for silver ores in the 1550s that cinnabar ore was mined and refined in large quantities (Lane 2012). In the earth’s crust, Hg occurrence is approximately 0.07-0.08 parts per million (Lane 2012) and profitable mining of Hg requires concentrated ore deposits that are typically found as mercury (II) sulfide or cinnabar. Mining and refining of cinnabar and resulting Hg contamination has been best documented at large mines such as Almadén, Spain, and Idrija, Slovenia (Lane 2012).
The Almadén mine was the world’s largest Hg mine and occupies nearly 100 km2 in Central Spain. Before closing in the early 2000s, the Almadén mine produced 285,000 metric tons of Hg over 2000 years, or nearly 30% of the global production (Millán et al. 2006; Molina et al. 2006). However, estimates suggest that up to 25% of the total Hg produced was released into the environment during the refining process as documented by Hg soil contamination near the Almadén mine (Conde Bueno et al. 2009; Higueras et al. 2006; Llanos et al. 2011; Millán et al. 2006). Studies of the Almadén soil have shown Hg concentrations that range from 0.13 μg/g to nearly 8900 μg/g (Bernaus et al. 2005; Conde Bueno et al. 2009; Higueras et al. 2006; Millán et
al. 2006; Molina et al. 2006).
7
et al. 2004). Environmental releases of Hg routinely occurred with an estimated 33,000 metric tons of Hg lost during the refining process (Gosar et al. 1997). Recent studies of Hg
concentrations in the soils of Idrija have ranged from 0.39 μg/g to nearly 2800 μg/g (Gnamuš et al. 2000; Kocman et al. 2004; Palinkaš et al. 1995).
The Santa Barbara mine near Huancavelica, Peru, was the largest Hg deposit in the New World and the fourth largest globally. Prior to 1532 the Incas mined the area on a limited basis (Cooke et al. 2009; Wise and Féraud 2005), but the rediscovery of cinnabar ore by Spanish colonists in 1564 initiated large scale mining and refining operations in the nearby city of Huancavelica (Robins 2011; Wise and Féraud 2005).
The refining operations in Huancavelica differed from those in Almadén and Idrija in that the residents of the densely populated town of Huancavelica lived and worked within the
shadows of the cinnabar smelters (Robins 2011; Robins and Hagan 2012). Researchers have estimated that 68,000 metric tons of Hg were produced in Huancavelica during the 246 year Spanish colonial period (Robins 2011; Robins et al. 2012). Although legacy soil contamination from historic cinnabar refining has been studied in great detail in Almadén and Idrija,
environmental studies in Huancavelica were not undertaken until 2009.
1.4 Mercury contamination in Huancavelica
Mercury refining in Huancavelica involved the extraction and crushing of cinnabar ore, followed by a smelting process in which the Hg was volatilized and collected. The liquid
8
produced, large quantities of liquid Hg were needed (Bakewell 1975; Hagan et al. 2011; Robins and Hagan 2012).
Problems developed in Huancavelica because the crushing operations were dusty, and the Hg vapor and liquid routinely escaped from the inefficient smelters. Colonial records of Hg production in Huancavelica, adjusted for contraband (or unreported production), report that approximately 68,000 metric tons of Hg were produced between 1564 and 1810 (Arena 1901; Brown 1988; Caravantes 1989; Fisher 1977; Lohmann Villena 1999; Patiño Paúl Ortíz 2001; Whitaker 1941) and Hg vapor emissions from this period were estimated at 17,000 metric tons (Robins 2011; Robins and Hagan 2012; Robins et al. 2012). The majority of the vaporous and liquid Hg likely deposited in the vicinity of the smelters, ultimately contaminating the entire community of Huancavelica.
This legacy continues to haunt the present 42,000 residents of Huancavelica who are faced with living with over 400 years of Hg contaminated soil (Robins 2011; Robins et al. 2012.) Many of these residents are impoverished and not aware of the high levels of Hg contamination throughout the city; those who are informed lack the resources to alleviate the problem. Results of a recent study of ambient soils from 20 locations in Huancavelica showed that Hg
9
and surfaces can cause serious neurological and other health problems, especially for children and pregnant women.
1.5 Health effects of mercury
As with all compounds, the chemical species, exposure route, and exposure duration are important in determining health effects of Hg. Regulatory efforts to reduce health impacts of Hg in the United States have generally focused on controlling elemental Hg vapor emissions, particularly from power plants and other industrial processes. However, all species of Hg pose a human health risk, with organomercurials thought to be the most toxic species, particularly from consumption of contaminated fish (Revis et al. 1990). Methylmercury (CH3Hg+) toxicity has been studied in great detail due to exposures (mainly through dietary consumption of seafood and shellfish) across large segments of the population (NRC 2000). However, in the
contaminated residential setting of Huancavelica, inhalation of vapor and ingestion of particulates are the major pathways of Hg exposure for residents.
Following the inhalation of elemental Hg (Hg0) vapor, up to 80% of inhaled elemental mercury is absorbed by the lungs and rapidly distributed throughout the body (Environment Agency 2009). Once absorbed into the bloodstream, elemental Hg is oxidized in the red blood cells to divalent Hg, a largely non-diffusible form of Hg that binds to globular proteins including albumin and globulins (Environment Agency 2009; Klaassen et al. 2008). Molecules of
10
feces, although sweat, saliva, and expired air may also excrete some of the Hg (Environment Agency 2009; Klaassen et al. 2008).
Inorganic divalent Hg (Hg2+), often found in abundance in soils, can be ingested, absorbed through the gastrointestinal tract, and distributed to all tissues. Absorption can vary depending on the type of Hg2+ mineral phase ingested. Studies have shown that 100% of mercuric chloride can be absorbed by the gastrointestinal tract (Welfringer and Zagury 2009), while absorption of up to 20% has been reported for other forms of Hg2+ (EPA 1997; Klaassen et al. 2008). The most critical toxicological endpoint for ingestion of inorganic Hg2+ is the kidney, with symptoms that range from pale and swollen kidneys, proteinurea, and decreased urine production to complete renal failure (ATSDR 1999). Inorganic Hg has a half-life of one to two months prior to excretion in urine and feces; the major excretion route following chronic
exposure to low doses of inorganic Hg is through urine (Environment Agency 2009; Klaassen et al. 2008).
1.6 Motivation
With the financial support of a Duke Global Health Institute pilot grant, a trans-disciplinary, inter-institutional study was launched in 2010 to investigate residential Hg
11
study, my research project was designed to characterize and evaluate residential Hg contamination in Huancavelica, Peru.
1.7 Objectives
The purpose of the research in this thesis was to investigate the extent of residential exposure to Hg contamination from historic cinnabar refining in Huancavelica, Peru, and to assess personal mercury exposures from indoor sources. The overall objective was pursued as three specific research objectives:
i. Characterize the spatial distribution of Hg in residences by (a) determining the total Hg concentrations from multiple samples of adobe bricks, dirt floors, surface dust, and vapor collected from 60 residences in four distinct neighborhoods, and (b) comparing the concentrations across the 60 residences with respect to the four different neighborhoods studied.
ii. Characterize the Hg present in residences and determine its bioaccessibility, and evaluate potential exposure risks against international health benchmarks and cleanup values for Hg.
iii. Characterize and evaluate personal Hg exposure using total Hg concentrations in hair, total and speciated Hg measurements in residential samples, and self-reported
questionnaire data to support the development of a risk-based method to prioritize mitigation or intervention strategies in Huancavelica.
Chapter 2 of this thesis details the study of Hg contamination in adobe homes. In this study, total Hg concentrations were measured in adobe brick, dirt floor, surface dust, and air samples from the interior of 60 adobe houses located in four distinct neighborhoods of
12
neighborhoods. All samples were compared to control samples taken from Ayacucho, Peru, a non-mining town 150 kilometers southeast of Huancavelica. Concentrations of total Hg in adobe bricks, dirt floors, and surface dust ranged from 8.00 to 1070 µg/g, 3.06 to 926 µg/g, and 0.02 to 9.69 µg/wipe, respectively, with statistically significant differences between the three
neighborhoods and the non-smelting neighborhood. Concentrations of Hg in adobe brick and dirt floor samples in Huancavelica were orders of magnitude higher than in the control, non-mining town. The strong correlation between total Hg concentrations in adobe bricks and dirt floors confirmed that adobe bricks were likely made on-site and were not purchased from an off-site, uncontaminated source. A strong correlation between surface dust and adobe bricks and dirt floors indicates that walls and floors serve as indoor sources of Hg contamination. Elemental Hg vapor concentrations were below detection (<0.5 µg/m3) in most homes; however, in homes with detectable levels, concentrations up to 5.1 µg/m3 were observed. No statistically significant differences in Hg vapor measurements were observed between neighborhoods. This study demonstrates that the adobe bricks may be a substantial source of residential Hg exposure, especially in historic silver or gold refining communities where Hg was produced or used for amalgamation in artisanal gold or silver production. These results have been presented at the International Conference on Mercury as a Global Pollutant (2011) and the Society of
Environmental Toxicology and Chemistry (2012) meetings and published in the peer-reviewed journal PLoS ONE in September 2013.
13
are resource intensive. Most Hg present in samples was relatively insoluble, although in some households, soluble Hg species were present in water soluble (F1), ‘human stomach acid’ soluble (F2), and organo-chelated (F3) fractions of SSEs. The percent of the total Hg extracted in the simulated GI extractions for adobe bricks and dirt floors was up to 7.4% and 6.8%, respectively. While the bioaccessible Hg is only a small fraction of the total Hg present in a sample, there is still potential for concern following ingestion. A strong correlation was identified between simulated GI extractions for adobe bricks and dirt floors and the more soluble fractions of Hg from SSEs. This is an important finding, in that simulated GI extractions have the potential to be used as a screening tool to target time and resources effectively by performing SSEs on samples that have measurable concentrations of bioaccessible Hg. By combining information related to body weights and ingestions rates for children and health benchmarks for oral exposure to Hg, it was possible to calculate a Level of Soil Contamination (LSC) for varying exposure scenarios. These calculations revealed that Hg concentrations in simulated GI extractions for adobe brick and dirt floor samples in some households exceed health benchmarks for soluble Hg, although the magnitude of the potential public health impact is much lower than when comparing total Hg. Combining simulated GI extraction data with health benchmarks permits intervention strategies targeted to households with the greatest potential health threat from ingestion of
Hg-contaminated particles. These results have been presented at the Society of Environmental Toxicology and Chemistry (2012, 2013) meetings and were submitted to the peer-reviewed journal Environmental Geochemistry and Health in February 2014.
14
in hair from 118 participants ranged from 0.10 to 3.6 µg/g, similar to concentrations found in the U.S. and lower than concentrations in other Hg-exposed populations around the world. Pearson correlation coefficients for data in this study suggest that, while there is a positive association between concentrations of total Hg in hair and concentrations of total Hg in adobe bricks, dirt floors, and surface dust, these correlations are not statistically significant. Results of a one-way analysis of variance (ANOVA) identified that total Hg concentrations in hair were significantly related to gender (p<0.001), living in a neighborhood where smelters were previously located (p=0.021), smoking status (p=0.003), frequency of house cleaning (p=0.019), and frequency of fish consumption (p=0.046). These results highlight the need for future studies to better
characterize Hg exposure in Huancavelica, particularly as related to residential contamination. A comprehensive analysis of residential Hg contamination and exposure in Huancavelica will guide the development and implementation of mitigation and remediation strategies in the community to reduce potential health risks from residential Hg exposure. These results have been presented at the Society of Environmental Toxicology and Chemistry (2013) meeting and are currently under review for submission to the peer-reviewed journal Environmental
Geochemistry and Health in April 2014.
Chapter 5 discusses the key scientific findings of the research resulting from this
15
REFERENCES
Arena P. 1901. Las minas de azogue del Perú [in Spanish]. Lima:Imprenta de “El Lucero.” ATSDR (Agency for Toxic Substances and Disease Registry). 1999. Toxicological Profile for Mercury. Atlanta, GA:US Department of Health and Human Services, Public Health Service. Available: http://www.atsdr.cdc.gov/toxprofiles/tp.asp?id=115&tid=24 [accessed 10 January 2011].
Bakewell P. 1975. Registered silver production in the Potosi district, 1550-1735. Jahrb Gesch Staat Wirtsch Ges Lateinam 12:67-103.
Bernaus A, Gaona X, Valiente M. 2005. Characterisation of Almadén mercury mine environment by XAS techniques. J Environ Monit 7:771-777.
Brown K. 1988. La crisis financiera peruana al comienzo del siglo XV, la minería de plata y la mina de azogue de Huancavelica [in Spanish]. Rev Indias 48:349–381.
Caravantes FL. 1989. Noticia general del Perú, Vol 4 [in Spanish] (Helmer M, ed). Madrid:Ediciones Atlas.
Conde Bueno P, Bellido E, Martín Rubí JA, Jiménez BAllesta R. 2009. Concentration and spatial variability of mercury and other heavy metals in surface soil samples of periurban waste mine tailing along a transect in Almadén mining district (Spain). Environ Geol 56:815-824. Cooke CA, Blacom PH, Biester H, Wolfe AP. 2009. Over three millennia of mercury pollution in the Peruvican Andes. Proc Natl Acad Sci 106:8830-8834.
de Velasco L. 1921. Relación del Sr. Virrey, D. Luis de Velasco, al Sr. Conde de Monterrey sobre el estado del Perú [in Spanish]. In: Colección de las memorias o relaciones que escribieron los virreys del Perú, Vol 1 (Beltrán y Rózpide R, ed). Madrid:Imprenta del Asilo de Huérfanos del S.C. de Jesús, 108–140.
Environment Agency. 2009. Contaminants in soil: updated collation of toxicological data and intake values for humans, mercury. Bristol, United Kingdom:Environment Agency. Available:
http://a0768b4a8a31e106d8b0-50dc802554eb38a24458b98ff72d550b.r19.cf3.rackcdn.com/scho0309bpqn-e-e.pdf [accessed 15 July 2013].
Fisher J. 1977. Silver Mines and Silver Miners in Colonial Peru, 1776–1824. Monograph Series No. 7. Liverpool, UK:Center for Latin American Studies, University of Liverpool.
16
Gochfield M. 2003. Cases of mercury exposure, bioavailability, and absorption. Ecotoxicol Environ Saf 56:174-179.
Gosar M, Pirc S, Šajn R, Bidovec M, Mashyanov NR, Sholupov SE. 1997. Distribution of mercury in the atmosphere over Idrija, Slovenia. Environ Geochem Health 19:101-110. Hagan N, Robins N, Hsu-Kim H, Halabi S, Morris M, Woodall G, et al. 2011. Estimating historical atmospheric mercury concentrations from silver mining and their legacies in present-day surface soil in Potosí, Bolivia. Atmos Environ 45:7619-7626.
Higueras P, Oyarzun R, Lillo J, Sánchez-Hernández JC, Molina JA, Esbrí JM, et al. 2006. The Almadén mining district (Spain): anatomy of one of the world’s largest Hg-contaminated sites. Sci Total Environ 356:112-124.
Klaassen C, Doull J, Casarett L. 2008. Casarett and Doull’s Toxicology: The Basic Science of Poisons. New York: McGraw-Hill.
Kocman D, Horvat M, Kotnik J. 2004. Mercury fractionation in contaminated soils from the Idrija mercury mine region. J Environ Monit 6:696-703.
Lane K. 2012. Dangerous attractions: mercury in human history. In: Mercury Pollution: A Transdisciplinary Treatment (Zuber SL, Newman MC, eds.). Boca Raton, FL:CRC Press, 13-31. Llanos, W, Kocman D, Higueras P, Horvat M. 2011. Mercury emission and dispersion models from soils contaminated by cinnabar mining and metallurgy. J Environ Monit 13:3460-3468. Lohmann Villena G. 1999. Las minas de Huancavelica en los siglos XVI y XVII [in Spanish]. Lima:Pontífica Universidad Católica del Perú.
Mason RP, Fitzgerald WF, Morel MM. 1994. The biochemical cycling of elemental mercury: anthropogenic influences. Geochim Cosmochim Acta 58:3191-3198.
Mendoza J. 2012. 86.5% de casas en Huancavelica son de adobe y tapia [in Spanish]. Correo (Huancavelica, Peru) 14 November. Available:
http://diariocorreo.pe/ultimas/noticias/2271103/edicion+huancavelica/86-5-de-casas-de-huancavelica-son-de-adobe-y [accessed 25 February 2013].
Millán R, Gamarra R, Schmid T, Sierra MJ, Quejido AJ, Sánchez DM, et al. 2006. Mercury content in vegetation and soils of the Almadén mining area (Spain). Sci Total Environ 368:79-87.
17
NRC (National Research Council). 2000. Toxicological Effects of Methylmercury. Washington, DC:National Academy Press. Available: http://www.nap.edu/openbook.php?isbn=0309071402 [accessed 8 January 2013].
Palinkaš L, Pirc S, Miko SF, Durn G, Namjesnik K, Kapelj S. 1995. The Idrija mercury mine, Slovenia, a semi-millennium of continuous operation: an ecological impact. In: Environmental Toxicology Assessment (Richardson M, ed.). London:Taylor and Francis Ltd., 317-341. Patiño Paúl Ortíz M. 2001. Huancavelica colonial: Apuntes históricos de la ciudad minera más importante del Virreynato Peruano [in Spanish]. Lima:Huancavelica 21.
Pirrone N, Cinnirella S, Feng X, Finkelman RB, Friedli HR, Leaner J, et al. 2010. Global mercury emissions to the atmosphere from anthropogenic and natural sources. Atmos Chem Phys 10:5951-5964.
Robins NA. 2011. Mercury, Mining, and Empire, the Human and Ecological Costs of Colonial Silver Mining in the Andes. Indiana:Indiana University Press.
Robins NA, Hagan NA. 2011. Mercury production and use in colonial Andean silver production: emissions and health implications. Environ Health Perspect 120:627-631.
Robins NA, Hagan N, Halabi S, Hsu-Kim H, Espinoza Gonzales RD, Morris M, et al. 2012. Estimations of historical atmospheric mercury concentrations from mercury refining and present-day soil concentrations of total mercury in Huancavelica, Peru. Sci Total Environ 426:146-154. Schroeder WH, Munthe J. 1998. Atmospheric mercury – an overview. Atmos Environ 32:809-822.
UNEP (United Nations Environment Programme). 2002. Global Mercury Assessment. Geneva, Switzerland:UNEP Chemicals. Available: http://www.unep.org/gc/gc22/Document/UNEP-GC22-INF3.pdf [accessed 9 September 2013].
UNEP (United Nations Environment Programme). 2008. Guidance for Identifying Populations at Risk from Mercury Exposure. Geneva Switzerland:UNEP DTIE Chemicals Branch and WHO Department of Food Safety, Zoonoses, and Boodborne Diseases. Available:
http://www.who.int/foodsafety/publications/chem/mercuryexposure.pdf [accessed 9 September 2013].
US EPA (United States Environmental Protection Agency). 1997. Mercury Study Report to Congress. Washington, DC:US EPA. Available: http://www.epa.gov/hg/report.htm [accessed 9 September 2013].
18
19
CHAPTER 2. RESIDENTIAL MERCURY CONTAMINATION IN ADOBE BRICK HOMES IN HUANCAVELICA, PERU1
2.1 Introduction
Legacy mercury (Hg) contamination resulting from cinnabar mining and refining, particularly in ambient soils, has been studied in various parts of the world, most notably Almadén, Spain (Higueras et al. 2006; Molina et al. 2006) and Idrija, Slovenia (Gnamuš et al. 2000). In Almadén, Hg concentrations in ambient soil have varied across studies, ranging from less than 1 μg/g (Molina et al. 2006) to over 8800 μg/g (Higueras et al. 2006), while in Idrija measured concentrations have ranged from less than 1 to over 2700 μg/g (Gnamuš et al. 2000). Huancavelica was the site of one of the largest urban cinnabar refining operations, yet legacy contamination was not studied in the city until 2009 (Robins 2011; Robins and Hagan 2012; Robins et al. 2012). In a previous study, we reported Hg concentrations in ambient soil ranging up to 1200 μg/g (Robins et al. 2012), among the highest concentrations noted in the literature. It
is important to understand the extent of this contamination and characterize the Hg present to estimate potential risks to the local populations from inhalation of Hg offgassing as vapor or from inhalation or ingestion of contaminated soil particles. This issue is especially important for children who tend to ingest more soil and dust than adults as a result of hand to mouth activity.
1 This chapter was published in its original form in PLoS One and is distributed under the terms of the Creative
Commons Attribution License, which permits reproduction as a part of this dissertation.
20
Huancavelica, Peru is located at an elevation of 3660 m in the Andes, where for over 350 years it served as the primary source of Hg used for amalgamation-based silver production in South America (Cooke et al. 2009; Robins 2011). The 1563 discovery of cinnabar ore (HgS) in the Santa Barbara Hill just outside of Huancavelica provided a vast economic resource for Spain because Hg was essential to silver refining. To refine Hg, extracted cinnabar ore was crushed and smelted, a process in which the Hg was volatilized, collected, and shipped to Andean silver mining centers (Robins 2011). Extensive environmental contamination occurred in Huancavelica because the Hg vapor and liquid would routinely escape from the inefficient smelters located in the city. Based on colonial records, 17,000 metric tons of Hg vapor were emitted in
Huancavelica between 1564 and 1810 (Robins 2011; Robins and Hagan 2012). Most of the Hg vapor likely deposited in and around the city, resulting in extremely high levels of urban contamination.
In Huancavelica, exposure to Hg contamination may be intensified compared to other cinnabar refining areas like Almadén and Idrija. Huancavelica is the capital of the most
21
from ambient contamination but also from the contaminated interior walls and floors of their homes. This study was undertaken to determine the levels of Hg to which the current residents of adobe brick homes in Huancavelica are exposed. Its goal was to better understand the primary sources of Hg within residences, and the interrelationships among these sources.
The results of this study have broad application to other areas in the world that use Hg for artisanal silver and gold refining and that construct buildings and homes from adobe brick, such as Madre de Dios and Puerto Maldonado, both also in Peru. It is important to identify the primary indoor sources of Hg and the distribution of contamination across the city with respect to historic sources, both to characterize exposure and potential health outcomes, as well as to develop and evaluate mitigation and remediation efforts.
2.2 Methods
Figure 2-1 shows a map of the historic smelter locations and neighborhoods in
Huancavelica. We expected to find higher Hg concentrations in samples from homes located in neighborhoods with historic cinnabar smelters (Ascencion (A), San Cristóbal (B), and Yananaco (D), shown in Figure 2-1) as compared to Santa Ana (C), a neighborhood with no historic cinnabar refining. We also expected to find similar concentrations of Hg in adobe bricks and dirt floors, assuming adobe bricks were made on-site. Moreover, we expected Hg concentrations in surface dust to be correlated with concentrations in adobe bricks and dirt floors, as we
22 2.2.1 Sample collection
Samples of interior adobe brick, dirt floor, surface dust, and vapor were collected from 60 residences in Huancavelica, Peru in August 2010. These samples were collected from 15 homes in each of the four neighborhoods, Ascención, San Cristóbal, Santa Ana and Yananaco, shown in Figure 2-1. These neighborhoods were selected based on the historical location of cinnabar smelters and the results of previous ambient soil sampling (Robins et al. 2012). Participants were recruited from public community meetings and interactions; verbal consent for participation was given by an adult resident or homeowner. Consent was recorded through the inclusion of the participant on the field sampling log. Institutional review board (IRB) approval for the study and verbal consent was obtained through Duke University.
Figure 2-1. Map of historic smelter locations and neighborhoods sampled in 2010 in Huancavelica, Peru
23
obtained by scraping approximately 20 g of surface material to a depth of 2.5 cm from the interior adobe brick walls from three locations in the room. Dirt floor samples were collected by removing approximately 20 g of surface soil from the floor to a depth of 2.5 cm from three locations in the same room. In homes that had solid sealants on floors (e.g., wood or concrete), floor samples were obtained from the dirt patio immediately outside of the home (less than 10% of homes in the study). Triplicate samples of the adobe brick walls and dirt floors were not pooled; each sample was stored individually in a specimen bag. Surface dust samples were obtained by wiping three separate 100 cm2 areas of a hard, flat surface (e.g., kitchen table, dresser) with three moistened smear tabs (Whatman Low Ash Grade 50 Filter Paper, Fisher Scientific). Each smear tab was folded with the sample side inward and stored in a separate specimen bag. Once transported, all samples were stored at 4 °C in the laboratory until analysis.
Control samples were collected in Ayacucho, a non-mining town in Peru, located about 150 km southeast of Huancavelica. Triplicate samples of exterior adobe brick scrapings were collected from three homes and duplicate samples of ambient soil were collected from five homes using the same sampling and storage methods used in Huancavelica.
24 2.2.2 Sample preparation and Hg analysis
Adobe brick, dirt floor, and surface dust wipe samples were digested by hot block
extraction in 4:1 HCl:HNO3 at 85°C for five hours. After digestion, the extract was diluted in 1% bromine monochloride and analyzed for total Hg content by stannous chloride reduction, gold amalgamation, cold vapor atomic fluorescence spectrometry (EPA Method 1631) (US EPA 2002) using a Brooks Rand MERX-T (Brooks Ran Labs, LLC, Seattle, WA). Instrument calibrations were performed with an acidified mercuric nitrate stock solution. A NIST-certified standard reference material (2709 San Joaquin soil) was digested in parallel with each batch of samples. The average recovery of total Hg in the standard reference material (SRM) was 107 ± 14% (n=21). Recovery of Hg from the SRM was within the acceptable range of the certified value (1.4 ± 0.08 µg/g).
2.2.3 Statistical analysis
25
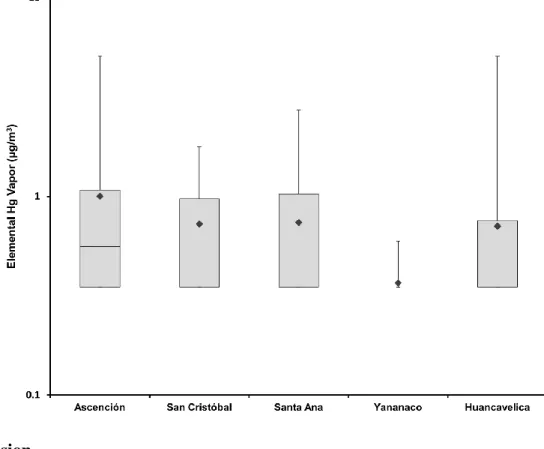
Results shown in figures and tables are arithmetic means. Descriptive statistics were computed and boxplots were used to summarize Hg concentrations. The values represented in the boxplots are the first quartile, median, and third quartile. The whiskers are the minimum and maximum values and the diamonds represent the arithmetic mean.
Exploratory analyses were performed where log-transformed total Hg concentrations in adobe brick, dirt floor, surface dust, and vapor samples were compared between neighborhoods using one-way ANOVA. Tukey’s Studentized Range (HSD) test was used to identify all pairwise comparisons that were statistically significantly different controlling for the experiment wise error rate. In addition, Pearson correlation coefficients, denoted by r, were calculated to estimate the dependence of sample types on a neighborhood level and Huancavelica-wide. No adjustment was made for multiple comparisons in testing the correlations between sample types. All
statistical analyses were completed using SAS 9.2 software (SAS Institute Inc., Cary, NC).
2.3 Results
2.3.1 Total Hg in adobe bricks, dirt floors, and surface dust
26
and 90th percentile) total Hg concentrations in surface dust were 2.25 µg/g (0.03 µg/g and 1.09 µg/g, respectively).
Figure 2-2. Total Hg concentrations in adobe bricks and dirt floors by neighborhood
27 2.3.2 Elemental Hg vapor in indoor air
Figure 2-4 shows the elemental Hg vapor concentrations that were measured in 15 homes from each of the four neighborhoods, using the Jerome J405 Mercury Vapor Analyzer. Thirty nine of the 60 households were below the limit of detection of the instrument. Elemental Hg vapor concentrations across the 60 households ranged from 0.35 to 5.1 µg/m3.
Figure 2-4. Elemental Hg vapor concentrations in indoor air by neighborhood
2.4 Discussion
2.4.1 Differences in total Hg in adobe bricks, dirt floors, and surface dust between neighborhoods
28
significantly different from one another; however, Santa Ana (C) had significantly lower Hg concentrations in adobe bricks, dirt floors, and surface dust than the other three neighborhoods (p<0.0001).
As shown in Figure 2-1, the neighborhoods of Ascensión (A), San Cristóbal (B), and Yananaco (D) historically had smelters operating throughout the neighborhood (Robins 2011; Robins et al. 2012). Santa Ana (C), in contrast, did not have any smelters during the colonial refining period. The lower concentrations of total Hg in adobe bricks, dirt floors, and surface dust in Santa Ana may be due to the absence of historic cinnabar refining in this section of the city.
2.4.2 Relationships between total Hg in adobe bricks, dirt floors, and surface dust
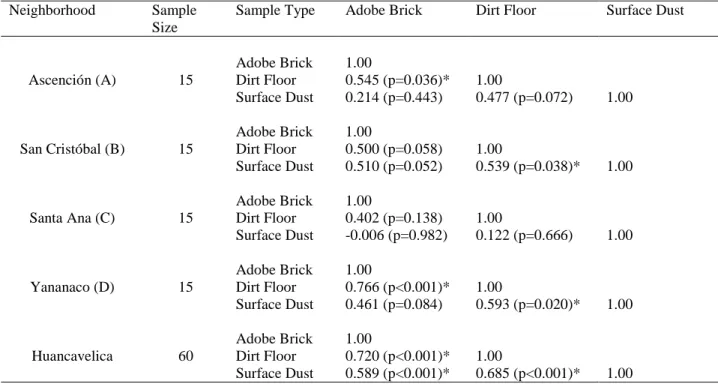
Pearson correlation coefficients were calculated for total Hg concentrations in adobe bricks, dirt floors, and surface dust on a neighborhood and Huancavelica-wide basis, as shown in Table 2-1. A strong correlation was observed in Yananaco (D) between total Hg concentrations in adobe bricks and dirt floors (r=0.766, p<0.001). Moderate correlation was observed between these sample types in Ascención (A) (r=0.545, p=0.036) and San Cristóbal (B) (r=0.500, p=0.058). These results suggest a significant correlation between total Hg concentrations in adobe bricks and dirt floors in Ascensión (A) and Yananaco (D). Moderate correlation was observed between total Hg concentrations in surface dust and dirt floors in San Cristóbal (B) (r=0.539, p=0.038) and Yananaco (D) (r=0.593, p=0.020). A statistically significant correlation was not found between total Hg concentrations in surface dust and adobe bricks in any of the individual neighborhoods.
29
concentrations in adobe bricks, dirt floors, and surface dust across all 60 residences in
Huancavelica. The strong correlation between total Hg concentrations in adobe bricks and dirt floors (r=0.720, p<0.001) confirms what the residents of Huancavelica reported: that they build adobe bricks using the materials present on their property rather than purchase manufactured adobe bricks made from materials external to their property. Moreover, the moderate correlation coefficients for total Hg concentrations in surface dust and adobe bricks (r=0.589, p<0.001) and surface dust and dirt floors (r=0.685, p<0.001) across the entire community suggest that adobe bricks and dirt floors are the primary source of Hg in surface dust inside the residences. Because many homes in Huancavelica are built from on-site adobe, these results indicate the potential for widespread Hg contamination throughout several neighborhoods.
Pearson correlation coefficients were also calculated city-wide after excluding Santa Ana (not shown in Table 2-1) because total Hg concentrations in adobe brick, dirt floors, and surface dust were found to be significantly lower in Santa Ana than in the other four neighborhoods. When Santa Ana is excluded, moderate correlation was observed for the remaining households (n=45) for adobe bricks and dirt floors (r=0.591, p<0.001), surface dust and adobe bricks
(r=0.349, p<0.001), and surface dust and dirt floors (r=0.529, p<0.001). Although the correlation coefficients are lower when excluding Santa Ana, the correlations between sample types are still very significant.
30
µg/g and 82.2 µg/g for urban and rural houses, respectively. The authors estimated an indoor to outdoor mean ratio for Hg of 0.44 based on arithmetic means, which suggested that Hg in household dust was coming from an outside source.
Table 2-1. Pearson correlation coefficients, sample size, and p-value for log-transformed total Hg concentrations in adobe bricks, dirt floors, and surface dust by neighborhood
Neighborhood Sample Size
Sample Type Adobe Brick Dirt Floor Surface Dust
Ascención (A) 15
Adobe Brick 1.00
Dirt Floor 0.545 (p=0.036)* 1.00
Surface Dust 0.214 (p=0.443) 0.477 (p=0.072) 1.00
San Cristóbal (B) 15
Adobe Brick 1.00
Dirt Floor 0.500 (p=0.058) 1.00
Surface Dust 0.510 (p=0.052) 0.539 (p=0.038)* 1.00
Santa Ana (C) 15
Adobe Brick 1.00
Dirt Floor 0.402 (p=0.138) 1.00
Surface Dust -0.006 (p=0.982) 0.122 (p=0.666) 1.00
Yananaco (D) 15
Adobe Brick 1.00
Dirt Floor 0.766 (p<0.001)* 1.00
Surface Dust 0.461 (p=0.084) 0.593 (p=0.020)* 1.00
Huancavelica 60
Adobe Brick 1.00
Dirt Floor 0.720 (p<0.001)* 1.00
Surface Dust 0.589 (p<0.001)* 0.685 (p<0.001)* 1.00 *indicates statistical significance at α=0.05; p-values not corrected for multiple comparisons
In areas close to historical Hg mining locations such as Idrija, Slovenia, elevated Hg levels in dust have also been observed (Gosar et al. 2006). In that study, the median Hg concentrations in attic dust and soils near homes in Idrija were 129 µg/g and 47 µg/g,
31
concentrations in attic dust and soils, suggesting outdoor sources of Hg influenced indoor dust concentrations.
Likewise, in a study in Ottawa, Canada, Rasmussen et al. (2001) measured Hg in indoor dust and exterior soils and dust in Ottawa, Canada. Average Hg concentrations in garden soil and street dust were 0.107 µg/g and 0.029 µg/g, respectively, while average house dust Hg
concentrations were 3.633 µg/g. The authors found that indoor sources contributed to Hg concentrations in house dust more than outdoor sources.
Rasmussen et al. (2001) also suggested that, because of higher concentrations of biogenic particles and organic matter in indoor dust compared to outdoor soil and dust, there is potential for indoor dust to accumulate higher concentrations of Hg and other metals. The authors suggest that this accumulation, a result of poor air exchange particularly in damp homes, can lead to an increase in fungi in indoor dust, which can accumulate greater concentrations of Hg. This finding is particularly important in Huancavelica, where homes are often damp and poorly ventilated. Because the adobe brick walls and dirt floors in Huancavelica are typically unsealed and subjected to dampness and inadequate air exchange, there is potential for walls and floors, in addition to surface dust, to accumulate greater concentrations of Hg than a home with sealants applied to walls and floors.
2.4.3 Differences in elemental Hg vapor between neighborhoods
32
measurements that were below the limit of detection of the instrument (39 of 60 homes) and suggests that, while some individual households appear to have elevated elemental Hg vapor concentrations, these variations cannot be attributed to differences in characteristics of the four neighborhoods.
2.4.4 Implications for potential health effects from exposure
The semi-arid climate of Huancavelica results in a very dusty ambient environment stemming from many unpaved roads and outdoor surfaces. Results of a previous study have identified ambient total Hg concentrations in surface soil in Huancavelica ranging between 1.75 and 698 µg/g (Robins et al. 2012). Results of the present study found similar or greater
concentrations of total Hg in adobe bricks, dirt floors, and surface dust. While health effects resulting from Hg exposure depend on the exposure pathway and the type of Hg present, it is clear that the residents of Huancavelica can be exposed to Hg through both outdoor and indoor environments. Robins et al. (2012) suggest that, in ambient soil, a majority of the Hg present is a sulfur-bound mineral phase (e.g., cinnabar or metacinnabar). While other forms of Hg, such as organic and elemental Hg, have more immediate and severe health implications, all species of Hg pose a potential health risk to those exposed.
In the dusty, widely contaminated community of Huancavelica, it is important to
33
dust samples had total Hg concentrations above 33 µg/g. The dirt and dust ingestion rate used in the EPA study were representative of children in the United States. It is likely that children in Huancavelica, and the Andean region in general, are smaller than children in the United States and, because adobe walls and dirt floors are typically unsealed and the community is generally dusty, children in Huancavelica could potentially ingest more dirt and dust from hand-to-mouth activity than the average child in the United States. If so, then the calculations above associated with ingesting dirt and dust for children in Huancavelica may underestimate the potential risks.
This study demonstrates that building materials used widely in the developing world, such as adobe bricks, may be a substantial source of residential Hg exposure in contaminated communities. In Huancavelica, Hg in adobe brick homes is a result of legacy contamination that primarily occurred hundreds of years ago during the Spanish colonial period. Understanding exposure to Hg from such building materials, particularly adobe bricks made in the community, has broader relevance to evaluating risks in communities that currently produce or refine silver and gold, such as Madre de Dios and Puerto Maldonado, both also in Peru. In these communities, gold shops and other buildings used for refining are often constructed from adobe brick that has the potential to act as a sink for elemental Hg vapor released from current refining processes and may be a source of Hg exposure in the future.
2.5 Conclusions
The purpose of this study was to determine the current levels of mercury to which
34
bricks, 3.06 to 926 µg/g in dirt floors, and 0.02 to 9.69 µg/wipe in surface dust. These results indicate that total Hg concentrations vary by neighborhood, with Santa Ana (C) having consistently lower Hg concentrations than the other three neighborhoods. This finding may suggest that the present-day spatial distribution of total Hg contamination in residences is influenced by the location of historical cinnabar smelters.
These results also point to a strong relationship between total Hg concentrations in adobe bricks and dirt floors. This result confirms that residents of Huancavelica are using materials on their property to construct adobe bricks for their homes, rather than purchasing manufactured adobe bricks. Additionally, the strong relationship between total Hg concentrations in surface dust and adobe bricks and surface dust and dirt floors suggests that adobe bricks and dirt floors are the primary source of Hg in indoor dust, rather than an outdoor source.
Elemental Hg vapor concentrations from 39 of the 60 residences in Huancavelica were below the limit of detection. For residences with measurements above the limit of detection, concentrations of elemental Hg vapor ranged up to 5.1 µg/m3. While individual homes vary in Hg vapor concentrations, no significant difference in these concentrations was found between neighborhoods.
The results of this study demonstrate that adobe bricks and other building materials used in developing communities may be a substantial source of residential Hg exposure, particularly in communities with past or present mercury production and where silver or gold refining utilizes Hg for amalgamation. Adobe bricks are used to construct buildings around the world, from the southwest United States to South America to Africa. As the first study of adobe brick
35
understand potential health effects from exposure, it is important to quantify levels of
36
REFERENCES
Cooke CA, Blacom PH, Biester H, Wolfe AP. 2009. Over three millennia of mercury pollution in the Peruvian Andes. Proc Natl Acad Sci 106:8830-8834.
Gnamuš A, Byrne AR, Horvat M. 2000. Mercury in the soil-plant-deer-predator food chain of a temperate forest in Slovenia. Environ Sci Technol 34:3337-3345.
Gosar M, Šajn R, Biester H. 2006. Binding of mercury in soils and attic dust in the Idrija mercury mine area (Slovenia). Sci Total Environ 369:150-162.
Hagan N, Robins N, Hsu-Kim H, Halabi S, Morris M, Woodall G, et al. 2011. Estimating historical atmospheric mercury concentrations from silver mining and their legacies in present-day surface soil in Potosí, Bolivia. Atmos Environ 46:7619-7626.
Higueras P, Oyarzun R, Lillo J, Sánchez-Hernández JC, Molina JA, Esbrí JM, et al. 2006. The Almadén district (Spain): Anatomy of one of the world’s largest Hg-contaminated sites. Sci Total Environ 356:112-124.
Lemus R, Abdelghani AA, Akers TG, Horner WE. 1996. Health risks from exposure to metals in household dusts. Rev Environ Health 11:179-189.
Mendoza J. 2012. 86.5% de casas en Huancavelica son de adobe y tapia [in Spanish]. Correo (Huancavelica, Peru) 14 November. Available:
http://diariocorreo.pe/ultimas/noticias/2271103/edicion+huancavelica/86-5-de-casas-de-huancavelica-son-de-adobe-y [accessed 25 February 2013].
Molina JA, Oyarzun R, Esbrí J, Higueras P. 2006. Mercury accumulation in soils and plants in the Almadén mining district, Spain: one of the most contaminated sites on Earth. Environ Geochem Health 28:487-498.
Rasmussen PE, Subramanian KS, Jessiman BJ. 2001. A multi-element profile of housedust in relation to exterior dust and soils in the city of Ottawa, Canada. Sci Total Environ 267:125-140. Robins NA. 2011. Mercury, Mining, and Empire, the Human and Ecological Costs of Colonial Silver Mining in the Andes. Indiana: Indiana University Press.
Robins NA, Hagan NA. 2012. Mercury production and use in colonial Andean silver production: emissions and health implications. Environ Health Perspect 120:627-631.
Robins N, Hagan N, Halabi S, Hsu-Kim H, Espinoza Gonzales RD, Morris M, et al. 2012. Estimations of historical atmospheric mercury concentrations from mercury refining and present-day soil concentrations of total mercury in Huancavelica, Peru. Sci Total Environ 426:146-154. US EPA (US Environmental Protection Agency). 1995. Mercuric Chloride. Available:
37
US EPA (US Environmental Protection Agency). 2002. US EPA Method 1631, Revision E: Mercury in Water by Oxidation, Purge and Trap, Cold Vapor Atomic Fluorescence
Spectrometry. Washington, DC:Office of Water. Available:
http://water.epa.gov/scitech/methods/cwa/metals/mercury/upload/2007_07_10_methods_method _mercury_1631.pdf [accessed November 2011].
US EPA (US Environmental Protection Agency). 2008. Child-Specific Exposure Factors Handbook (Final Report). Washington, DC:Office of Research and Development, National Center for Environmental Assessment. Available:
38
CHAPTER 3. MERCURY SPECIATION AND BIOACCESSIBILITY FROM ADOBE BRICKS AND DIRT FLOORS IN HUANCAVELICA, PERU
3.1 Introduction
Mercury (Hg) is emitted from natural and anthropogenic sources and is measured in all compartments of the environment. Hg is transformed and transported in air, deposited onto the earth’s surface, and can be stored in or emitted by soil, water, and air, continuously being cycled in the environment and being oxidized and reduced to different species. Once deposited from the atmosphere onto the surface, Hg compounds in soil can undergo in situ reactions resulting in the formation of elemental Hg and organomercurials (US EPA 1997). While all species of Hg are toxic, some species are less mobile and bioaccessible (Gochfield 2003; Revis et al. 1990).
Bioaccessibility refers to the fraction of the total Hg that is desorbed from contaminated particles and dissolved in the gastrointestinal tract (Zagury et al. 2009).
In Huancavelica, Peru, a previous study measured levels of total Hg in residential samples and identified the primary sources of Hg in adobe brick homes (Hagan et al. 2013). Based on the results of that study, the inadvertent ingestion of Hg-contaminated soil particles by children was identified as an exposure pathway of interest. Health benchmarks are available for ingestion of Hg-contaminated soil and are often cited in the literature when evaluating total Hg measurements (Hagan et al. 2011; Li et al. 2013; Li 2013; Robins et al. 2012). Health
39
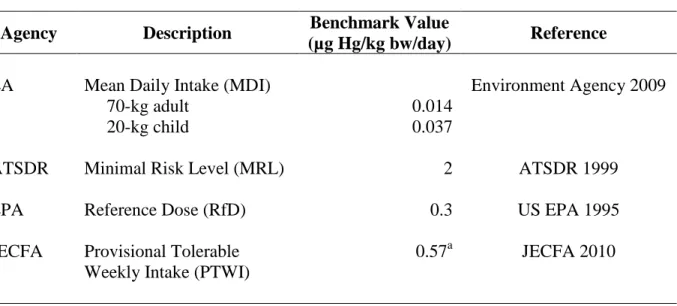
Agency (EA), Agency for Toxic Substances and Disease Registry (ATSDR), US Environmental Protection Agency (US EPA), and Joint FAO/WHO Committee on Food Additives (JECFA) are all based on mercuric chloride, which is up to 100% soluble following ingestion (ATSDR 1999; Environment Agency 2009; JECFA 2010; US EPA 1995). Total Hg measurements do not distinguish between soluble and insoluble forms of Hg so that comparisons between total Hg measurements and existing health benchmarks may overestimate the potential risks from exposure. In a site-specific situation, additional chemical analyses (e.g., sequential selective extractions or simple bioaccessibility extraction tests) can be used to further classify the species of Hg present in soils and to provide more detailed information for evaluating potential risks from ingestion.
Table 3-1. Current health benchmarks for oral exposure to inorganic Hg
Agency Description Benchmark Value
(µg Hg/kg bw/day) Reference
EA Mean Daily Intake (MDI) Environment Agency 2009
70-kg adult 0.014
20-kg child 0.037
ATSDR Minimal Risk Level (MRL) 2 ATSDR 1999
EPA Reference Dose (RfD) 0.3 US EPA 1995
JECFA Provisional Tolerable Weekly Intake (PTWI)
0.57a JECFA 2010
a
adjusted from units of µg Hg/kg bw/week to µg Hg/kg bw/day
40
Hg in adobe bricks and dirt floors in order to support effective development, implementation, and evaluation of future intervention, mitigation, and remediation strategies in the community.
3.2 Materials and Methods
3.2.1 Study area
Huancavelica, located in the Andean region of Peru, was the primary source of Hg used in amalgamation-based silver refining in South America for over 350 years. Beginning in 1563, Spanish colonists used the cinnabar ore in the Santa Barbara Hill outside of the city to produce liquid Hg in Huancavelica, which was then shipped to Andean silver refining centers. As a result of the cinnabar refining process, the local community was extensively contaminated by routine releases of Hg vapor and liquid, a legacy that still haunts the residents of Huancavelica decades after refining ceased in the 1970s (Robins 2011; Robins and Hagan 2012; Robins et al. 2012).
More than 80% of homes in Huancavelica are built from adobe bricks (Mendoza 2012). A previous study demonstrated elevated levels of total Hg in adobe bricks and dirt floors
collected in Huancavelica, with concentrations ranging up 1070 µg/g and 926 µg/g, respectively (Hagan et al. 2013). Because the walls and floors of adobe brick homes are generally uncovered and unsealed, residents are exposed to Hg-bound particles and vapor from these surfaces along with ambient exposure to Hg-contaminated soils (Robins et al. 2012).
3.2.2 Sample collection
41 3.2.3 Analytical methods
Households were assigned to batches using computer-generated randomization. Total Hg extractions, sequential selective extractions (SSEs), and simulated gastric fluid (GI) extractions were performed on composite samples of adobe brick and dirt floor samples from each
household. All solutions were prepared using reagent-grade chemicals and all procedures were performed using ultra-clean sample handling to avoid low-level Hg contamination.
Total Hg extractions were performed according to EPA Method 1631 (US EPA 2002). Adobe brick and dirt floor samples were digested in 4:1 HCl:HNO3 at 85˚C for five hours. Following digestion, samples were diluted to a final volume of 40 mL with deionized (DI) water and oxidized using 1% bromine monochloride.
42
Simulated GI extractions (pH 1.5) were performed using a simple bioaccessibility extraction test (SBET) that has often been used for trace metals other than Hg, but has
increasingly been used to simulate Hg bioaccessibility (Schaider et al. 2007). In vivo absorption of metals typically occurs in the epithelium of the small intestine which has circumneutral pH; however, absorption rates can be limited by the dissolution of particulate metals in the acidic gastric fluids. Therefore, the SBET utilized a simulated gastric fluid is a solution comprised of 0.4 M glycine and adjusted to pH 1.5 using concentrated HCl. A 1:100 solid:liquid mass ratio was used (same as the SSEs). The liquid:solid slurry was mixed for 1 hour at 37°C and separated by centrifuge prior to decanting the liquid phase into trace clean 40 mL glass vials and oxidation with bromine monochloride.
All samples were analyzed for Hg using a RA-915+ Lumex Mercury Vapor Analyzer equipped with a RP-M324 attachment (Ohio Lumex Co., Twinsburg, OH). For total Hg, SSEs, and simulated GI extractions for adobe bricks and dirt floors, aliquots up to 100 μL of each sample were analyzed for total Hg following EPA Method 30B (US EPA 2008a). Instrument calibrations were performed using mercuric chloride standards (SCP Science, Champlain, NY & Inorganic Ventures, Christiansburg, VA). Method blanks (n=11) were all below the limit of detection of the instrument (~1 ng Hg). A NIST-certified SRM (2709 San Joaquin soil) was digested with each batch of samples. The average recovery of total Hg in the SRM was 1.17 ± 1.03 ug/g (n=6). Recovery of Hg from the SRM was within the acceptable range of the certified value (1.4 ± 0.08 ug/g).
3.2.4 Statistical methods
log-43
transformed prior to statistical analyses. Prior to log-transformation, the raw data were adjusted for values below calibration and below the limit of detection of the instrument. Measurements below the lowest calibration point but with area counts greater than 200 were adjusted using a response factor (US EPA 2008a). For SSEs, samples with a recovery less than 60% or greater than 140% of the total Hg extraction were excluded. In the reporting of summary statistics only, measurements below the LOD of ~1 ng Hg (equivalent to an area count of 200) were set to 0.00125 µg/g Hg (½LOD mass adjusted to 0.2 g of sample); all other analyses were performed without substitution. Method duplicates that met inclusion criteria were included in the analysis. Statistical analyses were completed using SAS 9.2 software (SAS Institute Inc., Cary, NC).
3.3 Results
3.3.1 Recovery of Hg in SSEs and GI extractions
Summary statistics for extractable Hg in each fraction of the SSEs are shown in Table 3-2. The percent of Hg recovered in each fraction is consistent with other studies that have
performed SSEs on refining-related soil contamination, with lower amounts recovered in F1, F2, and F3, and a majority of the Hg present in the F4 and F5 fractions (Hagan et al. 2011; Male et al. 2013; Zagury et al. 2009).
44
Table 3-2. Extractable Hg in adobe bricks and dirt floors expressed on a mass basis (µg/g) and as a percentage of total Hg (%) from residences in Huancavelica, Peru
Fraction 1 (F1): deionized water
Fraction 2 (F2): 0.2 M acetic
acid (pH 2)
Fraction 3 (F3): 1 M KOH
Fraction 4 (F4): 12 M HNO3
Fraction 5 (F5): aqua regia (HCl + HNO3)
Simulated GI
Adobe Bricks
n 61 61 61 61 61 61
mean ± 1 sd µg/g 1.9 ± 4.5 1.0 ± 2.7 4.2 ± 6.6 17 ± 17 150 ± 210 1.6 ± 2.7 % 0.73 ± 1.7 0.30 ± 0.77 1.7 ± 2.1 13 ± 10 69 ± 17 0.81 ± 1.4
min, max µg/g 0.0013, 20 0.0013, 17 0.0013, 25 0.0013, 80 2.9, 1100 0.0013, 11 % 0.00013, 8.8 0.00013, 3.8 0.00052, 9.2 0.0067, 45 33, 120 0.00013, 7.4 Dirt Floors
n 49 49 49 49 49 49
mean ± 1 sd µg/g 1.8 ± 3.9 1.2 ± 3.3 5.0 ± 9.6 20 ± 19 120 ± 190 1.9 ± 3.7 % 0.57 ± 1.0 0.73 ± 2.1 3.2 ± 4.4 16 ± 9.6 76 ± 25 0.89 ± 1.5
min, max µg/g 0.0013, 17 0.0013, 17 0.0013, 49 0.0013, 67 2.1, 1100 0.0013, 20 % 0.00058, 4.2 0.00023, 12 0.00058, 21 0.016, 41 37, 130 0.00023, 6.8