Technical optimization of biogas plants to deliver demand oriented power
zur Erlangung
Doktor
an der
Technical optimization of biogas plants to deliver demand oriented power
Dissertation
Erlangung des akademischen Grades
Doktor der Ingenieurwissenschaften (Dr.-Ing.)
der Agrar- und Umweltwissenschaftlichen
Fakultät
der Universität Rostock
vorgelegt von
Camilo Andrés Wilches Tamayo
aus Kolumbien
Rostock, 2019
Gutachter:
Prof. Dr. Michael Nelles, Universität Rostock, AUF, Abfall- und Stoffstromwirtschaft
Prof. Dr. Kilian Hartmann, Technische Hochschule Aschaffenburg, Prof. für Ingenieurwissenschaften Prof. Dr. Christina Dornack, Technische Universität Dresden, Institut für Abfall- und Kreislaufwirtschaft
Jahr der Einreichung: 2019
Dieses Werk ist lizenziert unter einer
Contents
Contents i
List of Figures v
List of Tables vii
Nomenclature viii Abstract 1 1. Introduction 3 1.1. Background . . . 3 1.2. Problem statement . . . 5 1.3. Objectives . . . 5 2. Material 6 2.1. Anaerobic digestion . . . 6 2.1.1. Operating Temperature . . . 6
2.1.2. Stages of anaerobic digestion . . . 7
2.1.3. Nutrients . . . 10
2.1.4. Process parameters . . . 11
2.1.5. Type of reactors . . . 13
2.1.6. Process stability . . . 15
2.1.7. Management strategies in anaerobic digestion . . . 17
2.2. Operational flexibility of electric power systems . . . 19
2.3. Flexible power generation in biogas . . . 20
2.5.2. Theory of sampling guidelines . . . 27
2.6. Gas storage system . . . 29
2.6.1. Types of gas storage. . . 29
2.6.2. Measurements procedures . . . 32
2.6.3. Gas Storage management. . . 32
3. Methods 35 3.1. Commercial biogas plant description . . . 35
3.2. Model Description . . . 37
3.2.1. Biogas yield curves . . . 38
3.2.2. Definition of the optimization problem . . . 42
3.2.3. Constraints . . . 44
3.2.4. Maximum and minimum substrate quantities. . . 52
3.2.5. Feeding adjustment. . . 53
3.3. Model Validation . . . 53
3.4. Sampling system experimental setup design . . . 54
3.4.1. Sampling conditions . . . 59
3.4.2. Determination of sampling parameters . . . 62
3.5. Gas volume measurements . . . 63
3.5.1. Gas volume assumptions . . . 63
3.5.2. Operational range gas storage. . . 67
3.5.3. Gas management . . . 67
3.5.4. Temperature and pressure correction gas volume. . . 72
3.6. Gas production calculation . . . 74
3.6.1. Simple Moving Average (SMA). . . 74
3.6.2. Central Moving Average (CMA). . . 74
3.6.3. Moving Median (MM). . . 76
3.6.4. Statistics comparison to determine gas production . . . 76
4. Results 80 4.1. Biogas yield curves in the lab reactor . . . 80
4.2. Online monitoring . . . 87
4.2.1. Sampling parameters . . . 87
4.2.2. Measurements in the commercial plant . . . 89
4.3. Gas volume measurements . . . 96
4.3.1. Operational range gas storage. . . 96
4.3.2. Operational conditions generated by the gas management system 96 4.3.3. Dependency of gas storage levels in calculation of gas production.103 4.4. Model Validation . . . 104
4.4.1. Feeding model application . . . 107
4.4.2. Load profile . . . 107
4.4.3. Constant feeding vs Feeding on demand . . . 108
5. Discussion 113 5.1. Step response determination with lab reactor . . . 113
5.2. Online monitoring . . . 117
5.2.1. Sampling parameters . . . 117
5.2.2. Measurements in the commercial plant . . . 118
5.3. Gas volume measurements . . . 119
5.3.1. Operational range gas storage. . . 119
5.3.2. Gas production calculation . . . 120
5.4. Model validation . . . 124
5.5. Feeding program calculation . . . 125
6. Summary and outlook 126 Acknowledgments 136 A. Appendix 137 A.1. Substrate characteristics test plant . . . 137
A.2. Mathematical model description . . . 139
A.3. Thesis . . . 149
A.3.1. Motivation and Objectives . . . 149
List of Figures
2.1. Steps of biogas production and bacteria trophic groups involved . . . 7
2.2. Interspecies hydrogen transfer. . . 9
2.3. Dissociation curves for weak acids and bases. . . 26
2.4. Components air supported double layer gas storage . . . 31
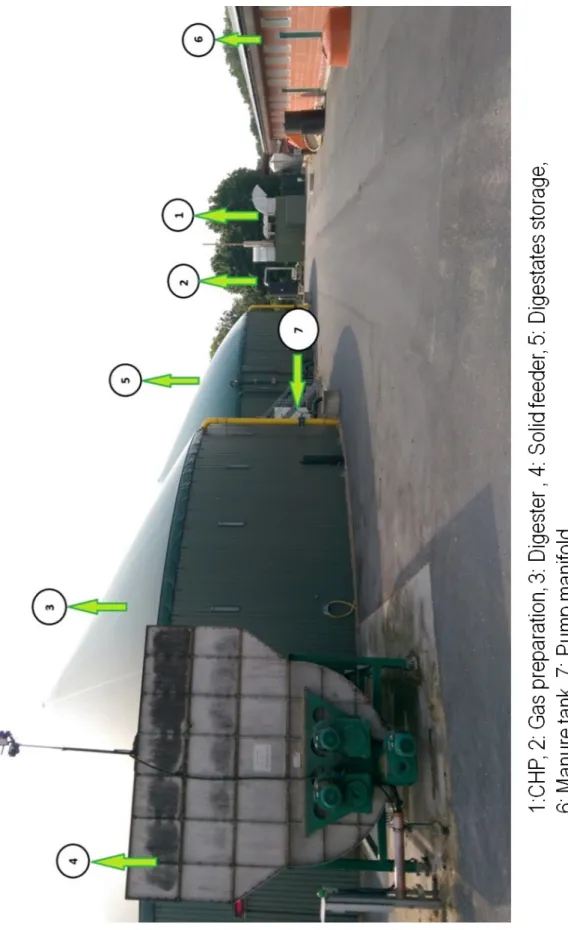
3.1. Test plant . . . 36
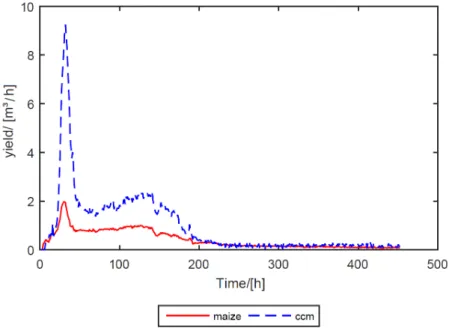
3.2. Hourly biogas yield curve of CCM and maize silage . . . 39
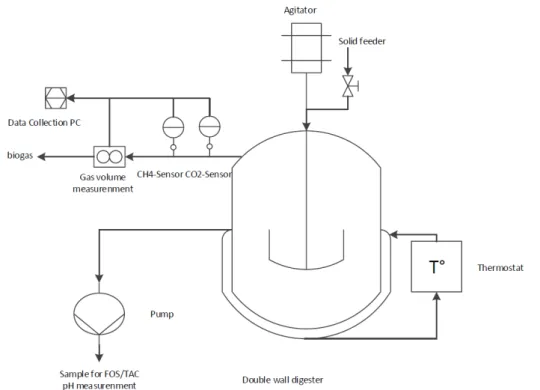
3.3. Experimental setup continuous feeding lab reactor . . . 40
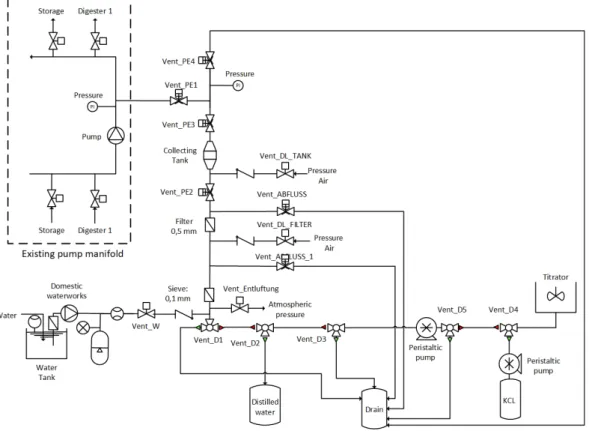
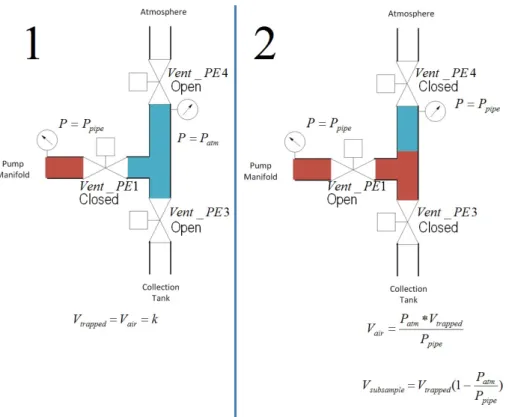
3.4. Process diagram sampling device. . . 54
3.5. Subsample dosing valve position . . . 56
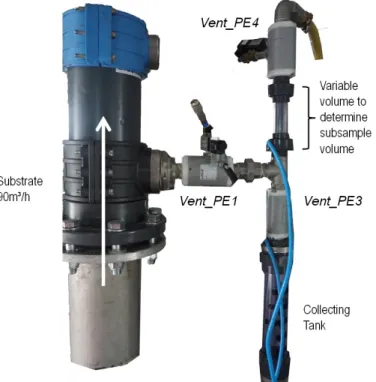
3.6. Physical construction of the three valves to define sampling volume . 57 3.7. Sampling system installed at the research plant . . . 60
3.8. Automated VFA/TIC, commercial application. . . 61
3.9. Sampling parameters . . . 63
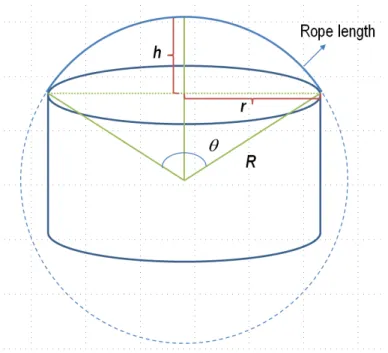
3.10. Gas storage membrane with spherical cap shape. . . 64
3.11. Gas volumes vs 4r for a 22 meter diameter digester . . . 64
3.12. Photo between membranes without straps . . . 65
3.13. Calming system . . . 66
3.14. Photo of calming system installation . . . 66
3.15. Control interphase gas management . . . 68
3.16. Operating range fan . . . 69
3.17. Air flow measurement in pressure regulating valve . . . 70
3.18. Measurement equipment gas storage . . . 71
3.19. Gas production every 30 sec . . . 75
3.20. Hourly gas production simple moving average . . . 77
different OLR . . . 81
4.2. Gas concentration measurements single feeding different OLR . . . . 82
4.3. Continuous feeding measurements lab reactor 1 . . . 83
4.4. Fit step response maize silage . . . 84
4.5. Gas production measurements lab reactor 2 maize silage single feeding different OLR . . . 86
4.6. Gas production measurements pig manure single feeding . . . 87
4.7. Configurations comparison sampling parameters . . . 88
4.8. Transition continuous vs variable feeding. Measurement done without gas storage modification . . . 90
4.9. Transition continuous vs variable feeding. Measurement done after installation of Baur “calming system” . . . 92
4.10. Three months online monitoring. . . 94
4.11. Gas volume variation through temperature and solar radiation for Digester . . . 96
4.12. Measurements volume fan digester . . . 99
4.13. Measurements volume fan storage . . . 100
4.14. Temperature effect in digester . . . 101
4.15. Temperature effect in storage . . . 102
4.16. Gas production at different gas storage levels . . . 103
4.17. Gas production vs model estimation for 6 weeks comparing transition between continuous and variable feeding. . . 105
4.18. Process parameters of feeding program calibration . . . 106
4.19. Load profile for a week day . . . 108
4.20. Power production calculated as gas equivalent in a constant feeding program and in a feeding on demand . . . 110
4.21. Constant feeding vs feeding on demand program . . . 111
4.22. Process parameters feeding on demand . . . 112
List of Tables
2.1. Acetogenesis reaction alcohol to acetic acid . . . 9
2.2. Standard free energy of main methanogenic reactions . . . 9
2.3. Trace element minimum concentration and OLR . . . 11
2.4. Classification criteria anaerobic reactors . . . 14
3.1. Water vapor correction factor . . . 72
4.1. Feeding schedule for lab reactor 1 maize silage . . . 80
4.2. Feeding schedule for lab reactor 2 . . . 85
4.3. Configuration comparison VFA/TIC parameters. . . 88
4.4. Lab results biological supervision including trace elements concentra-tion from the last 2 years. . . 93
A.1. Substrate characteristics test plant . . . 137
Mathematical Symbols and variables ˙ γ shear rate η dynamic viscosity ν speed ρ density σ2 variance
4G Gibbs free energy
4r variation of the rope length °C degree Celsius
A inequality constraints matrix ACN C/N ratio matrix
ADM dry matter matrix
ADMi average dry matter fed until interval i in 24 hours from m different substrates
Aeq equality constraints matrix AGS gas storage range matrix
AHRT hydraulic residence time matrix AM S minimum substrate quantity matrix AN ammonia inhibition matrix
AOLR organic loading rate matrix AT E total energy vector
b inequality constraints vector bCN C/N ratio vector
bDM dry matter vector
beq equality constraints vector
bGSM ax maximum gas storage range vector
bGSM in minimum gas storage range vector
bHRT hydraulic residence time vector
bM axOLR maximum organic loading rate vector
bM inOLR minimum organic loading rate vector
bM S minimum substrate quantity vector bN ammonia inhibition vector
bpriceorg cost of the substrates fed in the optimization interval by a continuous
feeding
bT E energy required to deliver the requested load C/Ni C/N ratio in the interval i
C/N ref C/N ratio reference value
Ci carbon quantities of m different substrates fed in the interval i
cj carbon content substrate j
CF(T, P)i volume correction factor for temperature pressure and water content
CHP ef engine electrical efficiency
d required energy vector Dref maximum input dry matter
digestervol volume of digestates in the digester in m3
DM dry matter quantities of m different substrates fed in the interval i dmj dry matter substrate j
G(hour)i hourly gas production
gj,t biogas yield of the substrate j, at a time t
GCHPi CHP gas consumption
GEi Energy generated by substrates fed in the optimization interval [1,t] at the time i
GS0 addition of the initial gas storage volume of the different tanks GSi addition of the gas volumes at standard conditions at interval i
h height of the cap
HP height of gas production peak
HRTi hydraulic residence time at the interval i
Hz hertz
J Joule
K volume ratio between digester and storage
kg kilogram
kW kilowatt
Lj length of biogas yield curve data series of the substrate j
lb minimum substrate quantity vector m number of substrates available for feeding m3 cubic meter
M0 methane content of gas storage before the optimizaion interval Mj average methane content of j substrate
MpH=5to4.4 additional acid required to reach pH 4.4 MpH=5 amount of acid to reach pH 5
M axOLR maximum organic loading rate
M axS maximum allowed gas storage
M HRT minimum hydraulic residence time
M inOLR minimum organic loading rate
M inS minimum allowed gas storage
M OLR maximum sustainable organic loading rate
n number of subsamples
Ni nitrogen fed in an interval i from m different substrates
nj nitrogen concentration substrate j
N ob Number of observations
N Sj updated biogas yield curve or step response from substrate j
Oi substrates organic dry matter fed in the interval i
oDM organic dry matter
odmj organic dry matter substrate j
OLRi organic loading rate in the interval i
P energy matrix
PaD air pressure between digester membranes
PaS air pressure between storage membranes
Patm atmospheric pressure
Pg k,i gas pressure of tank k at interval i
PgD pressure gas digester
PgS pressure gas storage
Ppipe pipe pressure
pGE energy generated from the feedings prior to the optimization interval Qj vector with the quantities of substrate j
RLi required load at time i
rpmD revolution per minute fan digester
rpmS revolution per minute fan storage
Sj biogas yield curve or step response from substrate j
t time
Tg k,i gas temperature of tank k at interval i
T N 273.15°K
T Ni average nitrogen fed until interval i in 24 hours from m different substrates
T V Mi total gas volume measured at interval i
ub maximum substrate quantity vector
Vk,i gas volume at operating conditions of tank k at interval i
Vsubsample subsample volume
Vtrapped air volume between three valves
V Mk,i gas volume measured of tank k at interval i
V NS gas volume at standard conditions of storage
V ND gas volume at standard conditions of digester
V Nk,i gas volume at standard conditions of storage k at interval i
V price price vector
W P(Tg k,i) water vapor correction factor based on gas temperature of tank k at interval i
x vector substrate quantities
Xi quantities of m different substrates fed in an interval i
Chemical compounds C carbon CH3CH2OH ethanol CH3COO− acetate CH4 methane Co cobalt CO2 carbon dioxide
CoCl26H2O cobalt dichloride hexahydrate
Cu copper F e iron H2 hydrogen H2O Water H2S hydrogen sulphide M n manganese M o molybdenum N nitrogen N H3 free ammonia N H4−N ammonium nitrogen N H4+ ammonium ion N i nickel
N iCl26H2O nickel chloride hexahydrate
P phosphorous
Se selenium
Zn zinc
RSD relative standard deviation
ADM1 Anaerobic digestion model No 1 AT activity test
BMP biochemical methane potential CCM Corn Cob Mix
CHP combined heat and power COD chemical oxygen demand
CSTR continuous stirred tank reactors DM dry matter
EPEX SPOT SE european power exchange
FOS/TAC is equivalent to VFA/TIC but in german language HRT hydraulic residence time
OLR organic loading rate ppm parts per million PV photovoltaic
SRT solid residence time TIC total inorganic carbon TOS theory of sampling
UASB upflow anaerobic sludge blanket VFA volatile fatty acids
Abstract
The increasing share of alternating renewable energies from wind and solar introdu-ces the neintrodu-cessity of flexible power generation to reduce the gap between production and demand. Flexible power generation can be provided by fossil fuels but in the long term it should be provided by renewable energies. Biogas plants can provide flexible power generation in a wide range but the existing plants are designed to provide base load.
Flexible power generation can be improved by increasing gas storage capacity, but the ability to provide a load profile is limited. A further improvement is achieved by changing the current continuous feeding to feeding on demand where the biogas plant is fed according to load requirements.
Three technical aspects were identified in this thesis to improve the flexible power potential of existing plants using feeding on demand; online monitoring, improved gas volume measurements and feeding model. These were implemented in a full-scale biogas plant.
Changed feeding schedule may generate process disturbances that require rapid de-tection to provide certainty to the operator and avoid economic losses. A digester is a highly heterogeneous system in distribution and composition making samples unrepresentative. An online monitoring system was developed and patented, imple-menting the guidelines of sampling theory. Possible bias generated by the operator is avoided and a higher density of data is obtained.
Gas volume measurement improvements were achieved, including the development of a gas management system to optimize the existing storage.
A prediction model of biogas generation kinetics was developed based on heuristic knowledge, updated based on the system response. Mathematical description was achieved but for implementation further improvements of gas volume determination are required to accurately calculate gas production.
Improvements developed in this thesis make plant operation simpler and more cer-tain; their use could optimize at least 2.73 GW flexible power in Germany.
Der zunehmende Anteil alternativer erneuerbarer Energien aus Wind und Sonne erhöht die Notwendigkeit einer flexiblen Stromerzeugung, um die Differenz zwischen Produktion und Nachfrage zu verringern. Die Stromerzeugung kann flexibel durch fossile Brennstoffe erfolgen, langfristig sollte dies jedoch aus erneuerbaren Energien stammen. Biogasanlagen könnten eine flexible Stromerzeugung in einem hohen Maß gewähren, aber die vorhandenen Anlagen sind nur für die Grundlast ausgelegt. Die flexible Stromerzeugung kann durch Erhöhung der Gasspeicherkapazität verbes-sert werden, dennoch ist die Bereitstellung eines Lastprofils begrenzt. Eine zusätz-liche Verbesserung wäre die Änderung der aktuellen kontinuierzusätz-lichen Fütterung in eine bedarfsabhängige Fütterung, bei der die Biogasanlage entsprechend den Last-anforderungen des Netzbetreibers gefüttert wird.
In dieser These wurden drei technische Aspekte (Online Überwachung, verbesserte Gasvolumenmessungen und Fütterungsmodell) identifiziert, um das flexible Energie-potenzial bestehender Anlagen durch die bedarfsabhängige Fütterung zu verbessern. Dieses wurde bereits auf einer kommerziellen Biogasanlage umgesetzt.
Ein geänderter Fütterungsplan kann Prozessstörungen verursachen, die eine schnelle Erkennung erfordern um dem Betreiber eine Sicherheit zu geben und wirtschaftliche Verluste zu vermeiden. Ein Fermenter ist hinsichtlich des Mischverhaltens und unter-schiedlicher Fermentationsstadien ein sehr heterogenes System, weshalb die Proben nicht repräsentativ sind. Es wurde ein Online-Überwachungssystem entwickelt und patentiert, das sich nach der Probeentnahme Theorie richtet. Durch das Anwen-den des Systems vermeidet man eine mögliche Verzerrung der Analyse durch Anwen-den Betreiber und erhält eine höhere Datendichte.
Eine Verbesserung der Gasvolumenmessung wurde erreicht mit der Entwicklung eines Gasmanagementsystems, dass die vorhandene Gasspeicherung optimiert. Basierend auf heuristischem Wissen wurde ein Vorhersagemodell für die Biogaserzeu-gungskinetik entwickelt, das sich abhängig von der Systemanforderung aktualisiert. Ein mathematisches Modell wurde hergeleitet, jedoch für die Implementierung sind weitere Verbesserungen der Gasvolumenmessung notwendig, um die Gasproduktion genau zu berechnen.
In dieser Arbeit entwickelte technische Verbesserungen sorgen für einen einfachen und sicheren Betrieb der Anlage. Der Einsatz dieses Systems könnte in Deutschland mindestens 2,73 GW flexibler Leistung aus Biogasanlagen optimieren.
1. Introduction
1.1. Background
According to the German Renewable Energy Act (2017), the percentage of renewable energy technologies as a part of all electricity production in Germany should be between 40 - 45% by 2025 and 55 - 65% by 2035. In order to achieve this target, technologies with the lowest levelized cost of energy are chosen, such as wind and PV [1]. From 2017 to 2019 the expansion of new biomass plants was limited to 150 MW per year. Within the same period, the limits for PV are 2500 MW per year, onshore wind 2800 and offshore wind 6000 MW per year.
This large increase of intermittent renewable energy producers makes it necessary to introduce or promote technologies to balance production and demand. These technologies are flexible power plants, demand side management, storage technolo-gies and grid extension[2, 3]. Within renewable technolotechnolo-gies biogas plants have the advantage in that they have their own storage and therefore power production is flexible. Power supply can be provided when the highest demand is required and reduced in periods of overproduction.
In addition, power production for biogas plants does not depend on weather condi-tions. This can be observed after comparing the electricity generated to the installed capacity of different renewable energies in Germany in 2016. According to [4], the largest producer was wind energy with 77.4TWh generated with an installed ca-pacity of 49.5GW followed by solar PV with 38.2TWh generated with an installed capacity of 41.3GW. Biogas plants in comparison had generated 34.6TWh with an installed capacity of about 5.72GW. The resultant average load factor1 of : wind
17.8%, solar PV 10.5% and biogas 69.2%. The higher load factor of biogas indi-cates a larger percentage of hours producing at nominal capacity compared with intermittent renewable energy producers like PV or Wind.
The benefits of producing power on demand with biogas plants has been presented in many studies. In [5], it is shown that biogas plants are a cost-effective option for improving the integration of intermittent renewable energy systems due to its capacity to reduce surplus energy when required. Also the cost of additional flexible options can be reduce by flexible biogas plants. Similar results are presented in [6] where a potential reduction up to 30 % in daily residual load can be obtained
by flexible operating the existing bioenergy plants in the TransnetBW transmission system. In [7], it is shown that flexible operated plants can reduce the need for grid expansion.
Furthermore, the green-house emissions from biogas plant-derived electricity is sig-nificantly lower than gas steam power stations, another alternative that is used to provide flexible power [1]. This study considers the flexible operation of biogas plants with constant biogas production and endless gas storage.
Biogas plants can also receive economical benefits by changing to a flexible biogas operation under the German Renewable Energy Act [8]. Flexible biogas operation is mandatory for the successful implementation of biogas plants in countries where there is not a Fixed feed-in tariffs support schemes and the plants are forced to produce when the electricity price is high in order to be economically feasible. The ability to generate power on demand is required to improve the economical feasibility of the existing power plants and it is mandatory for the development of future projects within the Renewable Energy Act in Germany.
Two main alternatives to improve the capacity of existing biogas plants that deliver balancing power are presented in [9]:
• Biogas storing concepts. These include an increase of the existent gas storage capacity or the use biogas upgrading units to transform biogas to biomethane. The first concept of increased gas storage capacity was found in [9] as the best suited configuration to supply flexible power generation in the short term. The second concept includes biogas upgrading units which implies a higher investment and depends on the local net conditions. The main advantage is the access to the large gas storage usually available in the gas grid, which will decouple between biogas generation and use.
• Feeding on demand. This consists of modifying the feeding program in order to change the biogas production when it is required. The existing gas storage capacity can be saved for over-production events from other renewable energies like wind or solar or to increase the ability to deliver a high variable load profile. There are two alternatives to generate flexible biogas production: using the existent digester configuration or modifying it, including additional fixed bed reactors to ferment the liquid fraction after hydrolysis. These reactors have been shown to be stable and have fast biogas production response after a feeding [10]. The focus of this work is conventional biogas plants. The fixed bed reactors will not be examined in this study. With the help of feeding on demand the need of an expanded biogas storage is decreased or avoided, making this alternative economically attractive.
The main obstacle to exploit this potential is that the existing plants are not de-signed for flexible energy generation. Prevailing design parameters are: substrate characteristics and availability (which determine the electrical output and digester volume), heat (self-consumption and possible heat use concept) and digestate usage
1.2 Problem statement
(chemical composition of the fertilizer to determine the irrigation area). Hourly electricity prices or variable electricity power requirements (load profiles) are not considered in the design. The feeding program is characterized by an even distri-bution of the substrate as the largest economic benefit was given by a constant electricity production at its maximum power. The gas storage is a buffer of the production and its volume measurements are not accurate.
1.2. Problem statement
In order to maximize the flexible biogas power potential of the existing plants using feeding on demand it is necessary to overcome the following technical aspects: Feeding model: Current biogas feeding programs are characterized by constant and equally distributed substrate quantities in time. As a result, the biogas production is almost constant and they provide base-load. It has been shown by [11, 12, 13, 14, 15] that flexible biogas production can be generated by modifying the feeding program of the plant. Feeding programs are based on model predictions which need extensive calibration which is not always practical at the biogas plants.
Online monitoring: changes in the feeding program can generate process imbalances that must be detected on time to avoid large disturbances on the biological process and the possible economical loss.
Gas storage: Gas holders are intended to buffer the biogas production and store the gas during maintenance for that reason, the volume accuracy and storage capacity of gas holders are not of major importance [16]. Weather effects are not considered and it can generate loss of biogas especially at high filling levels.
1.3. Objectives
In order to provide a solution to the problem the objectives are defined as follows: • Develop a heuristic biogas model that enables the generation of feeding
pro-grams restricted by commonly used parameters of the biogas industry. Feeding programs should optimize the usage of the existing gas storage allowing the plant to deliver a wider range of loads as well as to provide system services, such as offering control power in balancing markets.
• Develop an online monitoring system that allows the continuous supervision of the biological process. Sampling acquisition should be representative for the digester, automatic, and able to generate high data density. Online mea-surements should be adequate to characterize the stability of the anaerobic digestion process.
• Improve gas storage volume measurements and define operating ranges where the measurements are accurate and weather effects are minimized.
2.1. Anaerobic digestion
This is a biological process in which organic materials are decomposed through the cooperation of different bacterial and archaeal groups in the absence of oxygen. In the process large organic molecules are broken down into smaller single molecules producing biogas and digestates as final products. Biogas is a gas mixture of different gases; methane CH4(50-70%), carbon dioxide CO2(30-50%), hydrogen sulfide (in
ppm ), and other trace gases. Composition of the different fractions depends on the feedstock characteristics [17]. Digestate, on the other hand, is a mixture of difficult to degrade organic substances (lignin) and inorganic residues (salts). Its nutrient content also depends on the characteristics of the inputs. In comparison with manure due to the high degree of mineralization of digestate, its nutrients are easily available for the soil improving their characteristics as a fertilizer [18].
2.1.1. Operating Temperature
Biogas process can be developed at 3 temperature ranges. Themophilic 55-60 °C
Mesophilic 35-40°C
Psychrophilic <30°C
Fermentation processes are faster at high temperatures and for that reason in many commercial applications Hydraulic Residence Time (HRT) is reduced decreasing digester size and investment cost. The number of microorganisms at thermophilic conditions is lower compared with mesophilic conditions which makes the system more sensitive to temperature changes (allowed temperature variation±1°C). On
the other hand, the number of microorganisms in the mesophilic temperature range is much larger, which makes the process more stable. Temperature variations of
±3°C are possible without a big change in biogas production [19, 20]. Due to the
low degradation speed psychrophilic conditions are not normally used in industrial operations[18].
Digestion in mesophilic conditions is a more robust and stable process than in ther-mophilic conditions not dependent on feedstock chemical composition and Organic Loading Rate (OLR), see sec. 2.1.4[21].
2.1 Anaerobic digestion
Tests and measurements developed in this work were done on a digester operating at mesophilic conditions.
2.1.2. Stages of anaerobic digestion
The anaerobic digestion process is divided into 4 distinct reaction, in which 5 main trophic groups of bacteria are identified. Optimum pH ranges for hydrolytic aci-dogenic bacteria are between 4.7 to 7 while for methanogenic archae the range is between pH 6.8 -7.8. These ranges imply that in a single tank reactor it is nec-essary to compromise to keep the conditions favorable for all microorganisms. On the other hand, a cascade system of two tanks has the advantage of allowing opti-mum conditions for each microorganism; however in the first tank, hydrolysis gas is produced and requires treatment to avoid negative environmental consequences and safety risks [22]. Fig. 2.1 presents the stages of anaerobic digestion divided for one and two steps process.
Figure 2.1.: Steps of biogas production and bacteria trophic groups involved.
Adapted from [23], [20],[24]
Hydrolysis. Hydrolysis is the decomposition of molecules in water. In this step
to decompose insoluble organic compounds, such as carbohydrates, proteins, and fats into soluble sugars, amino acids, and long chain fatty acids.
It is important to differentiate the above chemical definition of hydrolysis from the first step of a two-step anaerobic digestion plant. Two step plants have a hydrolysis tank which is operated at a low pH (normally 5.5 - 6) to improve degradation conditions and avoid methane generation. In this tank, hydrolysis gas (H2 +CO2)
is produced, together with fatty acids and alcohol. This is therefore a large part of the acidogenesis step.
The rate of hydrolysis depends on particle size, pH, enzyme production, and diffu-sion and adsorption of enzymes by organic compounds[24]. The decomposition of cellulose and hemicellulose is a main factor slowing organic fermentation.
Acidogenesis.
In this step, fermentative (acid forming) bacteria transform hydrolysis products into hydrogenH2,carbon dioxideCO2, alcohol and short chain fatty acids (formic, acetic,
propionic, butyric and pentanoic).
Concentration of the products formed at this stage depends on the hydrogen partial pressure. Low partial pressure corresponds to a higher production of acetic acid [20].
Acetogenesis.
Products of acidogenesis will be converted by acetogenic bacteria into acetic acid (acetic acid anion), hydrogen, and carbon dioxide. Acetogenic bacteria are obli-gate syntrophs 1[17]. Hydrogen is released by their metabolism and is toxic for
them. Therefore, there is a symbiosis between acetogenic bacteria with autotrophic2
methane bacteria that use hydrogen (hydrogenotrophic). Syntroph bacteria and methanogenic archaea must live in very close proximity in flocks or biofilms to be able to transfer hydrogen, see Fig. 2.2
The free energy of reaction 4G of the main acetogenesis reactions is positive (see
Tab. 2.1) implying that the reaction is only possible with the addition of energy. This energy is supplied by the methanogenesis reactions thus forming a symbiosis. Syn-troph bacteria and methanogenic archaea prosper at the limit of thermodynamically possible energy gain[19]. For this reason they grow comparatively slowly and cannot easily adapt to sudden changes. Their activity can be reduced by sudden increases in the loading rate, feedstock, pH and temperature fluctuations, for example.
1They must act together with bacteria in a different trophic group to digest a substrate
2An organism that produces complex organic compounds (such as carbohydrates, fats, and
2.1 Anaerobic digestion
Figure 2.2.: Interspecies hydrogen transfer. Source [25].
Table 2.1.: Example of acetogenesis reaction. Conversion reaction from alcohol to
acetic acid. MGo is the change of the free energy at standard conditions
CH3CH2OH +H2O →CH3COO−+H++ 2H2 MGo= +9.6kJ/mol
The Gibbs energy of the above alcohol reaction can be negative when the temper-ature is increased (thermophilic) or pH is reduced allowing acetogenic bacteria to complete the reaction with a minimum energy gain.
Hydrogen is a key parameter to determine the stability of the biological process because high concentrations inhibit acetogens, thus hindering the transformation of long chain volatile fatty acids, decreasing pH and impeding methane formation. Increased concentrations of hydrogen or volatile fatty acids (VFA) give an indication of an instability in the process.
In this step, two trophic groups of bacteria are also present. These are homoaceto-genic bacteria, which reduce hydrogen levels producing acetic acid and syntrophic acetate oxidizing bacteria that work in the opposite direction.
Methanogenesis.
In this last step, acetic acid, hydrogen and carbon dioxide are converted by methanogenic archae into carbon dioxide, water and methane. This group of archaea is divided in two subgroups: hydrogenotrophic (hydrogen consumers) and aceticlastic (acetic acid consumers).
Table 2.2.: Standard free energy of main methanogenic reactions
Hydrogenotrophic archaea CO2+ 4H2 →CH4+ 2H2O MGo =−131,0kJ/mol Aceticlastic archaea CH3COO−+H+→CH4+CO2 MGo=−35,9kJ/mol
that both can provide energy to the acetogenic bacteria, see Tab. 2.1. Methanogens have a higher affinity to hydrogen than to acetates.
During anaerobic agricultural digestion, methane production at plants with a large Organic Loading Rate (2.5 - 3kg oDM/(m3·day)) is dominated by hydrogenotrophic
archaea with an important presence of syntrophic acetate oxidizing bacteria [19]. Furthermore, [26] found a mixture of hydrogenotrophic bacteria and acetoclastic archaea in three parallel digester feeds with energy crops operating at an OLR of
3.5kg oDM/(m3·day) . On the other hand, at plants with a low OLR and in waste
water treatment plants methane production is dominated by aceticlastic archaea.
Other reactions
Gas quality is affected when sulfur rich feedstock is processed at a biogas plant. Sul-phur is transformed into hydrogen sulphideH2Sby reducing bacteria. The resultant
increase inH2S causes corrosion within the engine which powers the generators and
consumes hydrogen that is essential for methanogenic archaea function.
Hydrogen sulfide is reduced to elementary sulphur by aerobic bacteria through an oxidative reaction termed biological desulphurization; the sulphur is then carried by the digestates which increases the fertilizer value. This aerobic reaction is made possible by the addition of air to the gas storage (3.5- 4,5% of the gas production)[20]. The drawback of this is that elementary sulfur can serve as a initial material forH2S
production, decreasing the overall efficiency of biological desulphurisation[27]. Another method to reduceH2S is by adding iron salts. The iron salts bind to H2S
to form solid iron sulphide while still within the liquid phase. Iron sulphide is then removed with the digestates.
2.1.3. Nutrients
In addition to nutrient groups (carbohydrates, proteins, and fats), microbial mi-croorganisms must also be provided with vitamins, enzyme, hormones and minerals (macronutrients and trace elements) that they do not produce on their own but are essential to their normal function. A balanced ratio of the different macronutrients and micronutrients is important for efficient fermentation.
Macronutrients.
Microorganisms are composed on average of 50% carbon, 11 % nitrogen, 2% phos-phor, and 1% sulfur. These elements must be provided for an efficient process. The quantity of a single nutrient is not as important as the ratio between the concen-trations. The recommended C/N/P ratios in digesters are between 100:5:1 and
200:5:1[18]. The optimum C/N ratio for anaerobic digestion is defined as between
2.1 Anaerobic digestion
Trace elements.
Trace elements or micronutrients are those of which the average concentration is lower than 50mg per kg of biomass. Required elements are cobalt (Co), nickel
(N i), (M o), (Se) and iron (F e). Some bacteria require zinc (Zn), copper (Cu) and
manganese (M n).
The required quantities are specific to the respective populations and are difficult to determine because of the vast variety cultures and their adaptability. Low trace elements concentrations may inhibit enzyme production and thereby interfere with the metabolism of the methanogens. Fermenting bacteria are not affected by this deficiency of trace elements which leads to an accumulation of VFA . If the acids content exceeds the buffer capacity of the digestates, it can cause a destabilization of the biogas process [30]. In [31] it was found that addition of trace elements effects methane production and microbial composition. In [32], a slowly decrease of trace elements deficit did not effect methane production but generates a shift within methanogenic community. The long term stability of the system could not be determined.
Trace elements react with H2S to form poorly soluble metal sulfides that are not
readily available to the methanogenic archaea [27, 30]. For this reason, it is impor-tant to reduce H2S levels first before adding trace elements, to guarantee that they
are available for the process.
Minimum concentrations of trace elements depend on the exposed organic load [33]. Reference concentrations used in the industry areN i >0.3, Co >0.12−0,16, M o >
0.2 and Se > 0.01− 0.02 which are in good agreement with the trace elements
requirements at the lower and middle organic rate. Organic Loading Rate
Element mg/kg Low Middle High
N i 0.4 0.6 0.8
Co 1.2 1.6 2.2
M o 0.4 0.45 0.5
Table 2.3.: Trace element minimum concentration and OLR. Adapted from [34]
2.1.4. Process parameters
The following parameters can be modified by feeding schedule and feedstock char-acteristics.
Ammonia inhibition
Ammonium nitrogen(N H4 −N) is produced by the biological degradation of
ni-trogenous matter [35]. In practice this mineralization percentage is estimated based on previous measurements in plants fed with similar substrates.
There are two principal forms of inorganic ammonia: Free ammonia N H3 and
Am-monium ion (N H4+). Both compounds are in an equilibrium that depends on the
temperature and the pH of the solution3. Free ammonia is toxic for the
micro-bial community, especially for the acetoclastic methanogens [35], but with time, methanogenic bacteria can adapt to higher ammonia concentrations [37].
Different concentrations of N H4 −N have been reported in literature to produce
varying levels of inhibition in the process4. Concentrations lower than 5kg(N H 4 − N)/M g are described as causing a modest inhibition [37]. Also, a concentration
between 3 and 5kg(N H4−N)/M gcan cause inhibition due to the dependence of pH,
temperature and the adaptation of the substrates to a high ammonia concentration .
Hydraulic residence time (HRT)
HRT is the average residence time of the feedstock inside the digester. There is a large interest in the industry to reduce the residence time in order to reduce the investment cost, but a reactor operated with a short HRT causes methanogens to be washed out from the system. Maintaining a high residence time is important for a stable operation, better tolerance to toxicity, higher load and faster recovery [38]. Each substrate has its own degradation time5. The minimum hydraulic residence
time (M HRT) can be described as the minimum residence time required by any
of the feedstocks in the mixture that will be fed into the digester. The resulting residence time is dependent on the feedstock that requires the longest residence time and this can generate larger design volumes which make the investment of the biogas plant infeasible.
Another aspect to consider is the feedstock mixture in co-digestion plants. This is especially important to plants dealing with manure and energy crops. Short residence times (below 50 days) can only be achieved by biogas plants with a large percentage of manure > 80%, while for biogas plants operating with 100% energy crops residence times of more than 100 days are required [39]. A typical residence time in biogas plants in Germany is between 60 and 90 days [40].
3At higher pH levels, the equilibrium moves towards ammonium ion and at a higher temperature
towards free ammonia [36]
4Direct Calculation of (N H
3) is not often used in practice due to the difficulty of measurement[37]. 5The degradation time of substrates rich in fats is much shorter than substrates containing
2.1 Anaerobic digestion
Note: The work reported in this thesis focuses on wet fermentation, in which HRT is equal to Solid Retention Time (see sec. 2.1.5).
Organic loading rate (OLR)
The OLR defines the daily feeding rate of organic dry matter (oDM) per unit
di-gester volume. Higher OLR requires a smaller reactor volume and lower capital cost. However, an increase in the OLR above a maximum sustainable organic load-ing rate (M OLR) would lead to higher hydrolysis bacterial activity rather than
methanogenic bacterial activity. This effect would increase VFA, and cause an irre-versible acidification[41].
Variation of the OLR has been used to shape microbial populations, allowing the di-gester to recover faster from stress periods and non-optimal conditions (see sec. 2.1.7). Typical values for wet fermentation are between 2 to 4kg oDM/(m3 ·day) [42].
Dry matter (DM)
Inadequate mixing conditions hinder the efficient transfer of organic material to the active microbial biomass [43]. The DM value is used as a parameter to estimate the mixing conditions inside the digester even though they are dependent on the viscosity of the digestates. The reason is that the dry matter is simple to measure on site and is a well-known parameter used by the operators.
Digestate viscosity varies with the characteristics of the substrate mixture as shown in [44] where different feedstock mixtures with the same dry matter have different viscosities. The viscosity and the design of the mixing system [45] as well as the addition of supplements like enzymes can affect mixing conditions[46].
Wet fermentation reactors fed with energy crops and manure usually have dry matter content below 16% [43]. As an alternative to determining dry matter in the reactor content, it is possible to limit the maximum DM in the input material.
2.1.5. Type of reactors
There are different reactor configurations according to the substrate characteristics and design philosophy of different manufacturers (e.g., reactors treating waste water require a larger (SRT) than the hydraulic retention time to improve the amount of solids that are hydrolized ). Tab. 2.4 comprises the classification criteria.
Table 2.4.: Classification criteria anaerobic reactors
Feeding Fermentation steps Temperature Dry matter Solid Residence Time (SRT) Continuous 1 step Mesophilic Wet fermentation SRT= HRT Batch 2 step (Hydrolysis) Thermophilic Dry fermentation SRT>HRT
more steps Adapted from [20]
Dry batch reactors
Reactors of this type are normally used with substrates of high dry matter content (30 - 40%). Feedstock is fed once and then inoculated with the leachate from a previous batch. This kind of reactor does not have mechanical agitation so the contact of the substrate with the microorganism is supported by the re-circulation of leachate. There are many alternative heating systems, the most common is to heat the leachate using an external heat exchanger. Electricity consumption is lower as its mainly used is for the leachate recirculation pump.
One of the main advantages of dry fermentation is that can it handle higher per-centages of contaminants and, for that reason, is normally used to treat the organic fraction of municipal solid waste [47].
The main disadvantage of this system is that it requires the combination of many re-actors in order to achieve a semicontinuous biogas production. Methane production per unit of feedstock is not maximized [17].
Dry continuous reactors
Dry continuous reactors are of the plug flow type. Feedstock enters the system at one end and flows through the reactor until reaches the other end, in this way different retention times are avoided. Dry fermentation systems allow for an OLR between 7 and 10kg oDM/(m3·day)[20]. There are three main types[47]:
• Vertical tank: in which new feedstock is mixed with digestate and enters at the top of the tank. Due to its own weight, the material moves to the bottom where it is collected (e.g DRANCO process).
• Vertical tank with horizontal plug flow: In this case material is obliged to move horizontally in the vertical tank due to the separation baffle that covers 2/3 of the diameter. Pressurized biogas is injected at the bottom for agitation
(e.g. Valorga process).
• Horizontal Tank: Feedstock enters at one end and is moved using a series of high capacity agitators to the other end. Kompogas, Thöni and similar processes
2.1 Anaerobic digestion
Fixed Bed Reactors
This kind of reactor is common in the treatment of waste water with low dry matter content but a with a high organic load. The SRT is longer than the average HRT keeping high concentrations of biomass in the reactor with a low treatment time. As a part of flexible power generation, these kinds of systems are installed as the second step of an anaerobic digestion plant (acetogenic and methanogenic). Liquid input for the fest bed reactor can either be generated in a hydrolysis tank with a further separation[48] or from leachate produced in a leach bed (dry batch) reactor [49, 50]. The main advantage of this system is that the liquid fraction containing fast digestible dissolved organic compounds can be stored and when needed be sent to the fixed bed reactor generating a flexible gas production[48].
Microbial organisms are retained in the reactor through a packaging medium which prevents bacteria washout. This configuration supports high organic loads as well as periods of starvation / low or no load.
Continuous Stirred Tank Reactors (CSTR)
This reactor type normally operates with dry matter between 2 and 12%; however, this limit is only a guideline as the operation also depends on the feedstock viscosity in order to achieve reactor homogenization [51]. In these reactors HRT and SRT are the same. Due to the continuous stirring, the microbial organisms are not retained so there is a risk of bacteria washout. The minimum HRT time should be longer than the doubling time of both the syntroph bacteria and the methanogenic archaea (see sec. 2.1.4). Maximum OLR are between 2 and 4kg oDM/(m3·day)[42].
One or two steps fermentation are possible depending on the feedstock and design philosophy. Mixing is one of the most important aspects in the design of the system. There are different configurations possible according to the feedstock characteristics and design[17]. Frequent and high-speed mixing regimes are detrimental for the process because the generated shear stress can destroy flocks or biofilms formed by the communities of syntroph bacteria and methanogenic archaea, which are required for hydrogen transfer [18] (see sec. 2.1.2).
CSTRs are the most common type of digester in agricultural plants in Germany and allow the treatment of both liquid and solid feedstocks [40, 22].
Tests and measurements developed in this work were done on this type of reactor.
2.1.6. Process stability
The efficient and stable operation of reactors relies on a relationship between fer-menting bacteria, specialized acidogenic and acetogenic syntrophs, and methanogenic bacteria with diverse parallel pathways for substrate metabolism [52]. For energy
production, a microbial community must have a stable metabolic function over time, despite the perturbations that can occur in real life [53].
Stability of a system is commonly determined in two ways: performance indicators (pH, Chemical Oxygen Demand (COD) removal, VFA, ratio between VFA and Total inorganic Carbon (TIC)) and functional stability of the microbial community [54]. Common practice is to assess the stability of a system using performance indicators (see sec. 2.5.1) which can be measured in commercial plants.
Information about population characteristics is often not available as this requires trained personal and specialized equipment not usually available in biogas plants. A change of microbiome composition (i.e decreasing of methanogenic population) can be potentially used as an early indicator of process instability [55, 56]. The most widely used methods in determining microbiome of anaerobic digestions are denaturant gradient gel electrophoresis (DGGE), Fluorescent in situ hybridization (FISH), cloning of 16S rDNA, and Terminal restriction fragment length polymor-phism (tRLFP). A review of these techniques can be found in [57, 56].
Functional stability does not imply community stability. A well performing digester at constant functional properties pH and COD can have an extremely dynamic community even at constant conditions [54]. In order to asses functional stability the following three ecological parameters must be involved [58, 53, 59].
Microbial community diversity (Richness)
The diversity of the microbial community gives an indication of the existence of parallel pathways for degradation of organic compounds and such diversity provides a more robust functionality over time [60, 61]. A minimum level of diversity in the microbial community is required to achieve functional stability [52, 62].
It is possible to have stable reactors with low diversity indexes. In this case, it is the flexibility of the community that ensures stable operation.
Evenness of microbial community structure (functional organization)
The evenness of the microbial community structure is determined by the distribution of dominant and resilient microorganisms. Low evenness implies that only a few of the many species are in dominant numbers. Intermediate evenness is characteristic for a robust system as the community has more capacity to use its varied array of metabolic pathways[53].
Decreases in microbial evenness can be used as a warning indicator [59].
Microbial community dynamics
The dynamics of the microbial community concerns the number of major species that on average come to significant dominance during a defined time. This varies because
2.1 Anaerobic digestion
shifts in the type of community present have been observed in both functionally stable and unstable reactors [59]
Population dynamics that keep functionality after a disturbance over time can be seen in three mechanisms [63].
• Resistance: The degree to which microbial composition remains unchanged in the face of a disturbance.
• Resilence: The rate at which microbial composition returns to its original composition after being disturbed.
• Redundancy: The ability of one microbial taxon to carry out a process at the same rate as another under the same environmental conditions.
2.1.7. Management strategies in anaerobic digestion
The microbial community in reactors can be shaped to enhance methane production, to improve resistance to high nitrogen levels or to operate at high organic loads.[59]. Management strategies can be divided into 1) microbial based strategies which di-rectly affect microbial community and 2) operational based strategies which affect the community indirectly .
Microbial based strategies
• Inoculum: An acclimated microbial consortium with balanced nutrients that is used to accelerate the start up of the digestion process [64, 65, 66]. Reportedly three different sources of inoculum were able to gradually adapt and generate a functional microbial community to produce biogas from maize [67]. The inoculum from a plant processing maize silage enables a faster start up. Results indicate that the effect of inoculum is time limited.
• Bioaugmentation: The addition of a particular species or consortium of species could allow plant operators to change the existing microbial community to op-timize processing of certain feedstocks or operation at defined conditions [68]. Bioaugmentation presents some technical issues such as bacteria strain isola-tion and maintaining the bacterial augmenter in the digester over time[69]. Successful bioaugmentation has been reported to modify the bacterial popula-tion to improve hydrolysis and acidogenisis, while few successful investigapopula-tions reported the use of methanogens due to their high sensitivity to stress condi-tions [70].
Operational based strategies
• Feedstock modification keeping OLR constant: Substrate changes have been found to have no effect on VFA concentration but decrease the total alkalinity
[71]. Moreover, three reactors initially similar, attained a complete different microbial composition after being fed three different kinds of feedstock, show-ing that archaeal population is strongly influenced by feedstock composition [72]. Additionally, a comparison of 78 anaerobic digester samples, found that digester bacteria are clustered by feedstock type [73].
• Feeding schedule modification keeping OLR constant: In one study methane production and bacterial population of two different feeding scenarios were compared keeping the OLR constant. The first was a shock loading with 100 % glycerol and the second a gradual increase in glycerol until the same percentage. Different feeding approaches led to different bacterial population, both are functional for methane production [74]. Another study used three different feeding schedules comparing feeding every 2 hours, once a day and once every two days [75]. In both studies, an increase in VFA occurred after the less frequent feeding but returned to the normal levels before the next feeding [74, 75]. Furthermore, a higher biogas production was achieved after a feeding event in the less frequent schedule but the total biogas production did not increase [75, 76]. Variation in performance of lab reactors operated in parallel is attributed to inoculum heterogeneity and random factors that affect microbial community structure [76]. In contrast, two full-scale reactors operated as parallel reactors presented similar microbial communities [26]. Variations to microbial structure can also be explained by the different conditions generated in a lab reactor compared with full scale (ibid). All the studies conclude that, at the same OLR, changes in feeding intervals influence the bacterial community composition, while methanogenic communities remained stable. A high degree of functional stability was achieved while changing the feeding pattern, in spite of this alteration of evenness, dynamics and diversity of the bacterial community (see sec. 2.1.6). The process became more tolerant to high levels of ammonium and high organic loading rates [77, 75].
• Modification of OLR: An increase of the OLR from 2.11 to 4.25kg oDM/(m3· day) was successful but was followed by an increase of VFA, which after a
few weeks of adaptation returned to the original levels [78]. Additionally, an increase in the diversity of the bacterial communities was found as the result of an OLR increase. However, archaeal communities remained almost constant. The OLR was increased until the reactor failed by increasing VFA and decreasing buffer capacity [79]. In [69], faster acid processing was found after an initial OLR increase which induced a shift of the microbial community. These results show that tolerance to OLR variation can be built up in anaerobic digesters, and the response of digesters exposed to variations in OLR depends on past operation.
• Modification of HRT: In [80], it was demonstrated that variation of HRT and OLR can influence and even control the presence of single bacterial groups. However, digesters fed under the same conditions do not generate a unique community structure linked to the process parameters.
2.2 Operational flexibility of electric power systems
• Temperature modification: Temperature plays a major role in the microbial composition of the system (see sec. 2.1.1). In [81], the effects of a temperature increase from 32 to 52 °C were evaluated in an Upflow Anaerobic Sludge Blan-ket (UASB)6. They observed that a temperature increase drastically effects
the microbial community and therefore operational performance. A higher performance was found at 37°C.
• Ammonia resistance: In [82], an increase in nitrogen levels changed the bac-terial population, shifting it from the acetoclastic to the hydrogenotrophic methane pathway, which is well known to be more robust against ammonia toxicity. Improve microbial diversity makes it possible to process high nitrogen content substrates, however, this adaptation, which depends on the nitrogen level will not always be enough to avoid a process failure. Three bacteria clusters were identified as changing numbers according to total ammonia con-centration and temperature [83]. Moreover, no significant differences in the methanogenic groups could be observed between these clusters [83]. The first cluster in this study was characterized by low nitrogen concentration, low free ammonia concentrations and more stable conditions (ibid).
2.2. Operational flexibility of electric power systems
The change in the energy mix according to the German Renewable Energy Act (2017) will be based on technologies with the lowest levelized cost of energy as is the case of wind and PV power. The high share of fluctuating energy sources and their uncertainties in power generation raise the requirements for operational flexibility of the power system to compensate for such fluctuations and supply the resulting residual load.
Operational flexibility is defined in [84] as “the technical ability of a power system unit to modulate electrical power feed-in to the grid and/or power outfeed from the grid over time”. Five major kinds of actions can be identified to increase the flexibility of the power system [85].
1. increase in flexible power generation from renewable energy sources (mainly bio-energy) and conventional energy sources (natural gas and enhanced flexi-bility of coal power plants and CHP units)
2. use of power storage systems and increased sector coupling (power to gas, power to heat, power to mobility)[86].
3. demand side management [87, 88]
4. grid extension for interregional transport and balancing
6This kind of reactor is commonly used for the treatment of waste water. As a difference with the
fixed bed reactor (see sec. 2.1.5), solids are fixed in a blanket of granular sludge which suspends in the tank.
5. improved integration of European electricity grids and markets through transna-tional transport and balancing
Apart from hydro power in which capacity is dependent on the local topographical conditions, bio-energy is the most mature option for renewable energy flexible power generation [89, 90]. However, bioelectricity generation remains more expensive than wind and PV due to the larger weight of the feedstock cost in generation cost and far fewer generating units. Although at the moment flexibility can be provided by fossils fuels, in the long term it must be provided by low carbon alternatives.
2.3. Flexible power generation in biogas
In Germany the Renewable Energy Sources Act (Erneuerbare-Energien-Gesetz, EEG) has, since 2000, promoted renewable energy technologies, like bioenergy, which would not be able to compete with conventional energy technologies under mar-ket conditions. Up to 2012 base-load oriented power concepts were promoted using fixed feed-in tariffs maximizing full load hours independent of demand and electricity prices. EEG 2012 required a change to flexible operation by promoting the increase of installed electrical capacity with the introduction of an optional market premium which made remuneration partially dependent on electricity prices in combination with a direct marketing and flexibility premium [85]. The plants participating in di-rect marketing can gain an additional source of income by providing system services such as control power in balancing markets.
In EEG 2014 direct marketing became mandatory for new biogas plants and they were required to double electrical installed capacity but only feed half of the capacity in any one year. Increased investment cost and the reduction of the electricity price caused by the withdrawal of the bonus for using energy crops which are the main substrate of 78.2% of the biogas plant in Germany [91], halted the development of new projects. Only small 75 kW plants based on manure are still being built. Flexibility premium continues until cover the financing cap of 1350 MW.
EEG 2017 introduced the use of tenders, as previous applicable for Wind and PV, for any new installation. The expansion of new biomass plants is limited to 150 MW per year from 2017 to 2019 while in the same period the limits for PV are 2500 MW, onshore wind 2800 and offshore wind 6000 MW per year. Important here is that existing plants can apply to participate in the tender process and in this way extend their operating contract by 10 years. As a condition they have to deliver regulated power, use a maximum of 50% energy crops and only half of the installed electrical power will be remunerated.
From August 1 2014 until December 31 2018, 900.4 MW additional biogas electrical capacity has been supported by the flexibility premium. The average electrical power of the plants before power increase was 485 kW and the average increase is 474 kW [92]. The expected balancing power generated by the flexibility premium is 2.73
2.3 Flexible power generation in biogas
GW. This value is obtained assuming the same electrical power increase and that 1350 MW will be financed.
The future of existing biogas plants in Germany depends on their ability to deliver flexible power as low carbon provider of grid services with a maximum ramp down and ramp up of 15 minutes [90].
Additional income available for electricity spot prices and balancing markets should cover the additional investment cost required for flexible operation. On the EPEX Spot SE market, the profitability of a demand oriented production strategy depends on average price levels and price variance. Both indicators have fallen in the recent years [85]. Price signals are also not clear for balancing market because wind and PV capacity have tripled from 2008 to 2015, while balancing markets reserves have been reduced by 15%, and cost by 50% [93]. The average balance power use weekly was also reduced from 216 MW in January 2009 to 83 MW in May 2017 [94]. Biogas plant flexibilization is currently one of the main challenges that needs to be overcome to ensure a complete integration of biogas plants into the energy supply system in the future [95]. The crucial components or process characteristics defining the flexibility of the process are [95]:
1. Type of substrate and substrate supply: Substrate characteristics that plays a major role is the degradation rate. Manure has a lower degradation rate than sugar beet. In this sense, if it is required to increase the biogas production to match an electricity peak, this can be done by a punctual addition of sugar beat which will generate a higher peak compared with manure even if both feedings have the same potential biogas production. Trace element and nitrogen content in the mixture also play a role. Even if a substrate does not have a high degradation, feed will be required which will guarantee the balance of nutrients to the microorganism. A further aspect is the capacity to store substrates like household organic wastes, which are difficult to store and should be processed as received. Energy crops can be easily stored as silage and made available when required.
2. Type of conversion process: Depending on the type of reactor (see sec. 2.1.5) their capacity to deliver flexible gas production varies. Fixed bed reactor can support a high organic load and survive for long periods without feeding but require feeding with a rapidly degradable fraction [96]. Most of the agricul-tural plants in Germany are CSTR reactors which cannot support high load variations. Trace elements requirements depend on the applied OLR [34, 33]. It has been observed that the capacity to support high variations of load can be build up according to the feeding used, see sec. 2.1.7
3. Gas storage capacity on site: Flexible power generation implies altering the power output of the plant. The degree of flexibility will depend, in the case of generation on site, on the installed electrical capacity and the available gas storage. Feeding on demand can help to extend the existing capacity by increasing gas production when gas is required and reducing when not. The
limit of this variation will depend on the substrate characteristics and kind of reactor. In [13] a reduction of the gas storage demand of 42% was achieved by the implementation of feeding on demand in a CSTR digester. [97] compared constant feeding and feeding on demand with an ADM1 model. The feeding on demand scenario enable a reduction of gas storage capacity also reducing the investment costs.
4. Type of biogas utilization: Biogas is mainly used for electricity generation. Production and generation are coupled using storage available on site. An im-portant part of the income of existing plants is the sell of the excess heat pro-duced. Flexible generation requires the installation of additional heat storage for which an individual evaluation of the heat profiles is needed to determine storage capacity and characteristics. If the gas is cleaned to biomethane and injected into the natural gas network, production and generation are separated, increasing flexibility.
Not only the capacity but also the speed of the shift are important to characterize the flexibility potential in biogas plants [90].
• short term flexibility (reaction time: 5 to 15 min, duration up to several hours) these implies engine shut down or a substantial decrease of its operational ca-pacity, usually up to 1 h. The implementation only requires control technology for the CHP units.
• mid term flexibility (reaction time: > 15 min, duration according to a weekly schedule). Duration of load alternation is longer than in short term flexibility. Change of load is triggered within a day, of for the next day. Implementa-tion requires CHP overcapacity and enough gas storage. Flexibility can be improved by feeding on demand with corresponding control of the biological process. Heat storage may be required according to existing heat delivery contracts.
• long term flexibility (reaction time: per season, duration months) Reasons for such operation could include seasonal adjustments like: higher heat demand in winter, availability of the substrates and long periods of high production of wind or solar. Implementation requires the whole plant to match long term changes in the operation.
2.4. Anaerobic digestion models
Anaerobic digestion is a complex multistage dynamic process that includes the ac-tivity of several bacteria and archaea groups. How the composition of bacterial groups varies with changes in the feedstock, temperature, type of reactor and op-erating conditions is not well known [98]. The microbial community is considered unique in each digester mainly as a result of the operating conditions and substrates

![Figure 2.3.: Dissociation curves for weak acids and bases. Adapted from [140].](https://thumb-us.123doks.com/thumbv2/123dok_us/10933115.2982055/43.892.250.711.114.889/figure-dissociation-curves-weak-acids-bases-adapted.webp)