HALF YEAR FINANCIAL REPORT
1
HALF YEAR ACTIVITY REPORT
page 3
2
CONDENSED CONSOLIDATED INTERIM FINANCIAL
page 13
STATEMENTS AT 30 JUNE 2019
3
DECLARATION BY THE PERSON RESPONSIBLE
page 43
FOR THE HALF YEAR FINANCIAL REPORT AT 30 JUNE 2019
4
STATUTORY AUDITORS’ REVIEW REPORT ON THE
page 44
HALF-YEARLY FINANCIAL INFORMATION
This document is a free translation in English of Arkema’s half-year financial report for the first half ended 30 June 2019. This translation has been prepared solely for the information and convenience of English-speaking readers. No assurances are given as to the accuracy or completeness of this translation, and Arkema assumes no responsibility with respect to this translation or any misstatement or omission that may be contained therein. In the event of any ambiguity or discrepancy between this translation and the French document, the French document shall prevail.
1
HALF-YEAR ACTIVITY REPORT
1.1
MANAGEMENT ANALYSIS PRINCIPLES AND ACCOUNTING STANDARDS
The main alternative performance indicators used by the Group are defined in note C.1 to the condensed consolidated interim financial statements at 30 June 2019 presented in section 2 of this document.
As of 1January 2019, the Group applies IFRS 16 "Leases". The income statement, balance sheet and cash flow statement for the first half of 2019 include the impacts of the Group’s first-time application of IFRS 16, which are detailed in notes B, C.1 and C.10 to the condensed consolidated interim financial statements at 30 June 2019 presented in section 2 of this document. The comparative figures for 2018 have not been restated.
When analyzing changes in its results, particularly changes in sales, the Group identifies the impact of the following effects (such analysis is unaudited):
• scope effect
:
the impact of changes in the Group’s scope of consolidation, which arise from acquisitions and divestments of entire businesses or as a result of the first-time consolidation or deconsolidation of entities. Increases or reductions in capacity are not included in the scope effect;• currency effect: the mechanical impact of consolidating accounts denominated in currencies other than the euro at different exchange rates from one period to another. The currency effect is calculated by applying the foreign exchange rates of the prior period to the figures for the period under review;
• price effect: the impact of changes in average selling prices is estimated by comparing the weighted average net unit selling price of a range of related products in the period under review with their weighted average net unit selling price in the prior period, multiplied, in both cases, by the volumes sold in the period under review;
• volume effect: the impact of changes in volumes is estimated by comparing the quantities delivered in the period under review with the quantities delivered in the prior period, multiplied, in both cases, by the weighted average net unit selling price in the prior period.
1.2
FIRST-HALF 2019 HIGHLIGHTS
1.2.1
Organic growth projects
In order to support its customers’ growth with innovative solutions for sustainable development and mobility, Arkema announced:
• the opening, with Hexcel, of a joint research and development laboratory in France as part of their strategic alliance to develop thermoplastic composites for the aerospace sector;
• the start-up of the Kepstan® PEKK facility at its site in Mobile, United States, to support the strong demand for carbon
fiber reinforced composites and 3D printing. Through this investment, Arkema strengthens its offering of advanced materials that contribute notably to lightweighting materials in markets such as aerospace, oil and gas, electronics and automotive;
• the start-up of a new polyester resins manufacturing plant in Navi Mumbai (India) to support its customers’ development throughout this region in this fast-growing market;
• the start-up by Sartomer, in April 2019, of a 30% capacity extension at its photocure liquid resin production plant in Nansha (China), in order to meet strong demand from customers in Asia in the electronics, 3D printing, adhesives and inkjet printing markets; and
• the choice of Jurong Island in Singapore as the location to build its new world-scale plant for the production of the amino 11 monomer and Rilsan® polyamide 11. With this project to increase by 50% its global capacities, the Group
will support the strong demand from its customers in Asia for high-performance bio-based solutions to address notably the major opportunity of material lightweighting. This project is part of the Group’s exceptional capital expenditure totaling some €500 million to be spread over the 2018-2021 period essentially. Construction is scheduled to be completed by late 2021.
1.2.2
Acquisitions
Acquisition of ArrMaz
In May 2019, Arkema reached a new milestone in the development of its specialty businesses, with the announcement of its planned acquisition of ArrMaz, a global leader in specialty surfactants for the crop nutrition, mining and infrastructure markets, with sales of US$290 million and an 18% EBITDA margin. Completed on 1 July 2019, the acquisition of this profitable, resilient and low capital intensive business, will lead to the creation of a new leader in specialty surfactants thanks to the excellent fit between Arkema and ArrMaz in terms of technologies, geographic reach and formulation expertise. The acquisition was based on a US$570 million enterprise value, which corresponds to an EV/EBITDA multiple of 10.8 times that should be reduced to around 7 times 2023 EBITDA taking into account synergies and ArrMaz’s organic growth. ArrMaz has been integrated into Arkema’s Performance Additives Business Line within the High Performance Materials division.
Acquisition of an equity interest in Carbon®
In June 2019, Arkema, through its subsidiary Sartomer, and Carbon®, a world leader in digital manufacturing, entered into
a strategic partnership to deliver new high performance materials for Carbon®’s customers and partners. As part of this
partnership, Arkema announced it acquired a US$20 million equity interest in Carbon®.
1.2.3
Financing
Arkema took advantage of favorable market conditions to partially refinance on 17 June 2019 its existing hybrid bonds through a combination of a new bond issue and a bond tender offer.
Consequently, the Group accepted the tender of existing perpetual hybrid bonds amounting to €400 million at a tender price of 106.137%. These bonds, which have a residual nominal value of €300 million, have a first call date on 29 October 2020 and carry an annual coupon of 4.75% until that date.
At the same time, the Group issued a €400 million perpetual hybrid bond. These bonds carry a first-call redemption option that Arkema may exercise at any time between 17 June 2024 and 17 September 2024, and have an annual coupon of 2.75% until the first call date, subject to early redemption.
1.3
ANALYSIS OF FIRST-HALF 2019 FINANCIAL RESULTS
The figures in this section are provided on a consolidated basis and in accordance with Arkema's organization into three divisions: High Performance Materials, Industrial Specialties and Coating Solutions.
1.3.1
Analysis of Arkema’s results
(In millions of euros) First-half 2019 First-half 2018 Year-on-year change
Sales 4,469 4,442 +0.6%
EBITDA 777 813 -4.4%
EBITDA margin 17.4% 18.3%
Recurring depreciation and amortization (252) (218) +15.6%
Recurring operating income (REBIT) 525 595 -11.8%
REBIT margin 11.7% 13.4%
Other income and expenses (23) (4)
Depreciation and amortization related to the revaluation of tangible and intangible assets as part of the allocation of the
purchase price of businesses (19) (18)
Operating income 483 573 -15.7%
Equity in income of affiliates (1) 1
Financial result (60) (47) +27.7%
Income taxes (95) (116) -18.1%
Net income 327 411 -20.4%
Of which: non-controlling interests 4 4
Net income – Group share 323 407 -20.6%
Adjusted net income 357 421 -15.2%
The Group applied IFRS 16 for the first time at 1 January 2019, under the modified retrospective approach which does not require restatement of the comparative figures for 2018.
SALES
At €4,469 million, sales for the first half of 2019 were up 0.6% year-on-year. Prices were overall stable for the Group as a whole (up 0.3%), with continued strong initiatives to raise selling prices in the High Performance Materials division (up 4.7%) more than offsetting the decrease observed in Industrial Specialties and Coating Solutions in a context of volatile raw materials costs. Volumes declined 2.4% compared with the very high level recorded in the first half of 2018. This mainly reflects lower demand year-on-year in the automotive, consumer electronics and oil and gas markets, overshadowing the strong dynamic in batteries and 3D printing as well as higher volumes in Coating Solutions. The currency effect was a positive 2.3%, mainly due to the appreciation of the US dollar against the euro. The scope effect was limited to a positive 0.4%.
Excluding the corporate segment (1), the breakdown of sales by division was similar to first-half 2018, with High Performance
Materials accounting for 45% of Group sales (unchanged year-on-year), Industrial Specialties 30% (31% in first-half 2018) and Coating Solutions 25% (24% in first-half 2018).
The regional sales split is also similar to that of half 2018, with Europe representing 38% of Group sales (39% in first-half 2018), North America 31% (unchanged from first-first-half 2018), Asia 27% (26% in first-first-half 2018) and the rest of the world unchanged at 4%.
EBITDA AND RECURRING OPERATING INCOME
In a complex macroeconomic context that was less favorable than last year’s, Arkema achieved a high EBITDA at €777 million, slightly down on the record performance of first-half 2018 (€813 million). Despite volumes being impacted by end markets, High Performance Materials resisted well, driven by innovation and the pro-active policy of raising selling prices, while growth in Coating Solutions mitigated the impact of market conditions in Fluorogases and of MMA/PMMA normalization compared with their historically high performances last year. The first-half 2019 EBITDA figure includes a €27 million positive impact from IFRS 16.
EBITDA margin remained excellent at 17.4% (18.3% in first-half 2018 and 17.3% in first-half 2017).
Recurring depreciation and amortization amounted to €252 million, up €34 million year-on-year, as a result of the €26 million impact of IFRS 16 and an unfavorable currency effect.
Recurring operating income (REBIT) amounted to €525 million, in line with the year-on-year changes in EBITDA and recurring depreciation and amortization. REBIT margin stood at 11.7%.
OPERATING INCOME
Operating income came in at €483 million, including €23 million in net other expenses, mainly corresponding to restructuring costs and asset impairments, as well as €19 million in depreciation and amortization resulting from the revaluation of assets carried out as part of purchase price allocations.
FINANCIAL RESULT
The financial result represented a net expense of €60 million against a €47 million net expense in first-half 2018. The year-on-year change mostly reflects an unfavourable interest rate effect on the portion of the Group’s debt swapped into US dollars and actuarial losses on certain provisions for employee benefits.
INCOME TAXES
The income tax expense was down year-on-year at €95 million (versus €116 million in first-half 2018) in line with the change in results. Excluding non-recurring items, the tax rate for the first half of the year amounted to around 20% of recurring operating income.
NET INCOME GROUP SHARE AND ADJUSTED NET INCOME
Consequently, net income – Group share totaled €323 million (€407 million in first-half 2018) while net earnings per share amounted to €3.75 after deduction of the €37 million expense resulting from the refinancing of hybrid bonds.
Excluding the post-tax impact of non-recurring items, adjusted net income came in at €357 million, representing €4.68 per share.
1.3.2 Analysis of results by division
1.3.2.1 HIGH PERFORMANCE MATERIALS (45%
OF GROUP SALES)
(In millions of euros) First-half 2019 First-half 2018 Year-on-year change
Sales 2,006 2,005
-EBITDA 332 353 -5.9%
EBITDA margin 16.6% 17.6%
Recurring operating income (REBIT) 243 275 -11.6%
REBIT margin 12.1% 13.7%
Other income and expenses (17) (2)
Depreciation and amortization related to the revaluation of tangible and intangible assets as part of the allocation of the
purchase price of businesses (17) (18)
Operating income 209 255 -18.0%
At €2,006 million, sales for the High Performance Materials division were stable compared with the first half of 2018, driven by a +4.7% price effect, positive across all product lines, reflecting continued actions to raise selling prices and optimization of the product mix towards higher value-added applications. In line with market trends, volumes were down 7.4% due to notably lower demand compared with last year in the automotive, consumer electronics and oil & gas markets, inventory adjustments in some of these chains and the particularly strong contribution from specialty molecular sieves in the first quarter of 2018. The scope effect was a positive 0.8%, corresponding to the integration of targeted acquisitions in adhesives. The positive 1.9% currency effect was mainly driven by the appreciation of the US dollar against the euro. At €332 million, EBITDA was slightly down on the very good first-half 2018 performance, in an environment marked by the weakness of certain markets which weighed on volumes, particularly in advanced materials. These impacts were mitigated to a large extent by the benefits of pricing actions, particularly in adhesives, where EBITDA increased significantly year-on-year. At 16.6%, EBITDA margin remained high, above the division’s margin for full-year 2018, while Bostik’s EBITDA margin reached 13%, up by one percentage point year-on-year.
Recurring operating income totaled €243 million. This figure includes €89 million in recurring depreciation and amortization, up €11 million on first-half 2018, mainly stemming from the impact of IFRS 16 and an unfavorable currency effect. REBIT margin came in at 12.1%.
Operating income amounted to €209 million and included €17 million in depreciation and amortization related to the revaluation of assets carried out as part of purchase price allocations, and €17 million in net other expenses, mainly corresponding to restructuring costs in adhesives and asset impairments.
1.3.2.2 INDUSTRIAL SPECIALTIES (30%
OF GROUP SALES)
(In millions of euros) First-half 2019 First-half 2018 Year-on-year change
Sales 1,315 1,370 -4.0%
EBITDA 336 370 -9.2%
EBITDA margin 25.6% 27.0%
Recurring operating income (REBIT) 232 283 -18.0%
REBIT margin 17.6% 20.7%
Other income and expenses (2) (1)
Depreciation and amortization related to the revaluation of tangible and intangible assets as part of the allocation of the
purchase price of businesses - -
Industrial Specialties sales totaled €1,315 million, down 4.0% year-on-year with a negative 4.1% price effect and a 2.3% decrease in volumes. It reflects lower volumes and prices in Fluorogases and the MMA/PMMA chain compared with the very high levels reached in 2018. The currency effect was a positive 2.4%, mainly reflecting the appreciation of the US dollar against the euro.
At €336 million, the division's EBITDA was down on the record first-half 2018 performance as Fluorogases were impacted in particular by illegal HFC imports in Europe, which weighed on both volumes and prices of this business. The performance also reflects, to a lesser extent, the normalization of market conditions in the MMA/PMMA chain. These impacts were mitigated by the very good performance of Thiochemicals. In this context, EBITDA margin remained excellent at 25.6%.
Recurring operating income amounted to €232 million and included €104 million in recurring depreciation and amortization, €17 million higher than in first-half 2018 due to the impact of IFRS 16 and an unfavorable currency effect.
Operating income was €230 million and included €2 million in net other expenses.
1.3.2.3 COATING SOLUTIONS (25%
OF GROUP SALES)
(In millions of euros) First-half 2019 First-half 2018 Year-on-year change
Sales 1,134 1,054 +7.6%
EBITDA 158 134 +17.9%
EBITDA margin 13.9% 12.7%
Recurring operating income (REBIT) 102 83 +22.9%
REBIT margin 9.0% 7.9%
Other income and expenses (1) (2)
Depreciation and amortization related to the revaluation of tangible and intangible assets as part of the allocation of the
purchase price of businesses (2) -
Operating income 99 81 +22.2%
Coating Solutions sales grew 7.6% year-on-year to €1,134 million, driven by a good volume dynamic (+6.8%), in particular in acrylic monomers, and a 3.0% positive currency effect. The negative 2.2% price effect mainly reflects lower propylene prices for acrylic monomers, while the Group continued its actions to raise selling prices in its more downstream activities. The division’s EBITDA increased sharply by 18% year-on-year to €158 million, driven by gradually improving market conditions in acrylic monomers and the progressive recovery of unit margins in downstream businesses. In this context, EBITDA margin rose to 13.9% in first-half 2019 from 12.7% in the same period of 2018.
In line with the change in EBITDA, recurring operating income increased to €102 million. This figure includes €56 million in recurring depreciation and amortization, up €5 million compared with first-half 2018 due to the impact of IFRS 16 and an unfavorable currency effect. REBIT margin improved to 9% in the first half.
1.3.3 Group cash flow analysis
(In millions of euros) First-half 2019 First-half 2018
Cash flow from operating activities 484 250
Cash flow from investing activities (346) (408)
Net cash flow 138 (158)
Of which net cash flow from portfolio management operations (25) (174)
Free cash flow 163 16
Cash flow from financing activities (238) (169)
EBITDA can be reconciled to free cash flow as follows:
(In millions of euros) First-half 2019 First-half 2018
EBITDA 777 813
Taxes (94) (117)
Cash items included in the financial result (49) (42)
Change in working capital (167) (373)
Change in fixed asset payables (1) (62) (29)
Recurring capital expenditure (187) (148)*
Exceptional capital expenditure (38) (18)
Non-recurring items (18) (17)
Other 1 (53)*
Free cash flow 163 16
* Restated in order to present investments with no impact on net debt separately (see note C.1 to the condensed consolidated interim financial statements at 30 June 2019 presented in section 2 of this document).
(1) Excluding cash flows related to non-recurring items and portfolio management operations. These two items represented a net cash
outflow of €34 million in first-half 2019 primarily related to the discontinuation of a project that was fully financed by a partner, for which a corresponding exceptional gain was recognized in the same amount. These two amounts, which offset each other, have been included in “Non-recurring items”. In first-half 2018, non-recurring items and portfolio management operations represented a net cash inflow of €3 million.
NET CASH FLOW AND FREE CASH FLOW
The Group’s net cash flow represented an inflow of €138 million in the first half of 2019 versus a €158 million outflow in the same period of 2018. The first-half 2019 figure includes a €25 million outflow from portfolio management operations, mainly corresponding to a US$20 million equity investment in Carbon®. In first-half 2018, net cash flow from portfolio management operations represented an outflow of €174 million and mainly related to the acquisition of XL Brands assets. Consequently, free cash flow – which corresponds to net cash flow excluding the impact of portfolio management operations – came to €163 million. This represents a significant year-on-year increase on first-half 2018 (€16 million), which mainly reflects a lower increase in working capital than in first-half 2018, as a result of tight management, activity levels and the favorable impact of lower raw materials costs on inventories. This limited rise in working capital offset the €59 million year-on-year increase in recurring and exceptional capital expenditure, in line with the Group’s ambitious organic investment policy to support its future growth. In first-half 2018 free cash flow also included a €21 million outflow for loans granted to employees in connection with a share capital increase reserved for employees carried out during that period. This amount was recognized in the “Other” line.
Capital expenditure for first-half 2019 amounted to €233 million (€175 million in first-half 2018), including €187 million in recurring capital expenditure and €38 million in exceptional capital expenditure, which primarily concerns the project to double the Group’s thiochemicals production capacity in Malaysia, as well as investments relating to specialty polyamides in Asia (for further details, see note C.1 to the condensed consolidated interim financial statements at 30 June 2019). For
CASH FLOW FROM FINANCING ACTIVITIES
Cash flow from financing activities represented a net outflow of €238 million in the first six months of 2019 against a €169 million net outflow in first-half 2018. The first-half 2019 figure includes a €2.50 per-share dividend payment, representing a total payout of €190 million and €17 million in share buybacks. It also includes the €38 million net global cost of partially refinancing the Group’s hybrid bonds. This refinancing – which represented a total nominal value of €400 million – combined the issue of new bonds with the partial repurchase of outstanding hybrid bonds. Following these transactions, the total nominal value of the Group’s hybrid bonds remains unchanged at €700 million.
In first-half 2018, cash flow from financing activities included the dividend payment, share buybacks and a share capital increase reserved for employees.
1.3.4 Balance sheet analysis
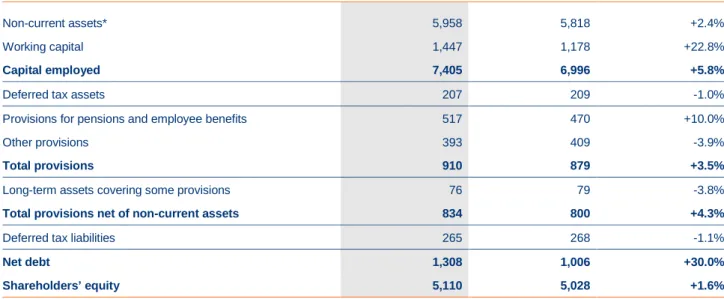
(In millions of euros) 30 June 2019 31 December 2018 Year-on-year change
Non-current assets* 5,958 5,818 +2.4%
Working capital 1,447 1,178 +22.8%
Capital employed 7,405 6,996 +5.8%
Deferred tax assets 207 209 -1.0%
Provisions for pensions and employee benefits 517 470 +10.0%
Other provisions 393 409 -3.9%
Total provisions 910 879 +3.5%
Long-term assets covering some provisions 76 79 -3.8%
Total provisions net of non-current assets 834 800 +4.3%
Deferred tax liabilities 265 268 -1.1%
Net debt 1,308 1,006 +30.0%
Shareholders’ equity 5,110 5,028 +1.6%
* Excluding deferred tax and including pension assets
The Group applied IFRS 16 for the first time at 1 January 2019, under the modified retrospective approach which does not require restatement of the comparative figures for 2018.
Between 31 December 2018 and 30 June 2019, non-current assets increased by €140 million, primarily due to:
• €233 million in capital expenditure, including €187 million recurring capital expenditure and €38 million exceptional capital expenditure;
• the recognition of a total €180 million in right-of-use assets for leases, resulting from the Group’s application of IFRS 16 from 1 January 2019;
• €316 million in depreciation and amortization including (i) €252 million in recurring depreciation and amortization, of which €26 million arising from the application of IFRS 16, (ii) €19 million in depreciation and amortization related to the revaluation of tangible and intangible assets as part of the allocation of the purchase price of businesses, and (iii) a €45 million impairment of industrial assets, with the vast majority of this amount recognized following the discontinuation of a project that was fully financed by a partner, and which was offset by the recognition of an exceptional gain of the same amount;
• an €18 million equity investment in Carbon®;
• a €21 million positive currency translation effect, mainly linked to the slight appreciation of the US dollar against the euro at the end of the period.
At 30 June 2019, working capital was €269 million higher than at 31 December 2018. This increase notably reflects the usual seasonality of sales. The currency effect during the period was limited. At 30 June 2019, the working capital to annualized sales ratio (1) stood at 16.0% versus 16.5% at 30 June 2018.
As a result of the above factors, the Group's capital employed increased by €409 million between 31 December 2018 and 30 June 2019 to €7,405 million.
At 30 June 2019, gross provisions amounted to €910 million. Some of these provisions, accounting for a total of €76 million, are mainly covered by the guarantee facility granted by Total and described in note 18.2 to the condensed consolidated interim financial statements at 30 June 2019 (see section 2 of this document) and therefore by long-term assets recognized in the balance sheet. These essentially consist of provisions related to former industrial sites in the United States. At 30 June 2019, provisions net of these non-current assets amounted to €834 million against €800 million at 31 December 2018. Net provisions can be analyzed as follows by type:
(In millions of euros) 30 June 2019 31 December 2018
Pension liabilities 357 322
Other employee benefit obligations 157 145
Environmental contingencies 127 129
Restructuring 33 36
Other 160 168
Between 31 December 2018 and 30 June 2019, net provisions for pension liabilities increased by €35 million due to a significant decrease in discount rates, partially offset by the revaluation of plan assets. The currency effect during the period was limited. Provisions for other employee benefit obligations (healthcare costs, welfare costs and long-service awards) increased by €12 million over the period due to lower discount rates.
Net debt stood at €1,308 million at 30 June 2019, representing a gearing of 26% and 0.9 times EBITDA of the last 12 months. The increase compared with end-December 2018 was mainly attributable to the cash flows described in section 1.3.3 of this document and the €156 million impact at 30 June 2019 due to the Group’s application of IFRS 16.
Shareholders’ equity amounted to €5,110 million at 30 June 2019 versus €5,028 million at 31 December 2018. The €82 million increase primarily corresponds to (i) €327 million in net income for the period, (ii) the payment of a dividend of €2.50 per share representing a total payout of €190 million, (iii) the €38 million net global cost of partially refinancing the hybrid bonds, and (iv) €17 million in share buybacks. A €28 million actuarial loss was recognized in shareholders’ equity in first-half 2019 for provisions for pension liabilities and other employee benefit obligations.
1.4
TRANSACTIONS WITH RELATED PARTIES
Transactions between consolidated companies have been eliminated in the consolidation process. In addition, in the normal course of business, the Group has business relationships with certain non-consolidated companies or companies which are accounted for under the equity method. The amounts involved are not material.
1.5
SUBSEQUENT EVENTS
Significant events occurring after the reporting date are described in note C.19 to the condensed consolidated interim financial statements at 30 June 2019 (see section 2 of this document).
1.6
MAIN RISKS AND UNCERTAINTIES
The main risks and uncertainties which the Group could face over the next six months are the same as those described in chapter 2 of the 2018 Reference Document filed with the Autorité des marchés financiers (“AMF”) on 11 April 2019 under number D.19-0308. This document is available on Arkema’s website under the heading “Investor Relations” (www.finance.arkema.com) and on the AMF website (www.amf-france.org). Additionally, an update on the Group’s contingent liabilities is provided in the notes to the condensed consolidated interim financial statements at 30 June 2019.
1.7
OUTLOOK
In the second half of the year, the macroeconomic environment is expected to remain volatile and complex, marked by continued geopolitical uncertainties, which are weighing on global demand and raw material volatility. However, the inventory adjustments observed in the first half of the year in certain end-markets are expected to ease. In this context, Arkema will maintain its focus on internal momentum and the implementation of its long-term strategy.
The Group will therefore continue to roll out its industrial projects, its innovation drive for sustainable development and mobility, and its targeted acquisition dynamic. In the second half of the year, the Group should, in particular, benefit from the start-up of certain industrial projects in Sartomer resins in Asia, technical polymers in France and acrylics in the United States, as well as the contribution from the acquisition of ArrMaz, finalized on 1 July, and of Sunke, which is due to be completed in the third quarter of the year. The Group will also continue to implement its operational excellence initiatives and its policy of selectively raising selling prices in a context of still high oil prices.
While remaining attentive to the development of the macroeconomic environment, Arkema confirms its ambition to consolidate its financial performance at high levels and to achieve in 2019 (1) an EBITDA comparable with the 2018 record
level.
The Group’s medium- and long-term targets are described in the section “Profile, ambition and strategy” in the introduction to the 2018 Reference Document.
The Group specifies that all of these targets are defined in normalized conditions and in accordance with current IFRS. The Group also notes that the achievement of these targets is based on assumptions deemed reasonable by the Group, as of the date of this document and within this time frame (in particular regarding future development of global demand, conditions relating to raw materials and energy costs, balance between supply and demand for products marketed by the Group and their price levels, as well as currency exchange rates). However, it takes no account of the potential occurrence of certain risks described in chapter 2, section 2.1 of the 2018 Reference Document or any unknown factors related to the economic, financial, competitive or regulatory environment in which the Group operates, that could affect the achievement of its targets.
Condensed consolidated interim financial statements at 30 June 2019
2
CONDENSED CONSOLIDATED INTERIM FINANCIAL
STATEMENTS AT 30 JUNE 2019
CONSOLIDATED INCOME STATEMENT ... 14
CONSOLIDATED STATEMENT OF COMPREHENSIVE INCOME... 15
CONSOLIDATED BALANCE SHEET ... 16
CONSOLIDATED CASH FLOW STATEMENT ... 17
CONSOLIDATED STATEMENT OF CHANGES IN SHAREHOLDERS’ EQUITY ... 18
A. HIGHLIGHTS ... 19
B. ACCOUNTING POLICIES ... 19
C. NOTES TO THE CONSOLIDATED FINANCIAL STATEMENTS ... 22
1. Alternative performance indicators ... 22
2. Information by business division ... 25
3. Information by geographical area ... 27
4. Other income and expenses ... 27
5. Financial result ... 27
6. Income taxes ... 28
7. Earnings per share ... 28
8. Intangible assets ... 28
9. Property, plant and equipment ... 29
10. IFRS 16 leases: rights of use and IFRS 16 debt ... 30
11. Other investments ... 31
12. Shareholders’ equity ... 31
13. Provisions for pensions and other employee benefits ... 33
14. Other provisions and other non-current liabilities ... 33
15. Liabilities and contingent liabilities ... 34
16. Debt ... 35
17. Share-based payments ... 36
18. Off-balance sheet commitments ... 37
19. Subsequent events ... 39
Condensed consolidated interim financial statements at 30 June 2019
CONSOLIDATED INCOME STATEMENT
(In millions of euros) Notes 1st half 2019 1st half 2018
Sales (C2&C3) 4,469 4,442
Operating expenses (3,456) (3,377)
Research and development expenses (123) (118)
Selling and administrative expenses (384) (370)
Other income and expenses (C4) (23) (4)
Operating income (C2) 483 573
Equity in income of affiliates (1) 1
Financial result (C5) (60) (47)
Income taxes (C6) (95) (116)
Net income 327 411
Of which: non-controlling interests 4 4
Net income - Group share 323 407
Earnings per share (in euros) (C7) 3.75 5.35
Diluted earnings per share (in euros) (C7) 3.73 5.34
The Group applied IFRS 16 for the first time at 1 January 2019, under the modified retrospective approach which does not require restatement of the comparative figures for 2018.
Condensed consolidated interim financial statements at 30 June 2019
CONSOLIDATED STATEMENT OF COMPREHENSIVE INCOME
(In millions of euros)
1st half 2019 1st half 2018
Net income 327 411
Hedging adjustments (1) -
Other items 1 -
Deferred taxes on hedging adjustments and other items - -
Change in translation adjustments (C12) 14 28
Other recyclable comprehensive income 14 28
Actuarial gains and losses (C13) (33) 18
Deferred taxes on actuarial gains and losses 5 (4)
Other non-recyclable comprehensive income (28) 14
Total income and expenses recognized directly through equity (14) 42
Comprehensive income 313 453
Of which: non-controlling interests 4 5
Comprehensive income – Group share 309 448
The Group applied IFRS 16 for the first time at 1 January 2019, under the modified retrospective approach which does not require restatement of the comparative figures for 2018.
Condensed consolidated interim financial statements at 30 June 2019
CONSOLIDATED BALANCE SHEET
(In millions of euros) Notes 30 June 2019 31 December 2018
ASSETS
Intangible assets, net (C8) 2,863 2,877
Property, plant and equipment, net (C9 & 10) 2,758 2,627
Investments in equity affiliates 37 38
Other investments (C11) 52 33
Deferred tax assets 207 209
Other non-current assets 248 243
TOTAL NON-CURRENT ASSETS 6,165 6,027
Inventories 1,167 1,136
Accounts receivable 1,370 1,247
Other receivables and prepaid expenses 184 173
Income taxes receivables 74 80
Other current financial assets 8 7
Cash and cash equivalents 1,331 1,441
TOTAL CURRENT ASSETS 4,134 4,084
TOTAL ASSETS 10,299 10,111
LIABILITIES AND SHAREHOLDERS' EQUITY
Share capital 766 766
Paid-in surplus and retained earnings 4,180 4,099
Treasury shares (44) (28)
Translation adjustments 156 142
SHAREHOLDERS’ EQUITY – GROUP SHARE (C12) 5,058 4,979
Non-controlling interests 52 49
TOTAL SHAREHOLDERS’ EQUITY 5,110 5,028
Deferred tax liabilities 265 268
Provisions for pensions and other employee benefits (C13) 517 470
Other provisions and non-current liabilities (C14) 412 433
Non-current debt (C16) 1,875 2,246
TOTAL NON-CURRENT LIABILITIES 3,069 3,417
Accounts payable 926 1,037
Other creditors and accrued liabilities 348 343
Income taxes payable 75 78
Other current financial liabilities 7 7
Current debt (C16) 764 201
TOTAL CURRENT LIABILITIES 2,120 1,666
TOTAL LIABILITIES AND SHAREHOLDERS' EQUITY 10,299 10,111
The Group applied IFRS 16 for the first time at 1 January 2019, under the modified retrospective approach which does not require restatement of the comparative figures for 2018.
Condensed consolidated interim financial statements at 30 June 2019
CONSOLIDATED CASH FLOW STATEMENT
(In millions of euros) 1st half 2019 1st half 2018
Net income 327 411
Depreciation, amortization and impairment of assets 316 235
Other provisions and deferred taxes (1) (28)
(Gains)/losses on sales of long-term assets (4) (2)
Undistributed affiliate equity earnings 1 (1)
Change in working capital (167) (373)
Other changes 12 8
CASH FLOW FROM OPERATING ACTIVITIES 484 250
Intangible assets and property, plant, and equipment additions (233) (175)
Change in fixed asset payables (96) (26)
Acquisitions of operations, net of cash acquired (19) (174)
Increase in long-term loans (20) (44)
Total expenditures (368) (419)
Proceeds from sale of intangible assets and property, plant, and equipment 6 1
Repayment of long-term loans 16 10
Total divestitures 22 11
CASH FLOW FROM INVESTING ACTIVITIES (346) (408)
Issuance (repayment) of shares and paid-in surplus (C12) 3 51
Purchase of treasury shares (C12) (17) (19)
Issuance of hybrid bonds (C12) 399 -
Redemption of hybrid bonds (C12) (425) -
Dividends paid to parent company shareholders (C12) (190) (176)
Interest paid to bearers of subordinated perpetual notes (C12) (12) -
Dividends paid to non-controlling interests (1) (1)
Increase in long-term debt 2 1
Decrease in long-term debt (C16.1) (515) (9)
Increase / decrease in short-term debt (C16.1) 518 (16)
CASH FLOW FROM FINANCING ACTIVITIES (238) (169)
Net increase/(decrease) in cash and cash equivalents (100) (327)
Effect of exchange rates and changes in scope (10) (7)
Cash and cash equivalents at beginning of period 1,441 1,438
CASH AND CASH EQUIVALENTS AT END OF PERIOD 1,331 1,104
The Group applied IFRS 16 for the first time at 1 January 2019, under the modified retrospective approach which does not require restatement of the comparative figures for 2018.
Condensed consolidated interim financial statements at 30 June 2019
CONSOLIDATED STATEMENT OF CHANGES IN SHAREHOLDERS’ EQUITY
(In millions of euros) Share capital Paid-in surplus Hybrid bonds Retained earnings Translation adjustments Treasury shares Shareholders’ equity – Group share Non-controlling interests Shareholders’ equity At 1 January 2019 766 1,263 689 2,147 142 (28) 4,979 49 5,028 Cash dividend - - - (202) - - (202) (1) (203) Issuance of share capital 0 3 - - - - 3 - 3 Purchase of treasury shares - - - - - (17) (17) - (17) Grants of treasury shares to employees - - - (1) - 1 - - - Share-based payments - - - 12 - - 12 - 12 Issuance of hybrid bonds* - - 399 - - - 399 - 399 Redemption of hybrid bonds* - - (394) (31) - - (425) - (425) Other - - - - - - - - - Transactions with shareholders 0 3 5 (222) - (16) (230) (1) (231) Net income - - - 323 - - 323 4 327
Total income and expenses recognized directly through equity - - - (28) 14 - (14) - (14) Comprehensive income - - - 295 14 - 309 4 313 At 30 June 2019 766 1,266 694 2,220 156 (44) 5,058 52 5,110 *Cf C12.2 “Hybrid bonds” (In millions of euros) Share capital Paid-in surplus Hybrid bonds Retained earnings Translation adjustments Treasury shares Shareholders’ equity – Group share Non-controlling interests Shareholders’ equity At 1 January 2018 759 1,216 689 1,670 101 (2) 4,433 41 4,474 Cash dividend - - - (176) - - (176) (1) (177) Issuance of share capital 6 45 - - - - 51 - 51 Purchase of treasury shares - - - (19) (19) - (19) Grants of treasury shares to employees - - - (2) - 2 - - - Share-based payments - - - 11 - - 11 - 11 Other - - - - Transactions with shareholders 6 45 - (167) - (17) (133) (1) (134) Net income - - - 407 - - 407 4 411
Total income and expenses recognized directly through equity - - - 14 27 - 41 1 42 Comprehensive income - - - 421 27 - 448 5 453 At 30 June 2018 765 1,261 689 1,924 128 (19) 4,748 45 4,793
Condensed consolidated interim financial statements at 30 June 2019
A. HIGHLIGHTS
A.1 Portfolio management
In May 2019, Arkema announced the planned acquisition of ArrMaz, a global leader in specialty surfactants for crop nutrition, mining and infrastructure markets, with sales of US$290 million and an EBITDA margin of 18%. The offer was based on an enterprise value of US$570 million. The operation was completed on 1 July 2019. The newly-acquired business has joined the Performance Additives Business Line in the High Performance Materials division.
Arkema also announced an investment of US$20 million in Carbon® in June 2019.
A.2 Other highlights
Arkema took advantage of favourable market conditions to partially refinance its existing hybrid bonds through a combination of a new bond issue and a bond tender offer.
On 17 June 2019 Arkema thus issued a €400 million perpetual hybrid bond. These bonds carry a first-call redemption option that Arkema may exercise at any time between 17 June 2024 and 17 September 2024, and have a coupon of 2.75% until the first call date, subject to early redemption. Arkema also accepted the tender of perpetual hybrid bonds amounting to €400 million at a tender price of 106.137%. These bonds were issued on 29 October 2014 in the total amount of €700 million, with a first call option on 29 October 2020 and an annual coupon of 4.75% until that date. See note C12.2 “Hybrid bonds”.
B. ACCOUNTING POLICIES
Arkema is a French limited liability company (société anonyme) with a Board of Directors, subject to the provisions of book II of the French Commercial Code and all other legal provisions applicable to French commercial companies.
The Company’s head office is at 420 rue d’Estienne d’Orves, 92700 Colombes (France). It was incorporated on 31 January 2003 and the shares of Arkema have been listed on the Paris stock exchange (Euronext) since 18 May 2006.
Basis for preparation
The Group’s condensed consolidated interim financial statements at 30 June 2019 were prepared under the responsibility of the Chairman and CEO of Arkema and were approved by the Board of Directors of Arkema on 31 July 2019.
The condensed consolidated interim financial statements at 30 June 2019 were prepared in compliance with IAS 34 “Interim financial reporting” and established in accordance with the IFRS (International Financial Reporting Standards) issued by the IASB (International Accounting Standards Board) and IFRS endorsed by the European Union at 30 June 2019. As condensed interim financial statements, they do not incorporate all of the disclosures required in full financial statements and must thus be read in conjunction with the consolidated financial statements for the year ended 31 December 2018.
The accounting framework and standards adopted by the European Union can be consulted on the following website: https://ec.europa.eu/info/law/international-accounting-standards-regulation-ec-no-1606-2002
Changes in IFRS and interpretations
The accounting policies applied in preparing the condensed consolidated interim financial statements at 30 June 2019 are identical to those used in the consolidated financial statements at 31 December 2018, except for IFRS standards, amendments and interpretations that are mandatory for accounting periods commencing on or after 1 January 2019 (and which had not been applied early by the Group), namely:
Condensed consolidated interim financial statements at 30 June 2019
Amendments to IAS 19 Plan amendment, curtailment or settlement Adopted by the European Union on 14 March 2019
Amendments to IAS 28 Long-term interests in associates and joint ventures Adopted by the European Union on 11 February 2019
Amendments to IFRS 9 Prepayment features with negative compensation Adopted by the European Union on 26 March 2018
IFRS 16 Leases Adopted by the European Union
on 9 November 2017
IFRIC 23 Uncertainty over income tax treatments (IAS12) Adopted by the European Union on 24 October 2018
Annual improvements to IFRS - 2015-2017 cycle
Adopted by the European Union on 15 March 2019
Application of these amendments and interpretations had no significant impact on the financial statements at 30 June 2019.
Impact of the application of IFRS 16
The impact of IFRS 16 is described in notes C1.8 “Impact of IFRS 16 in the first half of 2019” and C10 “IFRS 16 leases”.
From 1 January 2019, the Group’s lease obligations are recorded in application of IFRS 16 “Leases”. In the balance sheet, the Group recognizes an asset corresponding to the right to use the leased asset, and an equivalent financial liability. In the income statement, the lease payment expense is replaced by amortization of the right to use the asset, recorded in “Depreciation, amortization and impairment”, and a financial interest expense, recorded in “Financial result”. The cash flow statement is also impacted. Instead of the lease payments previously presented in “cash flow from operating activities”, the Group records repayments of the financial liability presented in “Cash flow from financing activities” and a financial interest expense, presented in “Cash flow from operating activities”.
The Group applies this standard under the modified retrospective approach, and opted to use the two exemptions from capitalization allowed for leases of less than twelve months and leases of assets with an individual value of less than USD5,000 when new. For purposes of simplification, the Group excludes a certain number of subsidiaries from the scope of application of IFRS 16. The combined impact of the excluded lease contracts is not material for the Group.
The right of use is recognized at an amount corresponding to the initial debt, adjusted for prepaid and accrued payments on the original lease, and any estimated repair costs. The right of use is amortized on a straight-line basis over the term of the lease.
The lease term is the irrevocable period, extended where relevant by any renewal options the Group is reasonably certain to use; in particular, the Group applies the recommendation issued by the Autorité des normes comptables to real estate property leases in France, taking as the maximum term the longest term, i.e. 9 years. The lease obligation at 1 January 2019 is calculated under IFRS 16, applying the discount rates in force at that date over the residual term of the lease. As the implicit interest rate of the leases is not easily determined, the Group applies a discount rate based on the subsidiaries’ estimated incremental borrowing rate.
The principal leases affected by IFRS 16 concern real estate property and logistics equipment, excluding servicing obligations associated with the lease.
Condensed consolidated interim financial statements at 30 June 2019
For the first-time application of IFRS16, a reconciliation with off-balance sheet commitments is presented below:
(in millions of euros) 1January 2019
Lease obligations 126
Service component included in leases (6)
Leases outside the scope of IFRS 16 at 1 January 2019 (16) Materiality threshold effect on off-balance sheet commitments 76
IFRS16 lease obligation 180
Discount effect (22)
TOTAL IFRS 16 DEBT 158
Non-mandatory IFRS standards and interpretations at 1 January 2019
The standards, amendments and interpretations published by the IASB and the IFRS IC (IFRS Interpretations Committee) which are not yet mandatory for accounting periods commencing on or after 1 January 2019 are:
Amendments to IAS 1 and IAS 8 Definition of material Not adopted by the European Union at 30 June 2019
Amendments to IFRS 3 Definition of a business Not adopted by the European Union at 30 June 2019
Conceptual framework Amendments to references to the conceptual framework Not adopted by the European Union at 30 June 2019
IFRS 17 Insurance contracts Not adopted by the European
Union at 30 June 2019
Use of assumptions
Preparation of the condensed consolidated interim financial statements in accordance with IFRS requires Group management to make estimates and determine assumptions that can have an impact on the amounts recognized in assets and liabilities at the balance sheet date, and have a corresponding impact on the income statement. Management made its estimates and determined its assumptions on the basis of past experience and taking into account different factors considered to be reasonable for the valuation of assets and liabilities. Use of different assumptions could have a material effect on these valuations. The main assumptions made by management in preparing the financial statements are those used for measuring the recoverable value of property, plant and equipment and intangible assets, pension benefit obligations, deferred taxes and provisions. The disclosures provided concerning contingent assets and liabilities and off-balance sheet commitments at the date of preparation of the condensed consolidated interim financial statements also involve the use of estimates.
Impact of seasonality
The Group’s standard pattern of business shows seasonality effects. Various characteristics contribute to these effects:
• demand for products manufactured by the Group is generally lower in the summer months (July-August) and in December, notably as a result of the slowdown in industrial activity during these months, particularly in France and the rest of Europe;
• in some of the Group’s businesses, particularly those serving the paints and coatings as well as the refrigeration and air-conditioning markets, sales are generally higher in the first half of the year than in the second half. By contrast, in adhesives, the two halves of the year are more evenly balanced;
• the major multi-annual maintenance turnarounds at the Group’s production plants also have an impact on seasonality, and tend in general to be carried out in the second half of the year.
These seasonal effects observed in the past are not necessarily representative of future trends, but can have a material effect on the variations in results and working capital from one quarter of the year to another.
Condensed consolidated interim financial statements at 30 June 2019
C. NOTES TO THE CONSOLIDATED FINANCIAL STATEMENTS
1. Alternative performance indicators
To monitor and analyse the financial performance of the Group and its activities, Group management uses alternative performance indicators. These are financial indicators that are not defined by IFRS. This note presents a reconciliation of these indicators and the aggregates from the consolidated financial statements under IFRS.
Note C.2 “Information by business division” partly refers to these alternative performance indicators.
1.1 Recurring operating income (REBIT) and EBITDA
(In millions of euros) Notes 1st half 2019 1st half 2018
OPERATING INCOME 483 573
- Depreciation and amortization related to the revaluation of tangible and
intangible assets as part of the allocation of the purchase price of businesses (19) (18)
- Other income and expenses (C4) (23) (4)
RECURRING OPERATING INCOME(REBIT) 525 595
- Recurring depreciation and amortization of tangible and intangible assets (252) (218)
EBITDA 777 813
Details of depreciation and amortization of tangible and intangible assets
(In millions of euros) Notes 1st half 2019 1st half 2018
Depreciation and amortization of tangible and intangible assets (C8 & C9 & C10) (316) (236)
Of which: Recurring depreciation and amortization of tangible and intangible assets (252) (218) Of which: Depreciation and amortization related to the revaluation of tangible and
intangible assets as part of the allocation of the purchase price of businesses (19) (18)
Of which: Impairment included in other income and expenses (C4) (45) 0
1.2 Adjusted net income and adjusted earnings per share
(In millions of euros) Notes 1st half 2019 1st half 2018
NET INCOME – GROUP SHARE 323 407
- Depreciation and amortization related to the revaluation of tangible and
intangible assets as part of the allocation of the purchase price of businesses (19) (18)
- Other income and expenses (C4) (23) (4)
- Other income and expenses attributable to non-controlling interests - -
- Taxes on depreciation and amortization related to the revaluation of tangible and intangible assets as part of the allocation of the purchase price of businesses
5 4
- Taxes on other income and expenses 3 2
- One-time tax-effects - 2
ADJUSTED NET INCOME 357 421
Weighted average number of ordinary shares 76,214,216 76,070,820
Weighted average number of potential ordinary shares (C7) 76,608,099 76,169,120
ADJUSTED EARNINGS PER SHARE (IN EUROS) 4.68 5.53
Condensed consolidated interim financial statements at 30 June 2019
1.3 Recurring capital expenditure
(In millions of euros) 1st half 2019 1st half 2018
INTANGIBLE ASSETS AND PROPERTY, PLANT, AND EQUIPMENT ADDITIONS 233 175
- Exceptional capital expenditure 38 18
- Investments relating to portfolio management operations - -
- Capital expenditure with no impact on net debt 8 9*
RECURRING CAPITAL EXPENDITURE 187 148*
* Restated figures
Exceptional capital expenditure corresponds to a very limited number of capital expenditure items that the Group presents separately in its financial reporting due to their unusual size or nature (major development projects, accidents or damage, exceptional restructuring operations). They mainly concern capital expenditure for thiochemicals in Malaysia and specialty polyamides in Asia.
Investments relating to portfolio management operations reflect the impact of acquisition operations.
Capital expenditure with no impact on net debt corresponds to capital expenditure items financed by non-Group entities, or reclassifications of assets.
1.4 Free cash flow
(In millions of euros) 1st half 2019 1st half 2018
Cash flow from operating activities 484 250
+ Cash flow from net investments (346) (408)
NET CASH FLOW 138 (158)
- Net cash flow from portfolio management operations (25) (174)
FREE CASH FLOW 163 16
The net cash flow from portfolio management operations corresponds to the impact of acquisition and divestment operations.
1.5 Working capital
(In millions of euros) 30 June 2019 31 December 2018
Inventories 1,167 1,136
+ Accounts receivable 1,370 1,247
+ Other receivables including income taxes 258 253
+ Other current financial assets 8 7
- Accounts payable 926 1,037
- Other liabilities including income taxes 423 421
- Other current financial liabilities 7 7
WORKING CAPITAL 1,447 1,178
1.6 Capital employed
(In millions of euros) Notes 30 June 2019 31 December 2018
Goodwill, net 1,622 1,618
+ Intangible assets (excluding goodwill) and property, plant and equipment, net (C8, C9 & C10) 3,999 3,886
+ Investments in equity affiliates 37 38
+ Other investments and other non-current assets 300 276
+ Working capital 1,447 1,178
Condensed consolidated interim financial statements at 30 June 2019
1.7 Net debt
(In millions of euros) Notes 30 June 2019 31 December 2018
Non-current debt (C16) 1,875 2,246
+ Current debt (C16) 764 201
- Cash and cash equivalents 1,331 1,441
NET DEBT 1,308 1,006
1.8 Impact of IFRS 16 in the first half of 2019
As of 1 January 2019 Arkema applies IFRS 16 “Leases”. The impacts of this standard in the first half of 2019 on the main aggregates and alternative performance indicators used by the Group are described below. The 2018 figures have not been restated.
Income statement
(In millions of euros) 1st half 2019
EBITDA 27
Recurring depreciation and amortization (26)
Recurring operating income(REBIT) 1
Operating income 1
Financial result (2)
Adjusted net income (1)
Net income (1)
Cash flow statement
(In millions of euros) 1st half 2019
Cash flow from operating activities 25
Cash flow from financing activities (25)
Free cash flow 25
Balance sheet
(In millions of euros) 30 June 2019
Property, plant and equipment 155
Total assets 155
Non-current debt 113
Current debt 43
Net debt 156
Net income (1)
Total liabilities and shareholders’ equity 155
Information by business division (1st half 2019)
(In millions of euros)
High Performance Materials Industrial Specialties Coating Solutions Corporate EBITDA 8.5 12.5 5 1
Recurring depreciation and amortization (8) (12) (5) (1)
Condensed consolidated interim financial statements at 30 June 2019
2. Information by business division
As required by IFRS 8 “Operating Segments”, segment information for the Group is presented in accordance with the business divisions identified in the internal reports that are regularly reviewed by general management in order to allocate resources and assess financial performance.
Arkema has three business divisions: High Performance Materials, Industrial Specialties and Coating Solutions. Three members of the Executive Committee supervise these divisions; they report directly to the Chairman and CEO, Arkema’s chief operating decision-maker as defined by IFRS 8, and are in regular contact with him for the purpose of discussing their sector’s operating activity, financial results, forecasts and plans.
The content of the business divisions is as follows:
• High Performance Materials includes the following Business Lines (1): • Bostik,
• Technical Polymers, comprising specialty polyamides and PVDF,
• Performance Additives, comprising photocure resins (Sartomer), organic peroxides and the adsorption activity.
High Performance Materials provide innovative solutions with high value added, used in varied sectors such as transport, oil extraction, renewable energies (photovoltaics, lithium-ion batteries), consumer goods (beauty products, sports equipment, packaging, etc), electronics, construction, coatings and water treatment;
• Industrial Specialties groups the following Business Lines: • Thiochemicals,
• Fluorogases, • PMMA,
• Hydrogen Peroxides.
These integrated industrial niche markets in which Arkema Group benefits from global positions, concern products used in several industrial sectors such as refrigeration and air conditioning, petrochemicals, refining, paper pulp, animal nutrition, electronics and the automotive industry;
• Coating Solutions comprises the following Business Lines: • Acrylics,
• Coating Resins and Additives, comprising the coating resins and Coatex rheological additives activities.
This division proposes solutions for decorative paints, industrial coatings, adhesives and high-growth acrylic applications (superabsorbents for disposable nappies, water treatment, oil and gas extraction).
Functional and financial activities which cannot be directly allocated to operational activities (notably certain research costs and central costs) are brought together in a Corporate division.
Operating income and assets are allocated between business divisions prior to inter-division adjustments. Sales between divisions take place at market prices.
Condensed consolidated interim financial statements at 30 June 2019
1st half 2019 (In millions of euros)
High Performance Materials Industrial Specialties Coating
Solutions Corporate Total
Non-Group sales 2,006 1,315 1,134 14 4,469
Inter-division sales 5 78 39 -
Total sales 2,011 1,393 1,173 14
EBITDA* 332 336 158 (49) 777
Recurring depreciation and amortization of tangible and intangible assets* (89) (104) (56) (3) (252)
Recurring operating income (REBIT)* 243 232 102 (52) 525
Depreciation and amortization related to the revaluation of tangible and intangible assets as part of the allocation of the purchase price of businesses
(17) - (2) - (19)
Other income and expenses (17) (2) (1) (3) (23)
Operating income 209 230 99 (55) 483
Equity in income of affiliates 0 (1) - - (1)
Intangible assets and property, plant, and equipment additions 104 81 43 5 233
Of which: recurring capital expenditure* 83 56 43 5 187
1st half 2018 (In millions of euros)
High Performance Materials Industrial Specialties Coating
Solutions Corporate Total
Non-Group sales 2,005 1,370 1,054 13 4,442
Inter-division sales 5 94 38 -
Total sales 2,010 1,464 1,092 13
EBITDA* 353 370 134 (44) 813
Recurring depreciation and amortization of tangible and intangible assets * (78) (87) (51) (2) (218)
Recurring operating income (REBIT)* 275 283 83 (46) 595
Depreciation and amortization related to the revaluation of tangible and intangible assets as part of the allocation of the purchase price of businesses
(18) - - - (18)
Other income and expenses (2) (1) (2) 1 (4)
Operating income 255 282 81 (45) 573
Equity in income of affiliates 0 1 - - 1
Intangible assets and property, plant, and equipment additions 62 75 26 12 175
Of which: recurring capital expenditure* 51 59 (1) 26 12 148 (1)
* See C1 “Alternative performance indicators” (1) Restated figures
Condensed consolidated interim financial statements at 30 June 2019
3. Information by geographical area
Non-Group sales are presented on the basis of the geographical location of customers.
France
Rest of
Europe NAFTA* Asia
Rest of the
world Total 1st half 2019
(In millions of euros)
Non-Group sales 366 1,322 1,405 1,196 180 4,469
France
Rest of
Europe NAFTA* Asia
Rest of the
world Total 1st half 2018
(In millions of euros)
Non-Group sales 373 1,345 1,371 1,151 202 4,442
* NAFTA: USA, Canada, Mexico
4. Other income and expenses
1st half 2019
1
st half 2018
(In millions of euros) Expenses Income Net Expenses Income Net
Restructuring and environment (10) - (10) (5) 1 (4)
Goodwill impairment - - - -
Asset impairment (excluding goodwill) (7) - (7) - 0 0
Litigation and claims (5) 4 (1) (2) 1 (1)
Gains (losses) on sales and purchases of assets (4) - (4) (1) 2 1
Other (37) 36 (1) 0 - 0
Total other income and expenses (63) 40 (23) (8) 4 (4)
In the first half of 2019, restructuring and environment expenses mainly include restructuring costs in adhesives. Exceptional asset impairment concerns industrial assets in the United States. “Other” items essentially comprise exceptional asset impairment recognized after discontinuation of a project that was fully financed by a partner; consequently, this impairment is offset by an exceptional gain of the same amount.
5. Financial result
Financial result includes the cost of debt adjusted for capitalized financial expenses, and as regards provisions for pensions and employee benefits, the interest cost, the expected return on plan assets and the actuarial gains and losses related to changes in the discount rate on other long-term benefits. It also includes the portion of foreign exchange gains and losses corresponding to the interest income/expense reflected by the difference between the spot exchange rate and the forward exchange rate, and the foreign exchange gain/loss on unhedged financing.
(In millions of euros) 1st half 2019 1st half 2018
Cost of debt (30) (30)
Financial income/expenses on provisions for pensions and employee benefits (10) (6) Spot/forward exchange rate difference and foreign exchange gain/loss on unhedged
financing (20) (12)
Capitalized interest 2 1
Financial expenses related to the IFRS 16 debt (2) -
Other 0 0