DEMAND RESPONSE PILOT
COMPARISON
By
Jessica Stromback, Christophe Dromacque, Daria Golubkina
2
Table of Contents
Key Figures and Tables ... 3
Program Types and Definitions ... 5
Learning cycles and Piloting... 6
Experiential Learning ... 7
Demand Response Program Descriptions ... 8
Feedback Definition and Programs ... 13
Pilot Comparative Analyses ... 19
Results pilot comparison ... 21
Source of automation and results ... 22
Pricing programs and overall consumption reductions... 23
Method of event alert and critical peak reductions ... 25
Load shifted in comparison with price multiples ... 26
Feedback pilot results ... 29
Duration of pilots ... 31
Season of pilots ... 34
Regional differences ... 35
Incentives to join / complete pilots ... 37
Customer segmentation ... 38
Education ... 43
Number of participants in pilots ... 47
Organizers ... 48
From pilots to rollout - Limitations ... 50
What traditional pilots test ... 50
Risk: the gap left by piloting programs ... 52
Learning cycles and piloting ... 53
Social ramifications ... 59
3
KEY FIGURES AND TABLES
Figure 1: Current Understanding of Consequences of Electricity Consumption 7 Figure 2: Kolb’s experiential learning cycle 8 Figure 3: The influence of peak pricing on load curves 9 Figure 4: TOU bands mandated by the Italian regulator 2008 10 Figure 5: % of consumption reductions during peak hours 13 Figure 6: ESB Trial Display Ireland (2009) 16
Figure 7:The Energy Orb PG&E 17
Figure 8: The Energy Tree Source: Interactive Institute 18 Figure 9: % of consumption reductions during peak hours 21 Figure 10: Comparison of peak clipping and automation locations 22 Figure 11: Overall, aggregated consumption reductions in DR and feedback pilots 24 Figure 12: Method of communicating Critical Peak Event alerts to consumers 25
Figure 13:The Energy Orb PG&E 25
Figure 14: Percentage of load shifted as compared to peak hour prices in multiples of base price 27 Figure 15: PRISM Calculation model for forecasting DR results 28
Figure 16: Feedback Pilot Results 29
Figure 17: An informative bill 30
Figure 18: Dynamic In House Displays 31
Figure 19: Length of DR pilot and aggregated consumption reductions - without automation 32 Figure 20: Pricing pilots and results depending on the length of pilot 33 Figure 21: The relative influence of season on Critical Peak pilots and TOU - without automation 34 Figure 22: The influence of the use of incentive on TOU and Critical Peak Pricing pilots 38 Figure 23: Customer segmentation and TOU and Peak Pricing results 39 Figure 24: Swedish utilities knowledge of residential consumers 40 Figure 25: Customer segmentation Groups into personality types 41 Figure 26: Customer segmentation groups SEAS-NVE 42 Figure 27: A comparison of education material type 44 Figure 28: Cost of running appliances of different TOU rates ESB 45 Figure 29: Normative and directive messages on door hangers 46 Figure 30: Normative advice encouraging water conservation 46 Figure 31: Effectiveness of pilots and customer sample size 47 Figure 32: All pricing pilot results compared according to sample size 48
4 Figure 33: The three main tested elements in a traditional pilot 51 Figure 34: 5 DR Pilot Requirement vs. DR Rollout Requirements 52 Figure 35: Current Understanding of Consequences of Electricity Consumption 53 Figure 36: Kolb’s experiential learning cycle 54
Figure 37: A linear piloting program 56
Figure 38: 80% of savings were made but 30% of the customer group 57 Figure 39: The results of ECS customer questionnaire 60 Figure 40: Impact of participating in DR on a New York School 61 Figure 41: The circle of elements required for a successful DR rollout 62
5
1.
PROGRAM TYPES AND DEFINITIONS
80 pilots have been reviewed for this report, selected from a pool of approximately 120. Their effectiveness has been analyzed according to type and according to a selection of variables, such as communication technology and information provided, to ascertain differing elements that may contribute to effectiveness. The pilots reviewed here cover: Critical Peak Pricing (CPP), Critical Peak Rebates (CPR) and Time of Use (TOU). Feedback and customer communication are considered important in the success of long-term demand response and customer relations. This is especially true in markets where average household consumption is low and cost/benefit a challenge or in markets – such as California, where pricing programs are implemented for the entire customer base.
Without successful customer engagement, pricing programs fail. Therefore methods for gaining this engagement and starting customer learning cycles with tools such as In House Displays and informative billing are included for analysis. Lowered consumption levels here are viewed as proof of successful engagement which could be coupled with a dynamic pricing program to improve engagement and response levels of a wider customer base – at low cost.
The US Department of Energy defines Demand Response (DR) as a price based mechanism directed at end consumers. The definition is as follows: ―Changes in electric usage by end-use customers from their normal consumption patterns in response to changes in the price of electricity over time, or to incentive payments designed to induce lower electricity use at times of high wholesale market prices or when system reliability is jeopardized.‖1
However, through comparison of pilot projects and rollouts such as the SM rollout in California, it is clear that DR is as much based on successful interaction and communication with end consumers as pricing mechanisms. If the utility fails to engage the consumer in a positive manner the pricing signals are ineffective. VaasaETT’s definition of DR is therefore:
―Any program, which communicates with the end consumer, using pricing, feedback and/or automation and either enables them or encourages them to lower or shift energy consumption during periods of high wholesale market prices or when system reliability is jeopardized.‖
6 rather than singling it out as THE mechanism involved in Demand Response Programs.
This report is divided into 3 sections. Section 1 discusses the customer learning cycle as a mechanism involved in raising customer awareness and ensuring engagement. It then reviews and defines demand response and feedback program types with a short explanation of each. Section 2 analyses the comparative results of 80 pilots, divided into 124 programs, selected from Europe, Canada, the USA, Japan, Israel, Australia and several other markets. The pilot analysis provides aggregated results by pilot type and also breaks them down into 15 comparative variables. The aim here has been to ascertain which variables can influence program results. Section 3 is an opinion piece discussing a few of the requirements for successful Demand Response rollout which traditional piloting does not focus on. The aim of this section is to provide value-added observations for utilities and technology companies to consider.
1.1. Learning Cycles and Piloting
Understanding the experiential learning cycle of customers is not a purely academic exercise. Insight into how consumers learn, why feedback and pricing work, maximizes the impact of pilot studies and will eventually improve rollout results. Electricity is consumed as an invisible bi-product of whatever is the main activity. Customers do not consider reading a book as an electricity consuming activity. However, it often is. Electricity is consumed when customers talk to friends in cars on mobile phones, when they take showers, when they make toast. Yet as electricity is never the focus of these activities, customers are unaware of the direct impact an activity has on their consumption levels. The low overall awareness of consumption has been exacerbated, especially in Europe, by estimated billing practices. European consumers pay estimated and season adjusted bills, throughout the year. This protects them from realizing at the end of a particularly cold month for example, that they have consumed more through electric heating during that period. The cost of high winter bills is evened out over the twelve months. Many utilities read the meters manually and once a year. The difference between the estimated consumption and the actual consumption is then calculated and paid at the end of the billing period.
When residents drive cars they have the opportunity to notice if they have driven more than usual because they have to purchase extra gasoline. Actions lead to consequences quickly enough for the driver to make the connection. The way residents are billed for electricity, it is as if for 11 months of the year they paid a gasoline fee and then at the end of the year made up the difference. The connection between behavioral choices in January and consequences in October is lost.
7 Figure 1: Current Understanding of Consequences of Electricity Consumption
As Figure 1 depicts, the activity choices and costs never connect in the users mind. In order for consumers to change their behavior they need to connect these two and become aware of the consequences of their actions and motivated to adjust.2 A theory of experiential learning applies here as one method for better understanding the mechanisms of this process.
1.2. Experiential Learning
David Kolb’s theory of experiential learning has been used in schools and for adult education for many years. The hypothesis states that people learn through: concrete experiences, analyzing their own experiences, trying new experiments that further the idea of what they just learnt and noticing the results of those. The process is therefore cyclical and a spiral – the more upward turns people go through of experimenting and analysis, the more they learn.
An example of the experiential learning cycle in action has been recorded by researchers developing displays at YelloStröm, Onzo and the Interactive Institute, when they observe and interview customers who are given displays.
2Within the electricity industry this is seen as the greatest barrier to successful energy saving and other
efficiency programs (Darby 2006, Stromback 2010, Mourik 2009). Research carried out by the UK Economic and Social Research Council in 2004 concluded that 16 MtC could be saved in the domestic sector with a payback time of less than 5 years but that a major challenge remains in motivating behavioural change “A major area of research is how such a process of learning may be stimulated” (Darby 2006).
8 The customer first observes the machine- learning how it functions, they then take it around the house with them, turning appliances on and off to see what the display will do. In pedagogical terms – the display has enabled a learning cycle to begin.
The consumer has the initial experience of turning on the display and
noting that it is recording real time electricity consumption. This is the first concrete experience and step 1 in the cycle. He actively observes what the display does (step 2) comprehends that he is seeing real time energy consumption (step 3) and decides to perform another active experiment (step 4) carrying it around the house to note what happens when he turns on the lights or his daughter’s hair dryer. This is then leads to new realizations (hair dryers use a lot more electricity than lights) and a new cycle has started. This next cycle is actually teaching not only about the display but about how much different appliances consume.
1.3. Demand Response Program Descriptions
As discussed above DR is a program designed to help consumers shift consumption away from peak consumption times to lower consumption periods, lowering distribution and supply costs. This is achieved through dynamic pricing mechanisms. The prices are raised at peak times and lowered at low consumption times. However there are several methods and degrees of dynamic pricing, depending on the surrounding regulatory framework and the load profiles of the market3
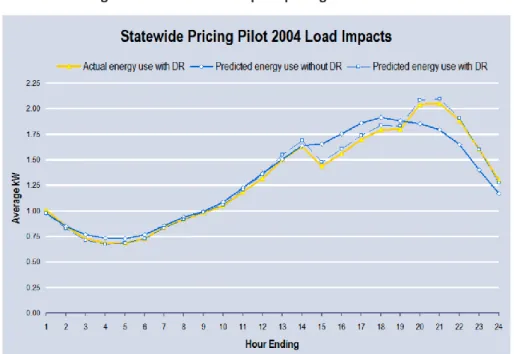
9 Figure 3: The influence of peak pricing on load curves
Source: Epri 4
Figure 3 shows the peak clipping achieved through the Critical Peak Pricing (CPP) program piloted during the California State Pilot. Residents on the pricing program lowered their consumption during the peak hours. When the peak period ended, consumption of the control group rose above the peak level as A/C units turned back on. However the total consumption peak would still have been lowered thanks to the customers enrolled in the CPP program. Below is an overview of the residential demand response programs on the market.
Dynamic Pricing is defined here as a price which is time based and includes more than one tariff. All of the programs described below are therefore examples of dynamic pricing.
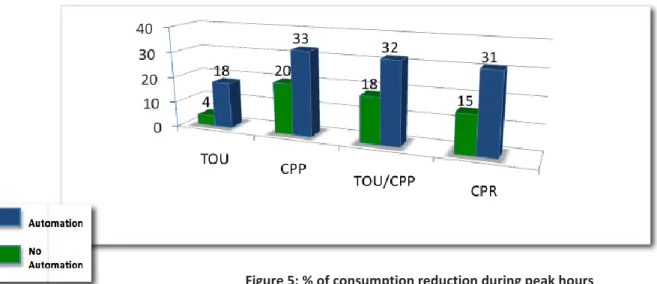
Time of Use Pricing (TOU) Daytime consumption is higher than night-time consumption. There are also daily morning and evening peaks in residential consumption. TOU tariffs aim to encouraging people to use more electricity during times when consumption in lower. TOU usually includes 2 to 3 different tariffs per day: a day/night tariff or night, day and peak hour tariffs. Some TOU pricing schemes have been on the market for an extended period of time and it is difficult to calculate their impact, however in TOU pilot tests the average consumption reduction during peak is approximately 4%.
4Load curve = usage levels. Load curves are a bit like sound waves. The higher the usage the more they go
10
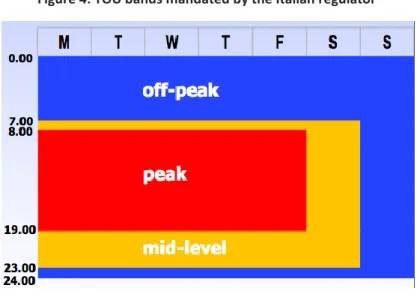
Source: Autorità per l'energia elettrica e il gas, 2008
Figure 4 provides an example of a state run TOU program mandated by the Italian regulator. A 9 hour peak hour band is relatively long for a 3 price system, as this is a long period during which to avoid consumption. This TOU tariff structure was not mandatory but an opt-in program for consumers. Utilities were, however, required to make the pricing structure available and these pricing bands were shown on all smart meters, irrespective of what pricing program the consumer was actually using.
TOU programs can also be coupled to automation. These will mean for example, that a thermostat or washing machine may be turned off or turned down for the peak TOU tariff period. The average reduction in peak consumption of TOU programs with automation is 18%
Peak Pricing (PP) is a term used in this research to describe all pricing
programs which are not daily but event oriented and meant to lower a critical peak in price or in consumption. Several of the graphs below are calculated by TOU and PP programs. A Peak Pricing program can include, Critical Peak Pricing, Critical Peak Rebates and Spot Pricing5. Critical Peak Pricing (CPP) specifies a substantially increased price for electricity use during times of heightened wholesale prices caused by heightened consumption (for example on very hot days) or when the stability of the system is threatened and black-outs may occur.
Unlike time-of-use pricing times, which are typically in place for three
5 Spot pricing is effective during peak days if an alert is used to inform customers that the price is above a set
level. In this case it qualifies as a Peak Pricing program. There are other pricing programs which would qualify here but these are the three concentrated on in this report.
11 to twelve hours a day, the periods when critical peaks occur depend on conditions in the market and might not be decided in advance. In exchange for a lower than average tariff during non-peak hours consumers agree to have substantially higher tariffs, between 5 and 15 times higher depending on the program, during critical peak hours or days. The number of critical peak periods which the utility is allowed to call is often agreed upon in advance in order to lower consumer risk. Otherwise they might be unduly inconvenienced during a particularly severe season with an above average number of peak days. Residential customers are notified the day before that the next day will be a CPP day. This may be done using emails, a warning light, mobile phone message and/or a message on their in-house display (IHD).
The programs are effective but there are some questions as to the fairness for low-income consumers who will be especially impacted by the programs as well as for those for whom shifting load may be especially difficult. This is why CPP is usually not a mandatory or opt-out tariff but voluntary for residential consumers. In California it is now mandatory however for Commercial consumers.
CPP can be combined with TOU rates, feedback and automation. Automation most often takes the form of an automated thermostat in an AC device or heating system. The thermostat turns down or off the device during the critical peak hours.
Automation increases program results:
Average consumption reduction during peak hours for CPP is
-22
%
6.
Average consumption reduction during peak hours for CPP with
Automation is
-32%.
Critical Peak Rebates (CPR) are inversed as Critical Peak Pricing tariffs. The consumers are paid for the amounts that they reduce consumption below their predicted consumption levels, during critical peak hours. These programs tend to be more acceptable to the public and to regulators alike as consumers can only benefit from participation. The peak consumption reductions of CPR have so far not been as high as CPP. Opportunity cost does not make as big an impact or communicate as effectively with end consumers as a high electricity price.
CPR is a relatively new form of tariff and there have not been a large number of programs compared here. However the average reduction during peak hours of programs used is – 15% and with automation was -31%.
Spot Pricing Programs: These programs are popular in countries such as
12 However they do not lead to consumption reductions without feedback. Even then customers will sometimes tire of checking a price that only changes slightly from day to day. In order to encourage reductions during peak price times, a display that includes a warning of high prices, telephone messages or price sensitive automated thermostats should be used. These will encourage reductions in much the same way as CPP programs or automated TOU programs.
The average spot price reduction when combined with effective feedback is 15% though an insufficient number of pilots were available to make a detailed comparison of differing spot price programs. Spot price with automation peak reductions was 19%.
Network tariffs: Dynamic network tariffs are rare for residential consumers and the average effects are not covered here. However, in reality, network capacity issues also incur costs, which the network company includes in its fees. In markets where consumption is low, such as in Germany for example – coordinating the electricity and network costs would increase the cost/benefit of the total system and increase tariff options. In Commercial and Industrial programs in parts of the USA, such as New York, network capacity is also priced and this increases the value of a MW of shifted load in areas with network capacity shortages from $28,000 per MW to $80,000.7
Home Automation: Traditionally, homes have been wired for four systems: electrical power, telephones, TV outlets (cable or antenna), and a doorbell. With the invention of the electronic micro and auto controller and the widespread uptake of digital communication technology, the cost of electronic control is falling rapidly and its uses are increasing. Through remote controllers in appliances, which can either communicate with each other and/or react to outside information, such as electricity pricing signals for example, the price responsiveness of a household will approximately double. This is called automation.
In most pilots the automation are an AC or electric heating thermostat which is set to turn down or turn off during peak periods. However, automation systems can be more advanced and include lighting, appliances, and entertainment equipment. Residents can be informed when their equipment is malfunctioning or be able to turn it on and off remotely. Automation improves the results of all energy efficiency and DR programs by between 50% - 450% depending on what is automated and the program in question. However, it also adds to the cost of rollout. Currently for example a Smart Home automation system will cost approximately €2,000. A smart thermostat is much cheaper at approximately €200-€300.
7 Malme, Ross. (2010) Residential and C&I Customer Demand Response Demand Response. Schneider
13
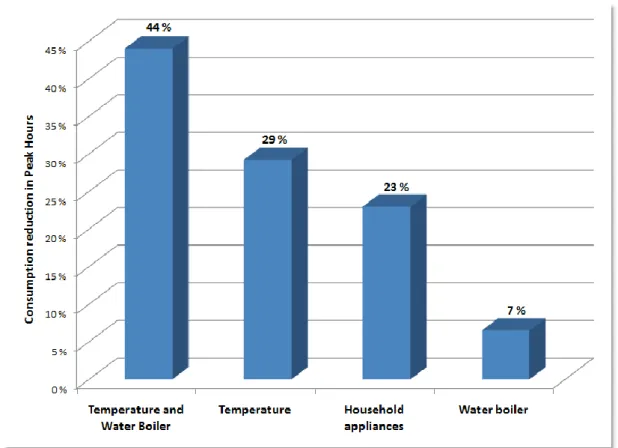
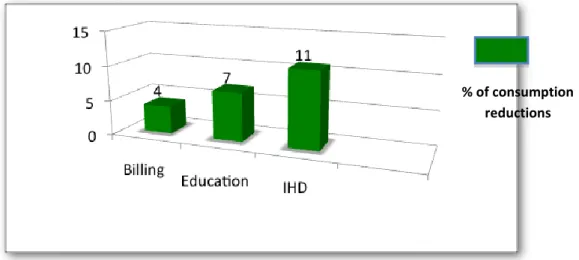
Figure 5: % of consumption reduction during peak hours
For residential consumers with high consumption levels, these costs will be made up through financial savings, especially in cooperation with a dynamic pricing program. However for small homes or apartments these prices can be prohibitive.
In DR programs this provided two sources of value, the first is the amount of load shifted, the second is the speed with which this load can be shifted. Both are of importance. Household automation enables the aggregated residential load to participate in the 10 minute market for example, increasing its value. As of now residential consumers participate in the day-ahead markets and are alerted by phone or emails of upcoming events. With automation, load can be shifted in minutes or seconds, often without the residents noticing this take place8.
1.4. Feedback Definition and Programs
Feedback programs (FP) are not time based. Their aim is to lower overall consumption and they are therefore referred to as energy efficiency programs. However, energy efficiency is a broad term, which can include adding insulation, double glazed windows, efficient heating systems etc. The aim of an energy efficiency action may be to allow someone to maintain the same behavior but while consuming less energy – to lower the energy cost of an action. For example, a person might still keep their house at 22 degrees but use less electricity than their neighbor while doing so, due to their triple glazed windows. They have not changed their behavior they have changed their physical environment.
Feedback programs aim to help consumers change their behavior through providing them with feedback / information about the consequences of their actions. This does often lead toward investments in energy
8 For more on the importance of various financial market structures see Financial Structures for a Demand
14 in emphasis and focus the two will not be viewed as directly interchangeable in this report.
Feedback programs differ from public education programs in that the information given is directly related to that particular consumer’s consumption levels and is repeated over time. This in turn enables the consumer to track and influence its own actions have on the amounts of energy consumed.
A feedback program will therefore be defined as: a customer oriented, information based program, which provides the consumer with feedback information about their consumption levels and patterns – repeatedly over an extended period of time. The aim of a feedback program is to enable consumers to change their behavior and lower their energy consumption. Feedback can be included in a DR program and it improves the results of these programs but the two are not interchangeable as one focuses on shifting consumption to cheaper times and the other on lowering over all consumption.
Sarah Darby makes a distinction in her report, written for the British Government, ―The Effectiveness of Feedback on Energy Consumption‖ (2006) between direct and indirect feedback. This distinction will be maintained here, as it is a useful tool for differentiating between what can otherwise become a confusing array of programs.
Indirect feedback is aggregated and arrives at the customers house at certain pre-decided times.
Informative billing is an example of indirect feedback. Most residential consumers in Europe now receive estimated bills, which are adjusted for the time of year and the customer's average consumption. They therefore do not accurately reflect the actual usage for a given month. The difference between the estimated average consumption and the actual usage is made up at the end of the billing period or when a resident changes electricity supplier.
Informative billing will bill for the actual consumption and provides either historical information comparing what the consumer used this month to last month or to last year during the same period. The bill may also provide information on how much the household consumed in comparison to other dwellings of the same description9. The average savings from
9 The methodology for determining the comparability between dwellings depends on the utility. Some are
more detailed than others, including number of appliances and number of residents, while others compare houses in the same area or of the same size. Comparative data is most helpful for those residents which use more than the average. Telling subjects that they already consume less than their neighbours will not encourage further savings. Utilities could therefore consider using customer segmentation in deciding content of bills.
15 informative billing is 4.6%.
Direct feedback includes communication techniques, which are immediate and directly available to the consumer. This includes in house displays, websites, or ambient displays. Consumers have continuous direct access to these sources. They provide such information as: how much energy is consumed at any given time, and the current cost or savings made. It will sometimes also allow consumers to set personal consumption goals and warn them if they are exceeded. Some feedback displays systems will provide information to the consumer about how much each of their various appliances are consuming individually. This brings the added benefit of security and ease. For example there are systems now through which a consumer can see if they have left their iron plugged in or their stove on, through their mobile phone. If the program includes automation – they will be able to turn these devices on/off or down remotely. Direct feedback can be provided in many formats, through a wide range of technology and as a re-enforcement tool within demand response pricing and automation programs.
Websites: Websites are sometimes mandated by regulators. The aim is to provide the consumer with information about their electricity consumption. California and Finland are just two examples of such markets. Websites are chosen as a means of providing feedback because they are relatively cheap. They rely on Smart Meters to collect the necessary consumption data and therefore the granularity10 of data provided to consumers depends largely on how often the meters are read or how often the information is transferred from the meter to the utility (or retailer). For example, in Norway, the meters will have the capability of reading the electricity consumption in a household once every 15min but the communication system between the meter and the network company only supports hourly readings. The information is sent in a packet from the meter to the network company once a day. This means that a consumer will be able to see his consumption in hourly segments from the day before on the utility provided website.
Websites require that the consumer enter a code to access the site. They do not remind the consumer of their presence as they must be accessed to be viewed. Though a well designed site can offer valuable information about the household’s current electricity costs, how much CO2 they are producing, how much they have saved or spent since last month and energy saving tips for the household, the interest level in such sites is generally low. There is a risk that average percentile of those who access them tends to only be around 2-5% and therefore their impact on national consumption levels will be below measurable levels. If however, a website is part of a larger information package this is not necessarily
10 Data granularity means how detailed the data provided is. Do they give real time readings, every 15
16 In the USA, Opower cooperates with utilities such as PG&E to produce a website, telephone messages and informative bills for end consumers. They combine energy data with social data, such as income levels, household size, home ownership etc to produce highly segmented, appropriate messages for consumers. They now have over 2 million residential consumers on the program and the average savings are between 2% to 3% depending on the region. The average cost per kW saved is only $.03; the electricity costs less to save than to generate.
There are also cases in which motivational factors have been used to encourage consumers to access the site. For example, SEAS-NVE in Denmark has created a program where every customer who accesses their site and enters their meter reading has the chance to win 50,000 DKK or approximately €6,700 in a monthly lottery. This is combined with innovative customer segmented information and an innovative marketing plan directed at individually identified customer segments (See Customer Segmentation below). The program is highly effective and consumers also saved large amounts of electricity – an average of -17.4% for 30,000 customers involved. The program is ongoing. This indicates that websites can be effective as part of a larger program package.
In house displays (IHD) are displays, which hang on the wall or sit on a counter and provide close to real time information about household electricity consumption. They also provide a variety of other data. For example the display now being provided in the Irish ESB pilot allows people to: set daily budgets for how much they want
to spend, informs them of their success levels, what the current price of electricity is and provides information on how much they have spent so far this month. It provides them real-time & historical information on their electricity usage & costs. The ―home screen‖ for the dynamic display unit is the key screen that the customer always sees when the device is switched on, while further information can be gained if desired through navigating to other screens.
17 This could be considered a good basic display unit and the residential energy reductions from such units average approximately 11%.
More advanced units include information on how much electricity individual appliances are consuming in a household, though this requires some type of in-house communication network in order to provide the necessary information11. These displays can alert the owner if an appliance has been left on or is faulty and consuming too much. They also educate the owner as to which appliances consume most in a household. Most residential consumers are unaware or ill informed about what in fact requires most electricity and many of them actually forget to consider entire appliances – such as the fridge (BeAware, 2009). In house displays also have the potential to serve a social role. There are products being sold now in France for example, where a family can access the consumption levels of an elderly relative. This acts as a warning system both for over consumption – the stove has been left on, or to let the relatives know that the relation is perhaps ill as nothing has been consumed that day. These are only a few examples of the varying types of information displays now provided.
Ambient Displays differ from IHDs in that they do not provide specific consumption information but rather signal to the consumer messages about their general level of consumption and/or a change in electricity prices. Many ambient displays have the attributes of being attractive and intuitive, this adds to their customer acceptance potential. Two examples of these are the Energy Orb sold by PG&E in California and the Energy Tree by Interactive Institute in Sweden.
Figure 7: The Energy Orb PG&E ($149.00)
Originally designed to track stock market prices, the Energy Orb now can also be programmed to change from green to yellow to red depending on the current electricity price
11 There are several forms of such networks but they will not be detailed here as the information is technical
18 Figure 8: The Energy Tree Source: Interactive Institute
The medium on which information is displayed can vary and is continually developing. The Energy Tree continues to grow as long as residents stay within their pre-set consumption goals. If they go over their setting, the tree begins to die.
Mobile phone and I-Phone application displays are becoming increasingly popular as these can warn consumers of problems while they are away or in time to react to higher prices in the electricity market, when combined with dynamic pricing tariffs. Using phones also avoids the environmental and financial costs of supplying a display and can be timely – showing only when consumption has gone above the consumer’s set goals etc.
19
2.
PILOT COMPARATIVE ANALYSES
As part of Respond 2010, 80 pilots, which included a total of 124 programs have been broken down into a total of 15 elements and analyzed. Each pilot did not include all of the 15 elements and sample sizes therefore vary. Due to the importance of successful communication and feedback in residential DR both feedback and DR pilots were reviewed. Disclaimer: It is important to note that comparing pilots accurately contains many inherent complications. Pilots are not constructed in order to be comparable. They are constructed to fit the needs and budget of the utility or research institute and the methods as well as the quality differ substantially. For example, how energy savings are calculated differs, it can be based upon households’ historical data or a control group’s data. Sample sizes and selection methods differ. Some pilots are large containing 30,000 customers and are representative of the utilities customer base while others are made up of the engineers who constructed the program! (These were rejected) Further differences will be discussed during the analysis, however what this means is that the findings below can only be taken as useful indications of which elements influence pilot results, not as an absolute recipe containing exact percentile numbers. They are rough indications of what tends to work and not work and to this extent they are useful.
A pilot is only as good as its designers: Residential DR works, and usually when a pilot fails to gain results, closer analysis reveals structural faults in the pilot. Two extreme examples will be detailed here. A Government research institute in Europe conducted a feedback pilot where consumers were provided with real time consumption data in graphical form. However, the literature accompanying the displays instructed the consumers to consume as usual – in other words not to lower consumption. The average consumption reductions with an IHD are 12.6%; the results for this pilot were under -1%. The insight this pilot provided was useful for this research, as it clearly indicated the importance of the messages and information provided to sample groups. Another even more extreme example was found in our sample. A government research institute decided to run an Automated CPP pilot. The success rate for these is close to 100% – the most effective form of load shifting for residential consumers currently in use. However this institute managed to achieve an overall increase in consumption during peak hours. The institute had previously supplied a group of high consumption residents with smart meters and it was these they decided to use as their sample. However the control group had average consumption levels. This meant that the treatment group’s consumption was substantially higher than the control group’s from the outset.
20 A portion of this treatment group was then given automated thermostats for their electric heating systems. However an error was made in the timing device. The heat was turned off prior to the CPP event and turned on when prices were highest!
The results? The customers without the automation achieved 0 reductions compared to the control group. The customers with the automation increased consumption during CPP hours, and received higher electricity bills as a result.
When a program fails or even when it achieves amazing success, it is necessary to analyze the actual pilot in question to ascertain the quality of the research before pronouncing whether the program, feedback system, pricing structure… is likely to succeed or fail in a real market situation.
This is one motivation for comparing the collected results of many pilots. In comparing the evidence of many studies covering tens of thousands of consumers, the idiosyncrasies of individual pilots is mitigated and it is possible to ascertain the overall success rate of certain program types. This is one of the aims of this section.
The influencing factors reviewed here are:
1. Feedback program results
2. Climate 3. Regional differences 4. Duration of pilots 5. Season of pilots 6. Organizers 7. Customer segmentation
8. Incentives to join pilots
9. Automation
10. Education
11. Methods of communication for alert
12. Content of feedback
13. Length of peak hour tariffs
14. Tips/education
15. Sample size
All of the above factors were analyzed for each pilot when the factor was available. Some were found to provide conclusive results and others showed little influence or the findings were inconclusive.
21
2.1. Results Pilot Comparison
This section provides the results of the pilot comparison overviews. The aim has been to compare overall pilot results and also look for more detailed factors that may contribute to success. As with other similar studies the number of direct comparisons which can be made between pilots is limited due to the widely differentiating external factors.
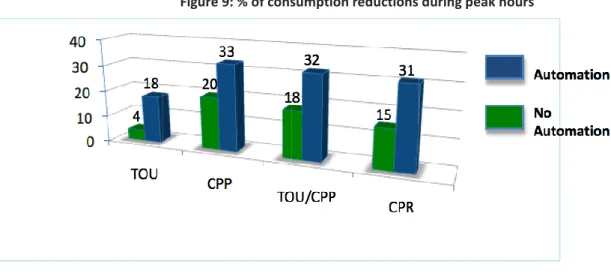
Figure 9: % of consumption reductions during peak hours
Figure 9 provides the average consumption reductions or load shifting during peak priced hours, not overall electricity consumption reductions. TOU peak consumption reductions are the lowest but they also occur daily which CPP and CPR produce greater reductions but only for critical peak days. Automation improves the results of the pilot by 50 – 450%. Programs with and without automation have been compared. The above pricing programs do not represent all the dynamic pricing programs available. However they represent the most popular and the programs for which there has been sufficient piloting to make comparisons.
Program success with automation is dependent on the technical ability of the companies involved, marketing and the cost/benefit ratio of the program - how valuable is the load, which is to be shifted against the cost of automating a household to a particular level. This varies in each market and as the cost of technology decreases, more appliances, lighting systems, thermostats… can be automated with a positive financial outcome.
The marketing campaign will be decisive in maximizing the number of consumers who participate and the amounts they are willing to pay for technology. During piloting, technology is often provided for free. During rollout this may not be cost/effective. These factors, the cost/benefit and the technical/marketing skills of the companies involved are beyond the scope of this section.
22 The price of peak electricity is decisive in deciding the financial benefit of automation however a large single source of load, such as a central air-conditioning unit or electric heating will also improve the financial outcome. This single source of load means that significant savings can be made through one technical device – the intelligent thermostat.
2.2. Source of automation and results
Figure 10: Comparison of peak clipping and automation locations
Figure 10 provides a comparison of automation locations and peak reductions. Only TOU, CPP and CPR are included, as automation does not depend on the motivation to change behavior.
Temperature includes automated AC and electric heating thermostats. The reduction in consumption for pilots using this type of automation can reach 45%. Automating more than one source is more effective than a single source especially if the sources use significant amounts of electricity. Automated heating / cooling and hot water deliver higher results than Temperature alone. However automating several home appliances, such as the dishwasher, washing machine and fridge may only result in approximately the same level of savings as automating a single
23 AC unit.
It is also important to notice that the results of pricing and behavioral change can produce similar results to automated results. For example, ―None‖ (no automation) actually produced on average higher savings that automated the hot water heaters12.
However there are limits to the speed with which consumers can react to pricing signals manually. Less than half an hour reaction time is considered too fast for Commercial consumers to participate manually in a DR event. A day ahead is the fastest that the residential population can react manually. This means that a utility can only ask residential consumers to shift load if they know this will be necessary the day before an Event. This decreases the value of residential DR. Automation enables fast or instantaneous, reaction times as well as controllable levels of reduction – meaning that it is available during unplanned systems emergencies.
Critical situations also do not always occur when residential consumers are home and awake. They may be away or sleeping and unable to react. Automation allows for load reductions when residents are unavailable to make adjustments manually.
2.3. Pricing programs and overall consumption reductions
Critical peak clipping programs and TOU also produce overall energy consumption reductions as well as savings during peak hours. This energy efficiency is a bi-product of the focus of these programs.
All pricing programs, even those such as CPP which are called only a few days a year, generate overall energy savings. The savings during peak hours for such programs are too small to be measured, however the automation installed and the increased awareness of consumers produces the savings seen in Figure 11.
12 This even though the graph combines the results of TOU and CP programs which lowers the results of
24 Figure 11: Overall aggregated consumption reductions in DR and feedback pilots
Feedback and education pilots have also been included. The aim of these programs is to reduce overall consumption and they are included here only to provide a comparison to the saving made by pricing programs. Overall, pricing programs produce less than half the savings of a feedback program.
The CPR +TOU pilots and the CPR + Spot Price pilots are included to provide examples of the influence of home automation. If an appliance such as heating, cooling and water heaters are automated to react to TOU and/or relatively low Spot Prices, the automation will likely be activated daily. When this is done, large overall consumption reductions may be produced, as well as a lowering of consumption during peak hours. Home automation can produce savings of between 20 and 50% depending on the efficiency of the original system and the level of automation introduced.
25
2.4 Method of Event alert and Critical Peak Reductions
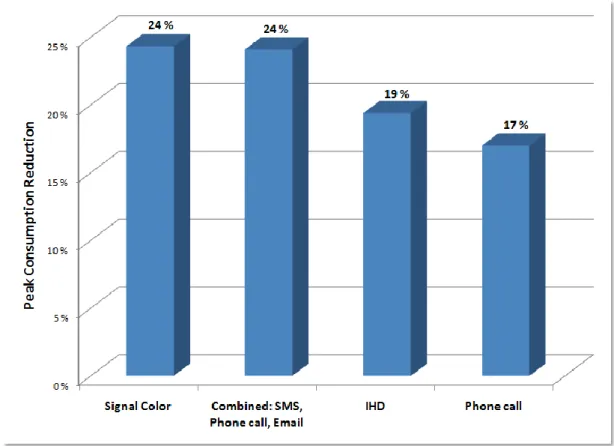
Figure 12: Method of communicating Critical Peak Event alerts to consumers
Unless DR programs are automated (and often even if they are) consumers need to be alerted of critical peak events so that they can lower their energy consumption manually, by turning down their thermostats or taking some other action. Utilities will therefore need to alert participants of an event the day before it takes place. Usually the utility will do this in a variety of ways, beginning with the most cost effective such as an email, then text messages and moving toward a phone call.
The comparative results of methods for alerting customer show that they are relatively equal. However, in this sample IHD are used in conjunction with automated pilots only. They do not provide a dependable means of communicating an event where customer reduces manually as residents may neglect to look at the display that day.
Reducing the number of stages in successful communication
Signal colors have been used alone, without automation to good effect to alert of a peak event. It seems that the ambient light signal is as noticeable as a telephone call combined with email and SMS - or more so. This raises one of the challenges of communicating with
26 multi-member households who consume most energy. Single member households are generally low consumers and will not shift large amounts of load. Therefore it is particularly important that pricing program alerts are designed to communicate with multi member households.
A call coupled to a SMS and an Email will succeed in alerting one member of a household. Unless this member communicates the information successfully, the alert will fail. Therefore, for a call, email and SMS alert to succeed two stages of communication must take place within a home: first the receiver must get the message, and then he or she must pass it on. Yet, it is perfectly possible that the father will not even see his son that day; the son will come home and wonder why the house is so hot, turn up the air-conditioning and the household will fail to respond to the CPP Event.
Ambient signals make communication a one step process and mean that the utility is not dependent on the household member's ability to communicate with each other. This may also be true because while a call will be made the day before to one member of the family, a red light on a display in the kitchen will be seen by the entire family the day before the event and on the event day itself. As anyone trying to arrange a family activity will know, the chances of message being forgotten between one day and the next by someone is high. Therefore the day of reminder for all household members is valuable.
In other words, though all of the above forms of alert can be implemented, ambient (bright) visual signals are effective because they make a two step communication process a one step communication process and they offer a day of reminder, providing a continuous reminder that prices are high. The Energy Orb is one example of an attractive and effective ambient display, which is currently on sale and in use.
2.5 Load Shifted in Comparison with Price Multiples
Residential Consumer Price Elasticity (what percentage consumers reduce consumption in reaction to price increases) has been an important subject of research for those designing time based pricing programs. Consumers do decrease consumption as prices rise but the level to which they do so depends on a variety of factors. This means that although this is an important motivator of DR it cannot be used to the exclusion of other factors. Though overall consumption reductions increase as a price increases they do not do so consistently between programs.
Customer’s reaction to Dynamic prices cannot be calculated in terms of absolute price. They need to be calculated in terms of multiples of the base price. This is due to the fact that customers do not react only to
27 the actual cost of electricity they react to the change in cost of electricity. This is why a sudden increase in electricity costs will cause an increase in customer switching in a national market. For example, in 2006 in Norway drought and power-plant failures caused prices to rise steeply. In the first quarter of 2007 more than 70,000 households and 8,000 businesses found a new supplier. However, in the following 3 quarters less than 50,000 household switched. The reaction to the sudden price increase was over. Therefore price elasticity or reaction to price is calculated here in multiples of the base price.
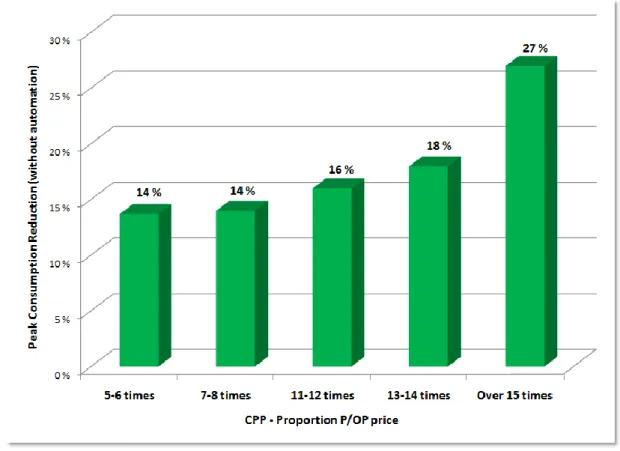
Figure 14: Percentage of load shifted as compared to peak hour prices in multiples of base price
Figure 14 depicts customer price elasticity in multiples of base price. Reductions gradually rise in reaction but not evenly. When these aggregated results were broken down to show results of single pilots, the reaction to price appeared random as some pilots with higher prices attained lower peak clipping results.
During the California State Pilot price elasticity was found to be dependent on three variables: dynamic price, weather and a single large source of consumption (in this case central air-conditioning). Weather influences elasticity. Regions with more extreme temperature variations tend to produce larger reductions in peak consumptions. Therefore a region with higher or lower temperatures will react more strongly to price than those with milder temperatures. A large central source of
28 consumers can make substantial cuts in their consumption. Consumers groups with higher electric heating of AC penetration will therefore also shed more load than those without.
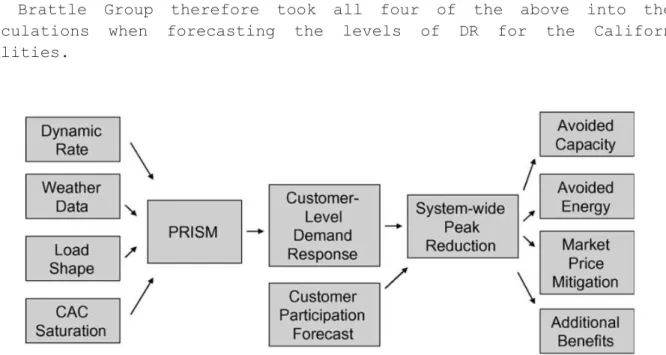
The Brattle Group therefore took all four of the above into their calculations when forecasting the levels of DR for the California utilities.
Figure 15: PRISM Calculation model for forecasting DR results. Source Brattle Group13
The PRISM calculation model of customer price elasticity in Figure 14 produced an accurate tool for forecasting the price elasticity of participants in the California State Pilot. However the limits of these types of models for forecasting regional dynamic pricing results need to be acknowledged. The members of a pilot sample group go through a marketing, recruitment and education process to be part of the pilot. This heightens their awareness of the pricing tariffs in a manner, which has proved difficult to reproduce in California now, during rollout. Regional programs need to be given time to get established. However, it is important to keep in mind that what will serve well as a mathematical forecasting model when a selected group of screened consumers is involved, may need to be adjusted when the consumer group is potentially the entire population. Here the level to which the marketing and educational campaigns have succeeded in engaging that population will be central.
13 Faruqui, Ahmad, Ryan Hledikand, John Tsoukalis. (2009) The Power of Dynamic Pricing. The Electricity
29
2.6 Feedback Pilot Results
The role of feedback for residential consumers differs between the USA, Australia and Europe and it is therefore important to be precise about what exactly is meant. For example, ―feedback‖ in the USA is often coupled with pricing programs and seen as a tool which can raise awareness of peak consumption periods, helping commercial or residential consumers to shift their consumption. In Europe, feedback has a high profile independent position within the industry. It is primarily used to raise awareness of overall consumption patterns within a home or business and encourage consumption reductions; it also has strong political connotations as providing consumption information is mandated by the European Commission. ―Feedback‖ therefore has very different connotations depending on the market, and the actual displays will often provide different types of information.
The programs compared below are pure feedback programs in that no pricing or automation tools were used. The consumption reduction % shown is total consumption reductions. The three types of pilots compared here are those where enough representative pilots to make comparison were available. Ambient displays and website are not included here though they are included as feedback mechanism for pricing pilots.
Figure 16: Feedback Pilot Results
Each of these types of feedback performs their own function and can complement each other or improve the results of DR programs.
Informative Billing can produce results of between -1% and -7%. Its advantages are that it is cheap and does not require customer recruitment to gain participants.
% of consumption reductions
30 The information provided on bills falls into three categories:
1) Historical numerical and graphical consumption information depicting comparative consumption data from previous months or from the same month last year. The comparative data makes it easier for residents to link their own behavior to their monthly electricity bill.
2) Relative consumption level as compared to either household in the same neighborhood or in houses of a similar size. This practice has shown mixed results. It encourages those with higher than average consumption to lower but does not benefit those that already have low consumption. They receive the message that they are already doing well. Considering the level of electricity wasted in most homes, it is possible that even consumers with good consumption levels, as compared to neighbors would have the potential to save electricity. This is a concrete example of the importance of customer segmentation and of providing a particular consumer with information that is appropriate to them.
Figure 17: An informative bill
3) Energy saving tips. Energy saving tips can be included. The bill then also becomes an educational channel through which consumers learn how to save. For this to be effective it is important to understand where customers are in their previous knowledge levels and to ensure that information is relevant.
In house displays or IHD provide immediate continuous feedback. The displays now in production are attractive and interactive. They also provide a wide variety of information results. The fact that the technology is improving can be seen in the improving overall results of feedback pilot studies. Educational material, information presentation and interactive potential are all increasing. Large public studies are now achieving consumption reductions of 13-17% where the average is 11%. IHDs provide the most consistent results of any pilot type reviewed in
31 this report; over half of the studies provided reductions of between 9 and 13%.
Figure 18: Dynamic In-House Displays
Source (from left to right): Philip Lewis, Changing Behaviour and The Interactive Institute
Bill and IHD comparison research has demonstrated that consumption information is culture sensitive. Education, income and culture seem to be the main factors here and they influence such factors as what information will be of most interest and how this information should be presented, whether graphically, numerically, or pictorially. Consumers with a low education level will have difficulty understanding graphical information while educated consumers may find pictures simplistic and prefer graphs. The level of detail desired will depend partly on the interest level of the consumer. Another factor which can be taken into consideration is that since these devices are education devices – what will be interesting in the start will become boring over time. IHD are now taking these factors into consideration, offering a variety of data, different screen options on the same display and warning signals for when consumption is particularly high or exceeds pre-set goals. (More on customer communication in Education and Customer Segmentation below)
2.7 Duration of Pilots
Pilot length can be limited by budget or constrained by the fact that the utility needs to make a decision on rollout within a particular period of time. However, timing a pilot wrong can lead to results that are either too high or too low.
32 Figure 19: Length of DR pilot and aggregated consumption reductions – without automation.
In figures 19 is shown the pattern of aggregated consumption reductions in pilots of varying lengths. Consumers must almost always go through an application and selection process in order to take part in a pilot. This increases their interest in the program. The technology provided is also new and interesting. Therefore the first 1-3 months of results can be higher than the rest and if pilots terminate after 3 months, results may be artificially high. After this point interest and results lower a period. New habits have not yet formed, the existing household equipment has not been replaced and the newness has worn off.
33 Figure 20: Pricing pilots and results depending on the length of pilot
Figure 20 demonstrates the peak hour reduction results in pilots of varying lengths. The aggregated and peak clipping results are different but the general shape remains the same.
The results of Figures 19 and 20 are influenced by the spread of pilot types - between pilots of differing lengths. For example, over 80% of the pilots over 24 months long are TOU pilots. It is therefore logical that these will show lower peak clipping percentages. The same is true of 4-6 month; the pilots with the highest multiples of base price (the highest dynamic prices) are there. However, when these elements were removed in different orders by the researchers, the general shape of the results remained the same. These findings were therefore kept as they are, without adjustment.
DR and feedback teach residents new consumption habits and they also encourage consumers to purchase efficient home appliances. The combined effect of these may be to increase the results slowly over time. It is therefore recommended by organizations such as the Electric Power Research Institute (EPRI) that pilots run for at least 24 months in order to gage the full influence of a particular program14. After this point either further improvement could be tested or the utility can continue to measure the results of the pilot while moving forward with rollout
14 B.F. Neenan, J.K.G. Robinson (2010) Guidelines for Designing Effective Energy Information Feedback Pilots:
34
2.8 Season of pilots
Climate and the effectiveness or particular programs is sometimes connected. Extreme temperatures tend to cause more severe peak consumption hours either due to AC or electric heating. But the same appliances also provide a good single source of shiftable load and consumers also tend to shed more load in extreme temperatures.
Figure 20 depicts the relative reductions of Critical Peak Programs and TOU in summer, winter or year-long pilots, without automation. TOU is not influenced by seasons but the results are approximately half of those that continue all year. There is some evidence that people reduce higher percentage of their load in warm climates, however the deciding factor is not summer of winter but sources of load.
Figure 21: The relative influence of season on Critical Peak pilots and TOU without automation
For example in British Columbia feedback pilot (2007) residents lowered their consumption by 2.7 percent in summer and up to 9.3 in winter. The increased reductions are due to electric heating source availability during the cold winter months and customers awareness that their costs
35 will be particularly high in these months15. The higher overall success of year-long pilots points to the ability of consumers to adjust over time as discussed the section ―Pilot Length‖.
Figure 21 indicates that residents are more willing to be too hot than too cold. Peak consumption reductions are slightly lower in cold climates than hot climates but they can be mitigated through marketing, customer education and automation.
2.9 Regional differences
A statistical comparison was made of pilot types and regions. These were divided up as the USA, Canada, Europe, Australia and Other. Feedback results, price elasticity and uptake rates were compared. The statistical differences between feedback and dynamic pricing pilots throughout these regions were inconclusive. However it was clear that DR works in all the markets reviewed though each type of program is not equally appropriate for each market. The type of pilot which is going to be most appropriate will depend on the load profiles of residents and the requirements of the utilities.
Factors which were noted but could not be conclusively proven:
Population mobility is a minus. During the California State Pilot 20% of the sample group dropped out, most of these due to residents moving house. Such a high turnover of participants make behavioral change programs more challenging to establish. Habits and the acquisition of new, more efficient appliances takes time and stability, each move represents an interruption in this stability – even if the consumer remains with the same utility.
Cold climates increase energy consciousness. Questionnaires and an IHD device was provided to residents in Dallas Texas, Vaceville California, Quebec and British Columbia16 to gage their knowledge about what appliances consume most in a home and their reaction to a feedback display. The consumption reductions increased the farther North the residents lived. Texas had to drop out due to a failed recruitment campaign. Californian residents showed the least interest in their display (the display registered the number of interactions) while those in Quebec used the display most. The Californians scored the lowest on the questionnaire but also learnt the most from the education material
15 Dean C. Mountain, Ph.D (2007) Real-Time Feedback and Residential Electricity Consumption: British
Columbia and Newfoundland and Labrador Pilots. Mountain Economic Consulting and Associates Inc. June 2007
16 R. BRUCE HUTTON, GARY A. MAUSER, PIERRE FILIATRAULT OLLI T. AHTOLA (1986) “Effects of Cost-Related
Feedback on Consumer Knowledge and Consumption Behavior: A Field Experimental” JOURNAL OF CONSUMER RESEARCH. Vol. 13 * December 1986.
36 used their displays to help reduce consumption more effectively than the Californian residents.
Similar evidence has also been found in Europe. Both Enel in Italy and Iberdrola in Spain have had difficulty in motivating consumers to engage with IHD while energy savings in Finland, the UK, Denmark, Sweden and Holland have ranged from 11% to 17%. This does not mean that engaging customers in Spain and Italy is impossible but it means that it can be more challenging. Programs should perhaps include a variety of channels and may need to be combined with dynamic prices. CPP has worked well in warm climates and been effective – despite an apparently lower overall energy awareness level. Residents in areas of extreme heat have responded more to pricing signals than those living in more moderate climates.
Uptake: Pilot success rates are measured in consumption reductions. Rollout success will be dependent on uptake levels and cost/benefit. Often residential DR is coupled with Smart Meter rollout. This carries with it a set cost. Over and above improved internal processes and the increased total efficiency of the system, customer service programs represent the potential to realize a profit margin from SM. In the Australian study, DR accounted for 6-12% of potential benefits generated by smart meter rollout17. In order for these benefits to be realized, successful customer involvement will be essential.
When this is the case, even if the expected return from DR is a minimal percentage of the total cost, the uptake and acceptance rate for programs will be crucial to Smart Meter as well as DR success. Uptake seems to vary between regions. ESB has seen an uptake for their TOU/Feedback pilot of 30% from their mail campaign; the same has been true of German pilots, (when technology is free). Southern European utilities have greater difficulty in gaining the interest of consumers as total energy costs are lower. In the USA the expected uptake rate is closer to 20% but only after continuous mail campaigns and telephone contact, in Australia 25% and higher has been achieved through mail campaigns. This means that a European and Australian utility can count on a higher level of interest than a US utility. As the cost of SM rollout will be similar, this potentially increased the cost/benefit of DR and SM in some regions over others.18
17 Henney , Alex. “Australia” Quoted from: Energy Australia, Cost Benefit Analysis of Smart Metering and
Direct Load Control: Phase One Report 7 November 2007.
18That said – because average household consumption is comparatively low in Europe, approximately 5,000
kWh per year as compared to 15,000 kWh per year in the US, the cost/benefit of residential DR is more difficult to justify in the EU.
37 This being said, the US market is still perhaps 5-10 years ahead of the European market when it comes to MW shifted through Demand Response annually. This is due to a clear regulatory framework which has provided the regulatory security needed for private business investment and development. Cultural differences of residential consumers are only one of many factors influencing DR. (See the Respond 2010 article Market Drivers Financial for a further discussion)
2.10 Incentives to join / complete pilots
Financial incentives to join a pilot seem to increase pilot results. Figure 22 depicts the influence of the use of incentives for TOU and Peak Pricing pilots. The balance of automation between the two groups – with and without incentives was analyzed to ensure that the reaction to incentives was behavioral rather than technically based. It was found that 2/3 of automated pilots had not used incentives – meaning that the results of pilots without incentives would have been lower if it were not for automation improving their results.
Even in a study such as this, where over 120 programs are compared, it is not possible to state that one factor is influencing results. In this case, many of the more advanced high budget pilots, have used financial payment incentives to ensure a representative customer sample enters and completes the pilot program. These tend to be attractive, engaging pilots in other ways as well, and this may be the reason why pilots which have used incentives have succeeded in achieving results between 2 and 3 times higher than those without.