ERC Working Papers in Economics 05/04
June 2005Economic Research Center
Effect of Private Tutoring on University Entrance
Examination Performance in Turkey
Aysıt Tansel
Department of EconomicsMiddle East Technical University, Ankara e-mail: atansel@metu.edu.tr
Fatma Bircan
Department of EconomicsMiddle East Technical University, Ankara e-mail: bircan@metu.edu.tr
Effect of Private Tutoring on University Entrance
Examination Performance in Turkey
*By Aysıt Tansel Department of Economics
Middle East Technical University, Ankara Phone: 90.312-210 2057 Fax: 90.312-210 1244
E-mail: atansel@metu.edu.tr and
Fatma Bircan Department of Economics
Middle East Technical University, Ankara Phone: 90.312-210 2056 Fax: 90.312-210 1244
E-mail: bircan@metu.edu.tr
April, 2004 Revised: February, 2005
Key Words: Private Tutoring, University Entrance Examination Achievement, Turkey JEL Classification: I2, J10
Abstract: There is an excess demand for university education in Turkey. Highly competitive university entrance examination which rations the available places at university programs is very central to the lives of young people. In order to increase the chances of success of their children in the university entrance examination parents spend large sums of money on private tutoring (dersane) of their children. In this study, we investigate the factors that determine participation in private tutoring and the effect of private tutoring on getting placed at a university program. We further examine the impact of private tutoring on the scores of the applicants in the university entrance examination. The results indicate that controlling for other factors those students who receive private tutoring perform better in the university entrance examination.
* We would like to thank the Student Selection and Placement Center (OSYM) of Turkey for allowing us to use
the results of the 2002 Survey of the Applicants to the University Entrance Examination on their premises. In particular, we are grateful to Prof. Dr. Yıldız Kuzgun, the research director of the OSYM, for insightful
1. Introduction
There is a large excess demand for university education in Turkey. There are a number of factors responsible for this outcome. At the public universities tuition fees are nominal. At the same time highest private rates of return to education are attained at the university level (Tansel, 1994, 2001, 2005). There are further advantages to acquiring a university education. For instance, university educated men serve their military duty as an officer rather than as a private soldier. A university education also provides a prestigious position in the society. In order to meet the high demand a number of new universities were established in the early 1980s and then again in the early 1990s. Further, operation of private universities was also allowed in the late 1980s. The existing system is, however, far from meeting the high demand. There is a highly competitive national university entrance examination. This examination system rations the available places at the university programs. Parents have their children receive private tutoring to increase their probability of success at the university entrance examination. The private tutoring centers are popularly called “dersane” in Turkish. Over the years the private tutoring centers became a large industry in Turkey. Tansel and Bircan (2005) survey important features of private tutoring in Turkey and find that private tutoring expenditures are a very significant item in the budgets of most households. Such university entrance examination and private tutoring are also common in Korea (Kim and Lee, 2001), in Hong-Kong (Bray and Kwok, 2003) and in Japan (Stevenson and Baker, 1993). See Bray and Kwok for a survey.
Although the studies on private tutoring or the effect of private tutoring on university entrance examination is scanty, there are a number of studies that examine the university entrance examination scores such as Psacharopoulos and Tassoulas (2002). This topic in Greece is also addressed by Papas and Psacharopoulos (1987 and 1993) where university entrance examination is reported to be a very important national event a it is in Turkey.
In this study, we use the results of the 2002 survey of the applicants to the university entrance examination and their performance in this examination. This survey was conducted by the Student Selection and Placement Center (OSYM) of Turkey. We, first, investigate the factors that determine student participation in private tutoring with a probit equation and examine the impact of private tutoring on whether or not an applicant is placed at a university program. Next, we examine the impact of private tutoring on various test scores of the applicants in the university entrance examination. The results indicate that holding other factors constant those applicants who receive private tutoring obtain higher scores in the university entrance examination and the probability of their being placed in a university program is higher.
This paper is organized as follows. Section 2 gives information about the university entrance examination in Turkey. The data used in this study is introduced in Section 3. Section 4 explains the variables used in the regression analysis. Section 5 gives the estimation results. Conclusions appear in Section 6.
2. University Entrance Examination System in Turkey
The university entrance examination is highly competitive. All high school graduates are qualified to take this examination. The number of students taking this examination in 2003 was 1,451,811. Of those taking the examination only 21.5 percent was placed in a two or four year university program. About two thirds of those taking the examination were repeat takers while one third were fresh high school graduates sitting in the examination for the first time. The examination covers five topics; these are Mathematics, Turkish, Sciences, Social Sciences, and foreign languages.
Students in high school choose one among the five broad fields of study. These fields are sciences, Turkish-mathematics, Social Sciences, foreign languages, and arts. According to
their high school background in one of these fields, students declare the area they would like their examination results to be evaluated. The university departments are classified into four categories. These are quantitative-based departments, verbal-based departments, quantitative and verbal equally weighted departments, and the foreign languages departments. There is a weighting system for the scores in each of the fields preannounced by the Student Selection and Placement Center. For instance an applicant who plans to get into one of the departments in the verbal-based category has to answer questions at least from the Turkish, Social Sciences, and Mathematics sections of the examination. Those applicants who would like to get into one of the departments in the quantitative-based category has to answer questions at least from the Turkish, Sciences, and Mathematics. Applicants who would like to get into one of the departments in the Turkish-Mathematics equally weighted has to answer at least from the Turkish, Mathematics and Social Sciences tests. The weights of the scores in each test change according to the fields the applicants would like to be evaluated. The raw scores in the tests are further weighted by indices for high school performance and other factors. At the end of this elaborate system of weighting final scores are determined. Applicants are then placed at a two-year or four-year program of one of the 76 universities in the country.
3. The Data
The data used in this study comes from the 2002 survey of the applicants to the university entrance examination and their examination results. This survey is conducted every ten years. There are responses of a total of about one and a half million applicants. We acquired a random sample of about 8 percent totaling 120 thousand observations. This sample covers applicants with high school backgrounds in the fields of Sciences, Turkish-Mathematics, and Social Sciences. There were random samples of 40 thousand observations from each of these backgrounds totaling to 120 thousand observations. The survey collected
information about personal characteristics such as household income, high school graduation degree and whether the applicant took private tutoring or not and if so, how many hours and during which years in high school. Further, we know the scores received by each applicant in each of the Mathematics, Sciences, and Social Sciences tests depending on their high school background. For the students with Science background we evaluated their scores in the Science, Mathematics and Turkish tests separately. For the students with Turkish-Mathematics background we evaluated their scores in the Turkish-Mathematics, Turkish and Social Sciences tests separately. For the students with Social Sciences background we evaluated their scores in the Mathematics, Turkish, and Social Sciences tests separately.
Table 1 presents the percentages of students who receive private tutoring according to the education level of their mother and father. There is clear evidence that the percentages of the applicants who receive private tutoring increase significantly with the level of education of the mother from 26 percent for the category of illiterate mothers to 92 percent for the category of mothers with Ph.D. degrees. Similarly, the percentages of the applicants who receive private tutoring increase significantly with the level of education of the father from 22 percent for the lowest educational category to 84 percent for the highest educational category. Table 2 shows the relation between private tutoring and the mother’s and the father’s employment statuses. The percentage of those applicants who receive private tutoring is highest with 66 percent for those whose mothers are wage earners and lowest for those whose fathers are not working with 32 percent. Substantially high percentages of applicants receiving private tutoring are observed if the mother or the father is an employer.
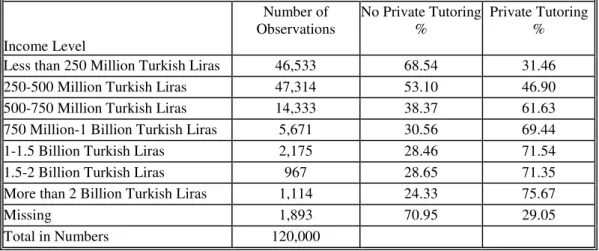
Table 3 presents the percentages of those applicants who receive private tutoring by the income level of their households. The figures indicate that the proportion of those who receive private tutoring increase monotonically as the level of income of the household increases. The percentage of those who receive private tutoring is considerably high even at
the low levels of income. For instance, at the second category of income level, which corresponds to about 225 USD per month, about half of the applicants, 47 percent, received private tutoring. Table 4 presents the relation between private tutoring and the high school graduation degree of the applicant. The table indicates that among those applicants who graduated with high honors from high school about 61 percent receive private tutoring. This percentage declines, as the high school graduation degree gets lower. Thus, the higher the high school graduation degree is, the higher the percentage of those receiving private tutoring. Table 5 presents the reasons of the applicants for receiving private tutoring while he/she is in the 9th, 10th and 11th grades of the high school. We observe that in the senior year in high school (11th grade) the percentage of those who receive private tutoring in order to prepare for the university entrance examination is highest with about 47 percent. The relation between receiving private tutoring and getting placed in a university program is observed in Table 6. Of those applicants who got placed at a university program about 55 percent received private tutoring while the remaining 45 percent did not receive private tutoring
4. The Model and the Variables
We estimated probit equations for receiving private tutoring and for getting placed in a university program. We further performed regression analysis of the scores received in various tests depending on the applicants’ background. The independent variables used included the following. A dummy variable indicating that the applicant is female, the base category is male. Mother’s years of education, father’s years of education. Dummy variables for mother’s and father’s employment statuses such as wage earner, employer and self-employed. The base category is non-worker. We also defined dummy variables if mother’s and father’s employment status is missing. Information on household income was collected for nine categories of income where the applicant choose one of the categories. We took the
mid-point of each category as the household income. The lowest two categories of income were marked by about the same percentages, and amounted to a total of 78 percent of the total observations(see Table 3). Next, we defined dummy variables for the high school graduation degree of the applicant. These were those graduated with high honors, honors and satisfactory degrees. The base category included those with only a passing grade. The next dummy variable titled as missing indicated those students who are either senior high school students or those who did not reply. The next category indicates the “number of times” the applicant is taking the examination. “Attending University” is a dummy variable, which indicates whether the applicant is already a student in a tertiary education program. “University Graduate” is a dummy variable indicating if the applicant has already graduated from a university. “Internet Access” is a dummy variable indicating if the applicant has access to internet either at home, at school, at the private tutoring center or at the internet café. Population is the population of the location where the applicant spent most of his/her high school years. Finally, “Private tutoring” is a dummy variable indicating whether the applicant ever received private tutoring in Mathematics, Turkish, Sciences or Social Sciences during his/her last year in high school.
5. Estimation Results
5.1. Estimates for Receiving Private Tutoring
The first part of the Table 7 gives the coefficients and the associated marginal effects for the probit estimation of receiving private tutoring. The dependent variable takes the value of one if the applicant received private tutoring during his/her last year in high school and zero otherwise. Receiving private tutoring could be in any one of the fields such as mathematics, sciences, social sciences, Turkish and foreign languages. The amount of the private tutoring received could be less than 100 hours, 100-200 hours or more than 200 hours. The probit estimation considers the effects of various factors on the probability of receiving
private tutoring. We now examine these factors in turn. First of all, we note that females are statistically significantly less likely to attend private tutoring than males. One year increase in the education of the mother and the father both significantly increase the probability of an applicant receiving private tutoring by about 2 and 1.5 percent respectively. Mother being wage earner increases the probability of receiving private tutoring while mother being self-employed reduces it compared to a non-working mother. Mother being employer is not statistically significant. Father being wage earner, employer or self-employed all significantly increase the probability of receiving private tutoring compared to a non-working father. Household monthly income increases the probability of receiving private tutoring. One percent increase in income increases the probability of receiving private tutoring by about six percent. Graduating from high school with high honors, honors or satisfactory degrees increase the probability of receiving private tutoring by about 26, 17 and 9 percents respectively as compared to just passing. This confirms the conjecture that students with higher motivation are more likely to receive private tutoring. The higher the number of times the applicant is taking the examination; the less likely he/she is to receive private tutoring. Those applicants who are already enrolled in a university program are more likely to take private tutoring than those who are not associated with a university program. Being graduate of a university does not significantly affect the probability of receiving private tutoring. If the applicant has an internet access, this increases the probability of receiving private tutoring. One percent increase in the population increases the probability of receiving private tutoring by about 2 percent.
5.2. Estimates for Getting Placed in a University Program
The second part of the Table 7 shows the coefficients and the associated marginal effects for the probit estimation of getting placed in a university program. The dependent
variable takes the value of one if the applicant is placed at a university program and zero otherwise. Getting placed at a university program can be at any one of the fields and two or four year programs but does not include those who are placed at the Open University programs(distance education programs). As explained in Section 2 on the university entrance examination system in Turkey, getting placed in a university program depends not only on the scores in various tests but also on an elaborate system of weighting which includes high school graduation degree. The probit estimation considers the effects of various factors on the probability of getting placed at a university program.
The parents’ years of schooling significantly increase the probability of getting placed in a university program. One year increase in each of mother’s and father’s years of schooling increases the probability of getting placed by about 0.5 and 0.2 percents respectively. We note that the effect of mother’s education is higher than the effect of the father’s education. Various categories of mother’s employment status were not statistically significant except mother being self-employed which reduced the probability of getting placed in a university program. Similarly various categories of father’s employment statuses were mostly statistically insignificant. Household monthly income was statistically significant and one percent increase in the household monthly income increased the probability of getting placed in a university program by about one percent. Graduating from high school with high honors, honors or satisfactory degrees increase the probability of getting placed in a university program by about 14, 11 and 4 percents respectively as compared to just passing. The number of times the university examination is being taken increases the chances of getting placed in a program. Those applicants who are already enrolled or graduated from a university have lower probabilities of getting placed in a university program again. Internet access and the population of the location where the applicant spent most of his/her high school years both increase the probability of getting placed in a program. Finally attending private tutoring has a
statistically significant influence on the probability of getting placed in a university program. Receiving private tutoring increases the probability of getting placed in a university program by about 9 percent. These results indicate that graduating from high school with high honors or honors contribute most to the probability of getting placed at a university program. The next factor, which contributes most, is receiving private tutoring.
5.3. Estimates for Test Scores
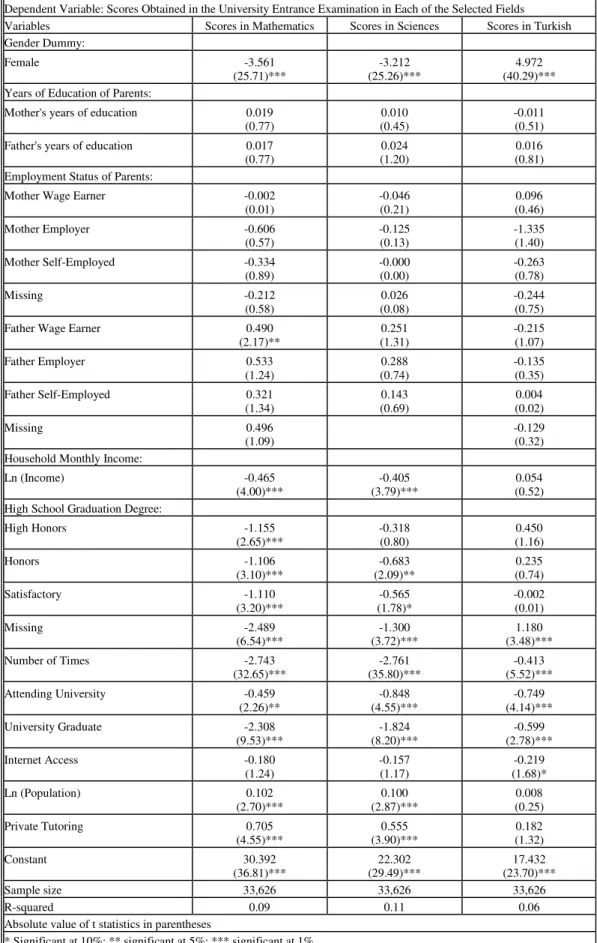
Tables 8, 9 and 10 show the OLS estimation results of the scores in various tests, for the applicants with Science background, Turkish-Mathematics background and Social Sciences background respectively. First in Table 8 (students with Sciences background) we observe that females obtain statistically significantly lower scores in Mathematics and Sciences but significantly higher scores in Turkish as compared to males. Next, we observe that level of education of the parents and the various employment statuses of the parents (the base category is non-working parents) do not have any statistically significant influence on the test scores. One unexpected result is related to the effect of household income. It appears that higher levels of household income are associated with lower scores in the Mathematics and Sciences tests. Scores in Turkish test are not statistically significantly related to the household income. The effects of the various high school graduation degrees (the base category is those with passing grades) are statistically significant in the Mathematics and Sciences but not in the Turkish score. The signs are unexpectedly negative in the Mathematics and Sciences scores. The number of times the applicant is taking the examination is significantly negatively related to all of the Mathematics, Sciences and Turkish scores. Those applicants who are already attending a university program or graduated from a university perform significantly worse in all of the tests compared to the applicants who are not attending or a graduate of a university. Internet access does not statistically significantly
influence the examination scores in Mathematics, Sciences and Turkish. Ln (population) is natural logarithm of the population of the location where the applicant has spent most of his/her high school years. The coefficient estimates on this variable are all positive but statistically significant only for the Mathematics and Sciences scores but not for the Turkish scores. The dummy variable that indicates whether the applicant has had any private tutoring during his/her last year in high school is statistically significant and contributes positively to the Mathematics and Sciences scores but it is not statistically significant for the Turkish scores.
Table 9 shows the regression results of the scores in various tests of those students with Turkish-Mathematics background. The salient feature of the results in this table is as follows. Female applicants have statistically significantly lower scores in Mathematics and Social Sciences but statistically significantly higher scores in Turkish as compared to the male applicants. Mother’s years of education and father’s years of education are both statistically significant and positively contribute to the scores in all of the tests. The results for the employment statuses of the parents are mixed with regards to their sign and significance. The effects of household monthly income are statistically significant and negative in all tests. Applicants who graduated with high honors, honors or satisfactory grades have statistically significantly higher scores than those who only had a passing grade in all of the tests. Applicants who are taking the examination more than once are able to significantly increase their scores in all of the tests. Applicants who are already attending a university program or graduate of a university have significantly lower scores in all of the tests than those applicants who are not attending or graduate of a university. Internet access is statistically significant and increases the scores in all tests. As the population of the location where the applicant spent most of his/her high school years increases, the scores increase in all of the tests. Finally
receiving private tutoring during the last year in high school is highly statistically significant and increases the scores in all tests.
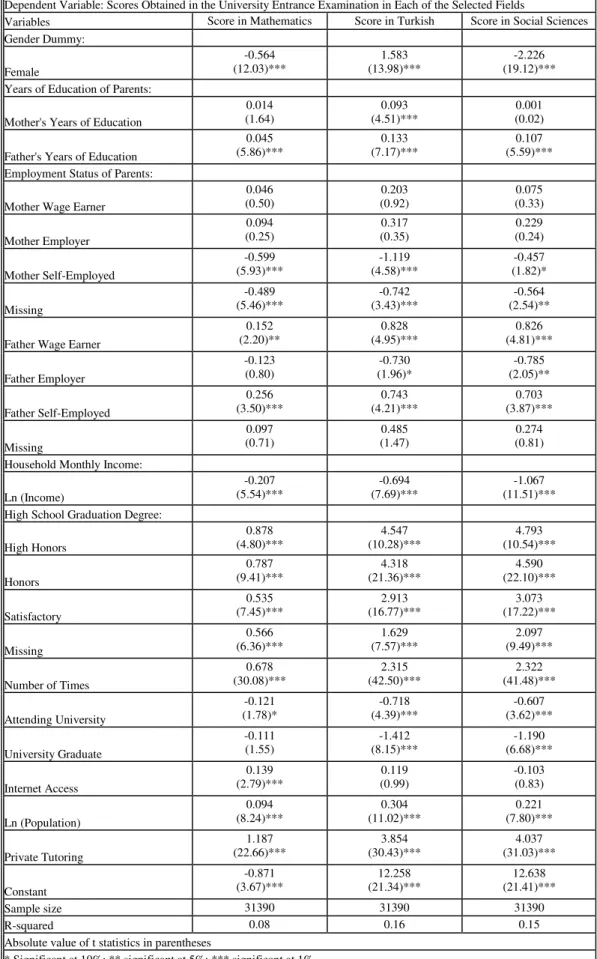
Table 10 gives the OLS estimation results of the scores in various tests of the students with Social-Sciences background. Again we observe that females have statistically significantly lower scores in Mathematics and Social Sciences but higher scores in Turkish than males. Mother’s years of education is statistically significant and positive only for the scores in Turkish but not for Mathematics and Social Sciences. Father’s years of education is statistically significant in all cases and contribute positively to the test scores. Mother’s employment status coefficients are mostly insignificant except for the mother self-employed category. Applicants whose mothers are self-employed have significantly lower scores in all tests than those whose mothers are non-working. Father being wage earner and self-employed significantly increase the test scores while father being employer lowers the test scores as compared to father non-working. The effects of monthly income are statistically significant and negative in all cases. Applicants who graduated with high honors, honors or satisfactory grades have significantly higher scores than those who had only a passing grade in all tests. The number of times the examination is taken significantly increases all of the test scores. Those applicants who are attending a university program or graduated from a university have significantly lower scores in all tests than those who are not associated with or graduated from a university. Internet access increases the scores in mathematics but not in other tests. As the population of the location where the applicant spent most of his/her high school years increases, all test scores increase. Finally, receiving private tutoring during the last year in high school is highly significant and increases the scores in all tests.
In this section we found that father’s educational level affect the test scores of the students with Social Sciences background and Turkish-Mathematics background positively and significantly. Tansel(2002) found that parental education levels are an important factor
determining primary and secondary school attainment in Turkey. The effect of family background on the college entry of the Blacks in the US is examined by Kane (1994) who found that parental family background is the most significant factor in this regard. Importance of family background in college entry is also documented by Fuller, Manski, and Wise (1982), Cameron and Heckman (1998, 2001) and Black and Sufi (2002). Black and Sufi find important differences in the college entry behavior between blacks and whites across the socio-economic spectrum.
In this section we found a consistently negative and significant impact of family income on the university entrance examination scores. Psacharopoulos and Tassoulas (2002) also find negative effect of per capita income on the university entrance examination. They explained this by the possibility that children from low-income families may be more motivated to succeed. Black and Sufi (2002:10) also find that family income has a negative impact on college enrollment. They explain this as follows. High-income, less-educated parents and low-income, well-educated parents both may suggest to their children that there is no need for education.
6. Conclusions
Highly competitive university entrance examination presents a significant turning point in the lives of the young people in Turkey. Receiving private tutoring in order to prepare for this examination is a widespread practice. Private tutoring is a large industry. In this study, we examine the factors that influence an applicant receiving private tutoring and the impact of private tutoring on whether or not the applicant is placed in a university program. We further investigate the impact of private tutoring on the applicants’ various test scores in the university entrance examination. We use the results of the 2002 survey of the applicants to the university entrance examination.
The findings in this study indicate that parental education levels and household income significantly increase the probability of an applicant receiving private tutoring. This is analogous to the results found in Tansel(2002) where parental education levels and household income are found as the most important factors determining school attendence in Turkey. Graduating from high school with high achievements increases the probability of receiving private tutoring confirming the conjecture that those students with higher motivation are more likely to attend private tutoring. This result is also found by Kim and Lee (2001) with the Korean data. Female applicants are found to be less likely to attend private tutoring than males. This is contrary to the result found in Korea by Kim and Lee. The probability of attending private tutoring increases significantly with the population of the location where the applicant spent most of his/her high school years.
When probability of getting placed in a university program is examined, attending private tutoring is found to contribute second most after high school graduation degree with high honors and honors. Finally, effect of private tutoring is examined on test scores in Mathematics, Sciences, Turkish and Social Sciences for students with backgrounds in Sciences, Turkish-Mathematics and Social Sciences. In all cases, receiving private tutoring during the last year in high school increased the test scores significantly except in the Turkish test for the students with Sciences background. Further, results indicate that females attained statistically significantly lower scores in Mathematics, Sciences and Social Sciences tests but higher scores in the Turkish tests. Years of education of the parents were statistically significant in most samples and increased the test scores. Household income was unexpectedly negative as it was found in other studies. Applicants who graduated with high honors, honors and satisfactory grades had significantly higher scores in most tests.
Overall findings indicate that attending private tutoring significantly increases the test scores in the university entrance examination and the probability of getting placed in a tertiary education program.
References:
Black, E.S. and A., Sufi (2002). Who Goes to College? Differential Enrollment by Race and Family Background. National Bureau of Economic Research Working Paper: 9310. Cambridge, MA.
Bray. M. and P. Kwok (2003). “Demand for Private Supplementary Tutoring: Conceptual Considerations and Socio-Economic Patterns in Hong Kong.” Economics of Education Review 22: 611-620.
Cameron, S. V. and J. J. Heckman (2001). “The Dynamics of Educational Attainment for Black, Hispanic and White Males.” Journal of Political Economy. 109(3): 455-499. Cameron, S. V. and J. J. Heckman (1998). “A Life Cycle Schooling and Dynamic Selection
Bias: Models and Evidence for Five Cohorts of American Males.” Journal of Political Economy. 106(2): 262-333.
Fuller, W.C., C.F. Manski and D.A. Wise (1982). “New Evidence on the Economic
Determinants of Post Secondary Schooling Choices.” Journal of Human Resources. 17(4): 477-498.
Kane, T.J. (1994). “College Entry by Blacks since 1970: The Role of College Costs, Family Background and the Returns to Education.” Journal of Political Economy. 102(5): 878-911.
Kim. S. and Ju-Ho Lee. (2001). “Demand for Education and Developmental State: Private Tutoring in South Korea.” Social Science Research Network Electronic Paper Collection: http//papers.ssrn.com/paper.taf?abstract_id=268284, January 15, 2004. Kostakis, A. (1987). “Differences Among School Outputs and Educational Production
Psacharopoulos, G. And S. Tassoulas (2002). “Achievement at the Higher Education Entry Examinations in Greece: A Procrustean Approach”. Hellenic Parliament, Athens, Greece.
Papas, G. and G. Psacharopoulos (1987) “The Transition from School to the University under Restricted Entry: A Greek Tracer Study.” Higher Education. 16(4): 481-501.
Papas, G. and G. Psacharopoulos (1993). “Student Selection for Higher Education: The Relationship between Internal and External Marks.” Studies in Educational Evaluation. 19(4): 397-402.
Stevenson, D.L. and D.P. Baker (1992). “Shadow Education and Allocation in Formal
Schooling: Transition to University in Japan.” American Journal of Sociology. 97 (6): 1639-57.
Tansel, A. (1994) “Wage Employment, Earnings and Returns to Schooling for Men and Women in Turkey”. Economics of Education Review 13(4): 305-320.
Tansel, A. (2001) “Self-Employment, Wage Employment and Returns to Schooling by Gender in Turkey”. In Labor and Human Capital in the Middle East: Studies of Markets and household Behavior: 337-367. Ed. By Djavad Salehi-Isfahani, Ithaca Press, Reading, UK.
Tansel, A. (2002) “Determinants of Schooling Attainment for Boys and Girls in Turkey: Individual, Household and Community Factors”. Economics of Education Review, 21: 455-470.
Tansel, A. (2005) “Public-Private employment Choice, Wage Differentials and Gender in Turkey”. Economic Development and Cultural Change, 53(1): 453-477.
Tansel, A. and F. Bircan (2005). “Demand for Education in Turkey: A Tobit Analysis of Private tutoring Expenditures”. Economics of Education Review, forthcoming.
ABLE 1: THE PERCENTAGES OF STUDENTS WHO RECEIVE PRIVATE TUTORING BY THE EDUCATION LEVEL OF PARENTS
According to Mother’s Education According to Father’s Education Education Level Observations Number of No Private Tutoring
%
Private Tutoring
%
Number of
Observations No Private Tutoring % Private Tutoring % Illiterate 23,018 73.96 26.04 4,161 77.89 22.11 Literate 11,358 66.77 33.23 6,317 74.54 25.46 Primary School 51,308 57.88 42.12 44,883 64.78 35.22 Middle School 7,776 45.55 54.45 14,811 58.30 41.70 High School 12,949 30.31 69.69 21,652 45.94 54.06 Two Year Tertiary 2,905 22.72 77.28 50,98 36.39 63.61 University 3,748 16.73 83.27 12,323 26.30 73.70 Masters 104 16.35 83.65 479 20,04 79.96 Doctorate 77 7.79 92.21 310 16.13 83.87 Missing 6,757 54.45 45.55 9,966 59.29 40.71 Total in Numbers 120,000 120,000
Notes: The distribution is according to mother’s education and sums to 100 percent each row. Similarly for the father’s education.
TABLE2: THE PERCENTAGES OF STUDENTS WHO RECEIVE PRIVATE TUTORING BY THE EMPLOYMENT STATUS OF PARENTS
According to Mother’s Employment Status According to Father’s Employment Status Employment
Status Observations Number of No Private Tutoring %
Private Tutoring
%
Number of
Observations No Private Tutoring % Private Tutoring % Employer 517 37.14 62.86 4,325 36.46 63.54 Wage Earner 13,667 33.71 66.29 61,481 51.46 48.54 Self-employed 5,447 62.24 37.76 32,891 58.36 41.64 Nonworking 92,232 57.60 42.40 16,264 68.23 31.77 Missing 8,137 66.93 33.07 5,039 64.54 35.46 Total in Numbers 120,000 120,000
Notes: The distribution is according to mother’s employment status and sums to 100 percent each row. Similarly for the father’s employment status
TABLE 3: THE PERCENTAGES OF STUDENTS WHO RECEIVE PRIVATE TUTORING BY THE INCOME LEVELS OF THE HOUSEHOLDS
Income Level
Number of
Observations No Private Tutoring % Private Tutoring % Less than 250 Million Turkish Liras 46,533 68.54 31.46 250-500 Million Turkish Liras 47,314 53.10 46.90 500-750 Million Turkish Liras 14,333 38.37 61.63 750 Million-1 Billion Turkish Liras 5,671 30.56 69.44 1-1.5 Billion Turkish Liras 2,175 28.46 71.54 1.5-2 Billion Turkish Liras 967 28.65 71.35 More than 2 Billion Turkish Liras 1,114 24.33 75.67
Missing 1,893 70.95 29.05
Total in Numbers 120,000
Notes each row sums to 100 percent
TABLE 4: THE PERCENTAGE OF STUDENTS WHO RECEIVE PRIVATE TUTORING BY HIGH SCHOOL GRADUATION DEGREES
High School Graduation
Degree Observations Number of No Private Tutoring % Private Tutoring % High Honors 4,018 39.35 60.65 Honors 22,722 53.78 46.22 Satisfactory 38,880 62.97 37.03 Passing 9,270 70.01 29.99 Missing 45,110 48.74 51.26 Total in numbers 120,000
TABLE 5: THE REASONS OF THE STUDENTS FOR RECEIVING PRIVATE TUTORING DURING HIGH SCHOOL YEARS
Reasons Number of
Observations Grade 9 % Grade 10 % Grade 11 % To Prepare for the University
Entrance Examination 77,272 3.32 14.09 46.98 To Raise the Grades in school 18,938 5.33 8.53 1.93 To Get Promoted to the Next Grade 4,148 1.81 1.05 0.60 Missing 259,642 89.54 76.33 50.49 Total in Numbers 360,000
Notes: Each row sums to 100 percent
TABLE 6: THE PERCENTAGE OF STUDENTS WHO RECEIVE PRIVATE TUTORING BY WHETHER OR NOT PLACED AT A UNIVERSITY PROGRAM
Number of Observations No Private Tutoring
% Private Tutoring % Not Placed at a Program 88336 59.49 40.51 Placed at a Program 31664 44.48 55.12 Total in Numbers 120,000
TABLE 7: MAXIMUM LIKELIHOOD PROBIT ESTIMATES OF RECEIVING PRIVATE TUTORING AND GETTING PLACED AT A UNIVERSITY PROGRAM, TURKEY, 2002
Variables Dependent Variable: Received Private
Tutoring Dependent Variable: Placed in a Program Gender Dummy: Coefficients Marginal Effects Coefficients Marginal Effects
Female -0.054
(6.27)*** (6.27)*** -0.022 -0.004 (0.41) -0.001 (0.41) Years of Education of Parents:
Mother's Years of Education 0.051
(32.76)*** (32.76)*** 0.020 (10.48)*** 0.017 (10.48)*** 0.005 Father's Years of Education 0.038
(27.13)*** (27.13)*** 0.015 (5.02)*** 0.007 (5.02)*** 0.002 Employment Status of Parents:
Mother Wage Earner 0.058
(3.70)*** (3.70)*** 0.023 (0.08) 0.001 (0.08) 0.000 Mother Employer -0.058
(0.85) -0.023 (0.85) (0.74) 0.048 (0.74) 0.016 Mother Self Employed -0.060
(2.79)*** (2.79)*** -0.024 (2.98)*** -0.067 (2.98)*** -0.022
Missing -0.183
(9.62)*** (9.62)*** -0.072 (6.30)*** -0.129 (6.30)*** -0.040 Father Wage Earner 0.062
(4.46)*** (4.46)*** 0.025 (3.66)*** -0.052 (3.66)*** -0.017 Father Employer 0.194 (7.15)*** (7.15)*** 0.077 -0.018 (0.68) -0.006 (0.68) Father Self-Employed 0.119 (8.12)*** (8.12)*** 0.048 (1.80)* -0.027 (1.80)* -0.009 Missing 0.019 (0.68) (0.68) 0.007 (0.13) 0.004 (0.13) 0.001 Household Monthly Income:
Ln (Income) 0.159
(22.34)*** (22.34)*** 0.063 (4.05)*** 0.030 (4.05)*** 0.010 High School Graduation Degree:
High Honors 0.684 (24.02)*** (24.02)*** 0.260 (14.13)*** 0.393 (14.13)*** 0.141 Honors 0.433 (23.20)*** (23.20)*** 0.171 (16.23)*** 0.307 (16.23)*** 0.106 Satisfactory 0.213 (12.19)*** (12.19)*** 0.085 (6.40)*** 0.114 (6.40)*** 0.038 Missing 0.424 (21.55)*** (21.55)*** 0.168 (2.31)** -0.047 (2.31)** -0.015 Number of Times -0.073 (14.65)*** (14.65)*** -0.029 (17.31)*** 0.087 (17.31)*** 0.029 Attending University 0.195 (15.05)*** (15.05)*** 0.078 (28.10)*** -0.393 (28.10)*** -0.116 University Graduate -0.024 (1.64) -0.010 (1.64) (10.72)*** -0.162 (10.72)*** -0.051 Internet Access 0.274 (30.18)*** (30.18)*** 0.109 (7.70)*** 0.073 (7.70)*** 0.024 Ln (Population) 0.039 (17.40)*** (17.40)*** 0.016 (14.69)*** 0.035 (14.69)*** 0.011 Private Tutoring 0.288 (30.13)*** (30.13)*** 0.094 Constant -2.370 (49.19)*** (34.15)*** -1.698 Sample size 97,208 97,208 97,208 97,208
Absolute value of z statistics in parentheses
TABLE 8: OLS ESTIMATION RESULTS FOR THE STUDENTS WITH BACKGROUND IN SCIENCES
Dependent Variable: Scores Obtained in the University Entrance Examination in Each of the Selected Fields Variables Scores in Mathematics Scores in Sciences Scores in Turkish Gender Dummy:
Female -3.561
(25.71)*** (25.26)*** -3.212 (40.29)*** 4.972 Years of Education of Parents:
Mother's years of education 0.019
(0.77) (0.45) 0.010 -0.011 (0.51) Father's years of education 0.017
(0.77) (1.20) 0.024 (0.81) 0.016 Employment Status of Parents:
Mother Wage Earner -0.002
(0.01) -0.046 (0.21) (0.46) 0.096 Mother Employer -0.606 (0.57) -0.125 (0.13) -1.335 (1.40) Mother Self-Employed -0.334 (0.89) -0.000 (0.00) -0.263 (0.78) Missing -0.212 (0.58) (0.08) 0.026 -0.244 (0.75) Father Wage Earner 0.490
(2.17)** (1.31) 0.251 -0.215 (1.07) Father Employer 0.533 (1.24) (0.74) 0.288 -0.135 (0.35) Father Self-Employed 0.321 (1.34) (0.69) 0.143 (0.02) 0.004 Missing 0.496 (1.09) -0.129 (0.32)
Household Monthly Income:
Ln (Income) -0.465
(4.00)*** (3.79)*** -0.405 (0.52) 0.054 High School Graduation Degree:
High Honors -1.155 (2.65)*** -0.318 (0.80) (1.16) 0.450 Honors -1.106 (3.10)*** (2.09)** -0.683 (0.74) 0.235 Satisfactory -1.110 (3.20)*** (1.78)* -0.565 -0.002 (0.01) Missing -2.489 (6.54)*** (3.72)*** -1.300 (3.48)*** 1.180 Number of Times -2.743 (32.65)*** (35.80)*** -2.761 (5.52)*** -0.413 Attending University -0.459 (2.26)** (4.55)*** -0.848 (4.14)*** -0.749 University Graduate -2.308 (9.53)*** (8.20)*** -1.824 (2.78)*** -0.599 Internet Access -0.180 (1.24) -0.157 (1.17) (1.68)* -0.219 Ln (Population) 0.102 (2.70)*** (2.87)*** 0.100 (0.25) 0.008 Private Tutoring 0.705 (4.55)*** (3.90)*** 0.555 (1.32) 0.182 Constant 30.392 (36.81)*** (29.49)*** 22.302 (23.70)*** 17.432 Sample size 33,626 33,626 33,626 R-squared 0.09 0.11 0.06
Absolute value of t statistics in parentheses
TABLE 9: OLS ESTIMATION RESULTS FOR THE STUDENTS WITH BACKGROUND IN TURKISH- MATHEMATICS, TURKEY, 2002
Dependent Variable: Scores Obtained in the University Entrance Examination in Each of the Selected Fields
Variables Scores in Mathematics Scores in Turkish Scores in Social Sciences Gender Dummy:
Female (18.75)*** -1.972 (19.72)*** 2.045 (6.14)*** -0.679 Years of Education of Parents:
Mother's Years of Education (9.82)*** 0.184 (10.11)*** 0.186 (4.83)*** 0.095 Father' s Years of Education (8.15)*** 0.138 (8.98)*** 0.150 (7.26)*** 0.129 Employment Status of Parents:
Mother Wage Earner (1.42) 0.258 (0.05) 0.009 (2.11)** 0.404 Mother Employer (0.90) 0.659 -0.395 (0.55) -0.121 (0.16) Mother Self-Employed (2.58)*** -0.687 (2.65)*** -0.694 -0.326 (1.17) Missing (7.50)*** -1.691 (5.66)*** -1.259 (4.47)*** -1.059 Father Wage Earner -0.209 (1.20) (1.56) 0.266 (0.22) 0.040 Father Employer (2.86)*** -0.875 (3.67)*** -1.106 (5.11)*** -1.643 Father Self-Employed -0.281 (1.55) -0.147 (0.82) (2.15)** -0.410 Missing -0.004 (0.01) -0.342 (1.02) -0.479 (1.33) Household Monthly Income:
Ln (Income) (2.32)** -0.200 (3.48)*** -0.297 (5.21)*** -0.474 High School Graduation Degree:
High Honors (20.82)*** 8.043 (15.74)*** 5.998 (15.21)*** 6.177 Honors (20.51)*** 5.007 (19.75)*** 4.753 (19.46)*** 4.994 Satisfactory (10.56)*** 2.426 (11.77)*** 2.664 (11.25)*** 2.716 Missing (10.03)*** 2.524 (8.26)*** 2.051 (8.70)*** 2.303 Number of Times (11.59)*** 0.841 (12.78)*** 0.915 (10.78)*** 0.822 Attending University (16.33)*** -2.800 (19.08)*** -3.226 (17.75)*** -3.199 University Graduate (5.72)*** -1.121 (10.73)*** -2.072 (10.33)*** -2.126 Internet Access (4.60)*** 0.517 (5.14)*** 0.570 (3.78)*** 0.447 Ln (Population) (9.82)*** 0.270 (9.08)*** 0.246 (5.76)*** 0.166 Private Tutoring (47.47)*** 5.176 (46.40)*** 4.989 (43.24)*** 4.956 Constant -0.008 (0.01) (26.26)*** 15.234 (19.77)*** 12.225 Sample size 32192 32192 32192 R-squared 0.15 0.16 0.11
Absolute value of t statistics in parentheses
TABLE 10: OLS ESTIMATION RESULTS FOR THE STUDENTS WITH BACKGROUND IN SOCIAL SCIENCES, TURKEY, 2002
Dependent Variable: Scores Obtained in the University Entrance Examination in Each of the Selected Fields
Variables Score in Mathematics Score in Turkish Score in Social Sciences Gender Dummy:
Female
-0.564
(12.03)*** (13.98)*** 1.583 (19.12)*** -2.226 Years of Education of Parents:
Mother's Years of Education
0.014
(1.64) (4.51)*** 0.093 (0.02) 0.001 Father's Years of Education
0.045
(5.86)*** (7.17)*** 0.133 (5.59)*** 0.107 Employment Status of Parents:
Mother Wage Earner
0.046 (0.50) (0.92) 0.203 (0.33) 0.075 Mother Employer 0.094 (0.25) (0.35) 0.317 (0.24) 0.229 Mother Self-Employed -0.599 (5.93)*** (4.58)*** -1.119 (1.82)* -0.457 Missing -0.489 (5.46)*** (3.43)*** -0.742 (2.54)** -0.564 Father Wage Earner
0.152 (2.20)** (4.95)*** 0.828 (4.81)*** 0.826 Father Employer -0.123 (0.80) (1.96)* -0.730 (2.05)** -0.785 Father Self-Employed 0.256 (3.50)*** (4.21)*** 0.743 (3.87)*** 0.703 Missing 0.097 (0.71) (1.47) 0.485 (0.81) 0.274 Household Monthly Income:
Ln (Income)
-0.207
(5.54)*** (7.69)*** -0.694 (11.51)*** -1.067 High School Graduation Degree:
High Honors 0.878 (4.80)*** (10.28)*** 4.547 (10.54)*** 4.793 Honors 0.787 (9.41)*** (21.36)*** 4.318 (22.10)*** 4.590 Satisfactory 0.535 (7.45)*** (16.77)*** 2.913 (17.22)*** 3.073 Missing 0.566 (6.36)*** (7.57)*** 1.629 (9.49)*** 2.097 Number of Times 0.678 (30.08)*** (42.50)*** 2.315 (41.48)*** 2.322 Attending University -0.121 (1.78)* (4.39)*** -0.718 (3.62)*** -0.607 University Graduate -0.111 (1.55) (8.15)*** -1.412 (6.68)*** -1.190 Internet Access 0.139 (2.79)*** (0.99) 0.119 -0.103 (0.83) Ln (Population) 0.094 (8.24)*** (11.02)*** 0.304 (7.80)*** 0.221 Private Tutoring 1.187 (22.66)*** (30.43)*** 3.854 (31.03)*** 4.037 Constant -0.871 (3.67)*** (21.34)*** 12.258 (21.41)*** 12.638 Sample size 31390 31390 31390 R-squared 0.08 0.16 0.15
Absolute value of t statistics in parentheses