2500
1 Dipartimento di Scienze della Terra, Università di Trieste, Trieste, Italy 2 Dipartimento di Scienze della Terra, Università di Trieste, Trieste, Italy 3 Dipartimento di Scienze della Terra, Università di Trieste, Trieste, Italy 4
Dipartimento di Geofisica e Vulcanologia, Università Federico II, Naples, Italy 5
Abdus Salam International Centre for Theoretical Physics, SAND Group, Trieste, Italy
MODELLING OF THE SEISMIC GROUND MOTION FOR THE
UMBRIA-MARCHE EARTHQUAKE SEQUENCE (SEPTEMBER 1997)
Abdelkrim AOUDIA1, Giordano CHIMERA2, Giovanni COSTA3, Concettina NUNZIATA4, Giuliano F PANZA5, Fabio ROMANELLI6 , Franco VACCARI6, Angela SARAÒ7 And Peter SUHADOLC8
SUMMARY
A first-order deterministic seismic zoning of Italy, based on the computation of synthetic seismograms [10, 27, 28] lead to theoretical peak values estimates for the Umbria-Marche region that are well in agreement with the peak values observed during the sequence started on September 26, 1997.
Regional and local Earth models are obtained by analysing records of the main shock and aftershocks and of controlled source experiments. The dispersion of fundamental mode is studied by Frequency Time Analysis [20] and the Earth parameters are determined by non-linear inversion.
Three strong events in the sequence have been studied to determine the source parameters by moment tensor inversion [34] using only two three-component broad-band stations.
The information about sources and structural models retrieved from the inversions is used in the realistic modelling of ground motion in selected sites using scaled and extended sources. We generate displacement and velocity wave-fields that correlate reasonably well with the damage.
INTRODUCTION
Predicting the intensity of shaking due to an earthquake before it occurs can prevent damage. Doing this rapidly after an earthquake can be useful for emergency service workers. These objectives all feed into the overall objective of understanding and predicting the ground motion, therefore reducing the seismic risk.
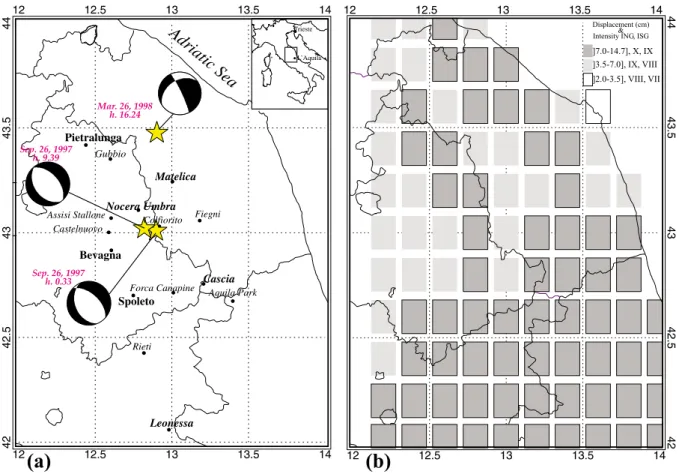
The Umbria-Marche earthquake sequence started in September 26, 1997 and took place in a complex deforming zone, along a normal fault system in the central Apennines (Figure 1a). The crustal events generated extensive ground motion and caused great damage in urban areas. The extent of macroseismic data and the abundance of recorded ground motions permits a good knowledge of the source and structural parameters to better understand the nature of the ground shaking and the resulting damage patterns.
This paper builds upon the realistic modelling of strong motion for pre-disaster orientation in earthquake prone-areas [27, 29] continues the investigations of source, path, and site effects for postulated sources, and tests the methodology against the Umbria-Marche (central Italy) ground motion data set.
We first present a picture of the hazard estimates in Umbria-Marche that were done before the earthquake sequence took place. We determine the regional and local structural models by analysing VBB and strong-motion registrations and controlled local source experiments. This will provide calibration data for constraining regional and local velocity models and, ultimately, for better understanding the strong motion recordings. Using only two three-component stations we compute the seismic moment tensor for the two September 26th upper crust events (Mw 5.7 at 00:33 and Mw 6.0 at 09:40), and for the mantle event of March 26, 1997 (Mw 5.2). The knowledge of the physical process of the two shallow events is used to model the strong ground motion by computing synthetic seismograms (up to 1 Hz) by the modal summation technique [24, 16]. Detailed description and application of the methodology can be found in Panza, Vaccari, Costa, Suhadolc and Fäh [27]. We generate maps of seismic displacement and velocity fields using scaled point sources and extended sources to yield the most informed estimates of ground motion. The maps are discretized according to the regression intensity-displacement, computed for the Italian territory by Panza, Vaccari and Cazzaro [28]. Since the two earthquakes were close in time and space, we compute the seismic wave-field corresponding to the maximum of both events and investigate how the related pattern compares with the cumulative damage effects as reported in the observed macroseismic data points. To validate our modelling we compare synthetic seismograms with the experimental records and determine ground motion parameters that correlate best with damage.
Figure 1: (a) Epicentral map of the studied main events and stations used in our study: the stations in bold are used for the S-wave velocity inversion, the stations in italic for the strong motion modelling. In the inset the frame indicates the location of the region under study. The stations of l'Aquila and Trieste are
used in the moment tensor inversion. (b) Hazard estimates in Umbria-Marche before the earthquake sequence. The intensity estimates are obtained using the relations by Panza, Vaccari and Cazzaro [28] for
ING [3] and ISG [21] data.
PRE-EARTHQUAKES SEISMIC HAZARD ESTIMATES
A first-order deterministic seismic zoning of Italy, based on the computation of synthetic seismograms [10, 27, 28] lead to theoretical peak values estimates for the Umbria-Marche region that are well in agreement with the peak values observed during the sequence started on September 26, 1997. The synthetic signals are computed for
[27], for instance Eurocode 8 [14], which define the normalized elastic acceleration response spectrum of the ground motion, for 5% critical damping. In general this operation should be made taking into account the soil type. For Italy, the used regional structural models [10] are all of type A, as defined in EC8, therefore we can immediately determine DGA using the EC8 parameters for soil A.
Results are expressed in terms of maximum ground displacement, velocity, and acceleration. Since we compute the complete time series, we are not limited to this choice, and it is possible to consider any parameter of interest in earthquake engineering or engineering seismology. The displacements obtained using the earthquake catalogue NT (version 4.1) prepared by GNDT [4] and the seismogenic zones defined in April 1996 by GNDT [9] are given in Figure 1b.
SHEAR-WAVE VELOCITY INVERSION
One of the most powerful tools for determining the elastic properties of the crust is represented by the measurement of the dispersion of the surface waves. The study of the surface-wave dispersion is used here to determine the regional and local Earth models by analysing very broad-band (VBB) and strong-motion registrations of the Umbria-Marche earthquake sequence and of controlled local source experiments. We apply the Frequency-Time Analysis (FTAN) technique [20] to measure the dispersion properties. We perform a non-linear inversion procedure "hedgehog" [35, 23] on the dispersion data to determine the S-wave velocity profiles versus depth.
The FTAN analysis and the inversion procedure are applied to the signals recorded by the VBB station of Trieste (TRI), in order to retrieve the average regional structural model for the path Trieste-epicenter. The S-wave profiles with depth obtained as solutions of the inversion of the measured dispersion relation for Rayleigh waves are in good agreement with the I-dataset [12].
We analysed the strong-motion signals recorded by the instruments of the ENEL-SSN network in order to retrieve the local structural parameters for 5 source-receiver paths, around the epicentral area. FTAN permits to extract easily the fundamental mode also from strong-motion signals recorded at a relatively small source-receiver distances (between 10 and 50 km). The stations used are: Gubbio, Leonessa, Bevagna, Cascia, Matelica, Nocera and Spoleto (Figure 1 a). The clock of the instruments is not automatically set with radio or GPS reference time and the time error reaches up to 3 s (ENEL personal communication 1999). The period range of the data analysis is between 1 and 5 s, and the group velocities of the fundamental mode vary from about 1.5 to 2.5 km/s. Therefore, the error in the group-velocity measurement can be as high as 0.3 km/s, and this value is the average error used in the inversion. The period range considered provides a reasonable resolution for the first 2 km of the crust. The average resolution-step in velocity is of about 0.2 km/s. The S-wave profiles obtained for the 5 paths, indicate the presence of two areas with different structural characteristics, one on the west and one on the east of the epicentral area, in good agreement with the geological characteristics of the zone and already existing structural models [10].
Shear dynamic parameters are of fundamental interest in earthquake engineering. Most engineering structures are founded on superficial deposits that are far from being rigid bodies. Laboratory measurements cannot be assigned to soil deposits because of the different volumes and frequencies involved. Detailed shear-wave (Vs) velocities can be obtained from down- and cross-hole tests, which are rather expensive. Instead, they can be measured from refraction seismic surveys by studying the dispersion of Rayleigh waves [22]. We obtain detailed seismic wave velocity profiles vs depth by using Rayleigh surface waves recorded in refraction seismic surveys in some selected sites at Nocera Umbra and Fabriano. The source is the vertical impact of a 20 kg weight on the ground, the receivers are 4.5 Hz geophones and the source-receiver distance varies between 6 and 30 m. The periods considered are in the range 0.05 - 0.14 s and the group-velocities of the fundamental mode vary between 0.15 and 0.30 km/s. The data considered in the inversion provides a reasonable resolution for the uppermost 10-13 m. The error in the group-velocity measurements is in the range 0.01-0.08 km/s. In the inversion the Vp/Vs=1.73 ratio has been used in agreement with results obtained by the down-hole measurements. The S-wave profiles with depth obtained by the inversion indicate, both for the area of Nocera Umbra and for the area of Fabriano, an increasing velocity from 0.1 to 0.5 km/s in good agreement with the down-hole measurements. In Figure 2 the comparison between the results obtained by the inversion and by the down-hole measurements for the site “S2” of Nocera Umbra is shown.
Figure 2: Comparison between S-wave models inverted from the group-velocity dispersion curves and the model obtained using the inversion of the arrival time of S-phases in the down-hole analysis.
SOURCE PARAMETERS
We compute the seismic moment tensor by waveform inversion for the two main crustal events of the September sequence and the mantle event that occurred in March 1998. We use only two three-component stations, Trieste and l’Aquila (Figure 1a). The inversions are performed considering structural models retrieved from frequency time analysis as reported in section 3 and the I-data set (EurI-data) [12] for Trieste-epicenter path, while the model for the l’Aquila-epicenter path is taken from literature [10].
The method we apply has been developed by Sileny and Panza [33] and Sileny, Panza and Campus [34]. It has been already applied in volcanic, geothermal and tectonic environments [5, 26, 30, 6, 7, 13, 19, 32]. The inversion does not constrain the solution with a priori assumptions and consists of two main steps. The first one is linear and inverts waveforms using elementary seismograms, computed by modal summation [24, 16] for each moment tensor component, to calculate the six moment rate functions. In the second step, the information on the focal mechanism and the duration of the energy release are extracted from the six components of the moment tensor. The moment rate functions are factored into an average moment tensor and corresponding source time function. The hypocentre is not fixed and can move inside a pre-defined volume while in this study we keep fixed the epicentre and perform several trials using all the epicentral locations available in the literature [2, 8, 15].
In all the inversion trials the focal mechanisms are quite stable while slight variations in the data correlation and in the hypocentral location are observed. The solutions we show (Figure 1a) are obtained using very accurate epicentral locations [8]. The computed source parameters are reported in Table 1.
Table 1: Source parameters
STRONG MOTION MODELLING
computations of the time series. For instrumental earthquakes, macroseismic data points when collocated with experimental strong motion records serve to test the validity of the modelling methodology in use.
Scaled source modelling:
The double-couple point-source is defined by the focal depth and by the three parameters that specify the fault plane solution: strike, dip and rake. We compute complete synthetic seismograms, up to 1 Hz, on a receiver grid for a scaled source according to the spectral scaling law proposed by Gusev [17] as reported in Aki [1]. The structural models used for the calculation of the synthetic seismograms are the regional ones valid for central Italy [10] where the uppermost velocities (2 km) are in good agreement with the inverted group-velocity dispersion curves as reported in section 3. The radial and the transverse components of motion, calculated at the various sites of interest, i.e. the sites where macroseismic observations are available, are vectorially summed and the maximum amplitudes of such quantities are used to represent the spatial distribution of the ground shaking. Using the source parameters reported in Table 1 we generate maps of seismic displacement and velocity fields for the two strongest events of September 26, 1997. The seismic field is discretized according to the regression intensity-displacement and intensity-velocity, computed for the Italian territory by Panza, Vaccari and Cazzaro [28].
Figure 3: Displacement wave-field computed for the Umbria-Marche September main shock. The area is subdivided into three average velocity models [10]. The intensity estimates are obtained using the relations by Panza, Vaccari and Cazzaro [28] for ING [3] and ISG [21] data.
Figure 3 shows the case where an excellent agreement between theoretical and observed data points is achieved (Table 2). In our trials we test different epicentral locations and vary the focal depth from 5 to 10 km by 1 km increment. We also consider the maximum wave-field resulting from both earthquakes, since they were close in time and space. Our results show that the source depth has a strong influence on the pattern of the computed seismic wave-field. The seismic field of the largest event of 9:40, (Mp = 6.1, NEIC) dominates over the one of the 00:33 event (Mp = 5.7, NEIC). The computed values of displacement and velocity mimic reasonably well the
observed intensity data points (Table 2) when using very accurate epicentral locations [8] with a depth of 7 km as retrieved in section 4. The agreement between the pattern and shape of the theoretical field with the observed macroseismic data is achieved better when considering displacement rather than velocity, suggesting that, in this case, relatively long periods effects correlate better with the damage distribution.
Extended source modelling:
Synthetic three-component accelerograms are computed for an extended source [31] using the method of multimodal summation [24, 25]. The source mechanisms are reported in Table 1, and the fault is assumed as rectangular (10/9 km) discretized into square cells. The rupture model is a discrete analog of a Haskell-type model, with rupture propagating at a speed of 70% of the shear wave velocity of the medium. At each cell of the grid we assume a point source which generates a seismogram. The point-source seismograms are then delayed according to the rupture propagation times and properly scaled to take into account the local complexities of the energy release. Finally, at each recording station, the point-source contribution is added to construct the complete synthetic seismogram. In our simulation we assume constant slip on the fault and to avoid sharp slip discontinuities, the slip distribution is tapered by a 2-D cosine function at the edges of the fault.
We compute velocities and displacements up to 1 Hz for some of the stations plotted in Figure 1a. For each station the maximum velocity and displacement value is reported in Table 2. These values agree reasonably well with the scaled point-source estimates in the interval of intensity ranges defined by Panza, Vaccari and Cazzaro [28].
Table 2: Observed intensity vs computed ground motion. Theoretical intensity is obtained from point-source displacement (shaded column) or velocity using the relations by Panza, Vaccari and Cazzaro [28] for ING [3] and ISG [21] data.
CONCLUSIONS
The pre-earthquake hazard picture of the Umbria-Marche (Figure 1b) shows that the strong ground motion recorded during the earthquake sequence was predicted fairly well.
The regional and local velocity models retrieved from the inversion of group-velocity dispersion curves are in agreement with the italian I-data of the Eur-ID [12] and the Umbria-Marche models [10], and the computed synthetic seismograms are comparable with the recorded time-series.
Shear dynamic parameters of the most superficial layers (20 m), of fundamental interest in earthquake engineering, can be measured from refraction seismic surveys by studying the dispersion of Rayleigh waves [22].
Theoretical intensity values obtained from scaled source displacement or velocity strong motion using the relations by Panza, Vaccari and Cazzaro [28] compare very well with the observed macroseismic data points. The agreement between the pattern and shape of the theoretical wave-field with the observed macroseismic data is achieved better when considering displacement rather than velocity, suggesting that, in this case, relatively long periods effects correlate better with the damage distribution.
The scaled source and extended source simulations (up to 1 Hz) predict comparable values of strong motion within the interval of intensity ranges defined by Panza, Vaccari and Cazzaro [28].
Scaled source modelling is sufficient to make a realistic prediction of the ground motion. The maps of seismic wave-field can be generated and posted in minutes after moderate and large events occur. These maps are designed to be useful for Emergency Service Workers, indicating areas likely to have suffered extensive shaking damage.
The methodology used in this study for modelling the ground motion can be immediately used in the design of new seismo-resistant constructions and in the reinforcement of existing buidlings, without having to wait for a strong earthquake to occur.
ACKNOWLEDGEMENTS
This research is a contribution to the UNESCO IGCP 414 Project "Realistic Modelling of Seismic Input for Megacities and Large Urban Areas". We acknowledge support by UNESCO-UVO-ROSTE 875.669.9.
REFERENCES
1. Aki, K. (1987), “Strong motion seismology”, in M.Ö. Erdik and M.N. Toksöz (eds.), Strong Ground
Motion Seismology, NATO ASI Series, Series C: Mathematical and Physical Sciences, D. Reidel
Publishing Company, Dordrecht, vol. 204, pp. 3-39.
2. Amato, A., and 18 others. (1998) “The Umbria-Marche, Central Italy earthquake sequence: a first look to main shocks and aftershocks”, Geophys. Res. Lett., Vol 25, pp. 2861-2864.
3. Boschi, E., Favalli, P., Frugoni, F., Scalera, G. and Smirglio, G. (1995), “Mappa massima intensità macrosismica risentita in Italia”, Istituto Nazionale di Geofisica, Roma.
4. Camassi, R. and Stucchi, M. (1996), “NT4.1: un catalogo parametrico di terremoti di area italiana al di sopra della soglia del danno”. Internet, http://emidius.itim.mi.cnr.it/NT/home.html.
5. Campus, P., Cespuglio, G. and Panza, G.F. (1993), “Full moment tensor retrieval and fluid dynamics in volcanic areas: the case of Plegrean Fields (South Italy)”, Atti dell'Accademia dei Lincei of the
International Conference Large explosive eruptions (The problem of eruptions, forecasting and
warning; limits and possibilities), pp. 81-101.
6. Campus, P., Suhadolc, P., Panza, G.F. and Sileny, J. (1996), “Complete moment tensor retrieval for weak events: application to orogenic and volcanic areas”, Tectonophysics, Vol. 261, pp. 147-163. 7. Campus, P. and Fäh, D. (1997), “Seismic monitoring of explosions: a method to extract information on
the isotropic component of the seismic source”, J. Seism., Vol. 1, pp. 205-218.
8. Cattaneo, M., Augliera, P., De Luca, G., Gorini, A., Govoni, A., Marcucci, S., Michelini, A., Monachesi, G., Spallarossa, D., Trojani, L. and XGUMUS (1999), “The 1997 Umbria-Marche (Italy) earthquake sequence: analysis of the data recorded by the local and temporary networks”, J. Seism., submitted.
9. Corsanego, A., Faccioli, E., Gavarini, C., Scandone, P., Slejko, D. and Stucchi, M. (1997), Gruppo Nazionale per la difesa dai terremoti. L’attività del triennio 1993-1995, CNR, GNDT, Roma, 1997. 10. Costa, G., Panza, G.F., Suhadolc, P. and Vaccari, F. (1993), “Zoning of the Italian territory in terms of
expected peak ground acceleration derived from complete synthetic seismograms”, in: R. Cassinis, K. Helbig and G.F. Panza (eds.), Geophysical Exploration in Areas of Complex Geology, II, J. Appl. Geophys. Vol. 30, pp. 149-160.
11. Decanini, L., Gavarini, C. and Mollaioli, F., 1995, “Proposta di definizione delle relazioni tra intensita' macrosismica e parametri del moto del suolo”, Atti del Convegno L'ingegneria sismica in Italia, 7, Vol.
1, pp. 63-72.
12. Du, Z. J., Michelini, A. and Panza, G. F. (1998), “EurID: a regionalised 3-D seismological model of Europe”, Phys. Earth Planet. Int., Vol 105, pp. 31-62.
13. Dufumier, H., Michelini, A., Du, Z., Bondar, I., Sileny, J., Mao, W., Kravanja, S. and Panza G.F. (1998), “Regional Structure Modelling and Source Inversion for the 1992 Roermond Earthquake”, J.
Seism., Vol. 1, pp. 321-340.
14. EC 8 (1993), “Eurocode 8 structures in seismic regions - design - part 1 general and building”, Doc
TC250/SC8/N57A.
15. Ekström, G., Morelli, A., Boschi, E. and Dziewonski, A., (1998), “Moment Tensor Analysis of the Central Italy Sequence of September-October 1997”, Geophys. Res. Lett., Vol. 25, pp. 1971-1974. 16. Florsch, N., Fäh, D., Suhadolc, P., and Panza, G.F. (1991). “Complete Synthetic Seismograms for
High-Frequency Multimode SH-waves”, Pure and Appl. Geophys., Vol. 136, pp. 529-560.
17. Gusev, A.A. (1983), “Descriptive statistical model of earthquake source radiation and its application to an estimation of short period strong motion”, Geophys. J.R. Astron. Soc. Vol. 74, pp. 787-800.
18. Kanamori, H. (1977), “The energy release in great earthquakes”, J. Geophys. Res. Vol. 82, pp. 2981-2987.
19. Kravanja, S., Batini, F., Fiordelisi, A. and Panza, G.F. (1998) “Full moment tensor retrieval waveform inversion in the Larderello geothermal area”, Pure and Appl. Geophys., submitted.
20. Levshin, A., Ratnikova L. and Berger J. (1992) “Peculiarities of surface wave propagation across Central Eurasia”, Bull. Seism. Soc. Am.,Vol. 82, pp. 2464-2493.
21. Molin, D., Stuchi, M. and Valensise, G. (1996) Massime intensità macrosismiche osservate nei comuni italiani, elaborato per il Dipartimento della Protezione Civile, GNDT, ING, SSN, Roma.
22. Nunziata C., Costa G., Natale M., Vuan A. and Panza G. F. (1999) “Shear-wave velocities and attenuation from Rayleigh waves”, Second International Symposium on Pre-Faillure Deformation
Characteristics of Geomaterials, Torino, Italy, 27-29 September 1999, Submitted.
23. Panza, G.F. (1981), “The resolving power of seismic surface wave with respect to crust and upper mantle structural models” in The solution of the inverse problem in Geophysical Interpretation, R.
Cassinis (ed.): 39-77, Plenum press.
24. Panza, G.F. (1985), “Synthetic seismograms: the Rayleigh waves modal summation”, J. Geophys., Vol.
58, pp. 125-145.
25. Panza, G.F. and P., Suhadolc, (1987), “Complete strong motion synthetics”. In: B. A. Bolt (ed.) Seismic
Strong Motion Synthetics, Computational Techniques, 4, Academic Press, Orlando, pp. 153-204.
26. Panza, G.F., Sileny, J., Campus, P., Nicolich, R. and Ranieri, G. (1993). “Point source moment tensor retrieval in volcanic, geothermal and orogenic areas by complete waveform inversion”, Int. J. Appl.
Geophys., Vol. 30, pp. 98-118.
27. Panza, G.F., Vaccari, F., Costa, G., Suhadolc, P. and Fäh, D. (1996), “Seismic input modelling for zoning and microzoning”, Earthquake Spectra, Vol. 12, pp. 529-566.
28. Panza, G.F., Vaccari F. and Cazzaro, R. (1999a), “Deterministic seismic hazard assessment”. In F. Wenzel et al. (Eds), Vrancea Earthquakes: Tectonics, Hazard and Risk Mitigation, 269-286. Kluwer Academic Publishers, The Netherlands.
29. Panza, G.F., Vaccari, F. and Romanelli, F. (1999b), “The IUGS-UNESCO IGCP Project 414 : Realistic modeling of Seismic Input for Megacities and Large Urban Areas”, Episodes, Vol. 22, pp. 26-32. 30. Radulian, M., Ardeleanu, L., Campus, P., Sileny, J. and Panza, G.F. (1996), “Waveform inversion of
weak Vrancea (Romania) earthquakes”, Studia Geoph. Geod., Vol. 40, pp. 367-380.
31. Saraò, A. Das S. and Suhadolc P. (1998), “Effect of non-uniform station coverage on the inversion for earthquake rupture history for a Haskell-type source model” J. Seism. Vol. 2, pp. 1-25.
32. Saraò, A., Panza, G.F., Privitera, E. and Cocina O. (1999), “Non-double couple mechanisms in the seismicity preceding 1991-1993 Etna volcano eruption”, Geophys. J. Int, submitted.
33. Sileny, J. and Panza, G.F. (1991), “Inversion of seismograms to determine simultaneously the moment tensor components and source time function for a point source buried in a horizontally layered medium”, Studia Geoph. Geod., Vol. 35, pp. 166-183.
34. Sileny, J., Panza, G.F. and Campus, P. (1992), “Waveform inversion for point source moment tensor retrieval with optimization of hypocentral depth and structural model”, Geophys. J. Int., Vol. 108, pp. 259-274.
35. Valyus, V.P., Keilis-Borok V. I. and Levshin A.L. (1968), “Determination of the velocity profile of the upper mantle in Europe”, Nauk SSR, Vol. 185, pp. 564-567.


![Table 2: Observed intensity vs computed ground motion. Theoretical intensity is obtained from point- point-source displacement (shaded column) or velocity using the relations by Panza, Vaccari and Cazzaro [28]](https://thumb-us.123doks.com/thumbv2/123dok_us/10246638.2929589/6.892.115.763.577.839/observed-intensity-computed-theoretical-intensity-obtained-displacement-relations.webp)
