Regression for Chaotic Time-Series Prediction
Harya Widiputra1, Russel Pears1, Nikola Kasabov11
Knowledge Engineering and Discovery Research Institute, Auckland University of Technology, New Zealand
1{harya.widiputra,russel.pears,nikola.kasabov}@aut.ac.nz
Abstract. Time-series prediction has been a very well researched topic in recent studies. Some popular approaches to this problem are the traditional statistical methods e.g. multiple linear regression and moving average, and neural network with the Multi Layer Perceptron which has shown its supremacy in time-series prediction. In this study, we used a different approach based on evolving clustering algorithm with polynomial regressions to find repeating local patterns in a time-series data. To illustrate chaotic time-series data we have taken into account the use of stock price data from Indonesian stock exchange market and currency exchange rate data. In addition, we have also conducted a benchmark test using the Mackey Glass data set. Results showed that the algorithm offers a considerably high accuracy in time-series prediction and could also reveal repeating patterns of movement from the past.
Keywords: evolving clustering algorithm, polynomial regression, chaotic time-series data
1
Introduction
Chaotic time-series prediction has become a very well-liked topic for research and there have been a number of methods from different fields introduced before to solve this problem. Some very popular approaches for time-series prediction come from traditional statistic approaches, i.e. linear regression, multiple linear regressions, and moving average [5]. Other than that, various models and algorithms from the machine learning and data mining fields have also been introduced (e.g. Multi Layer Perceptron, Pattern Recognition, and Support Vector Machine) [4], [8], [9]. All of these approaches have shown their strength in solving the time-series prediction problem by presenting a good-quality of accuracy in predicting future values, however not much new knowledge can be revealed and learned from these models.
A breakthrough was made by [7] with the Dynamic Evolving Neuro-Fuzzy Inference System (DENFIS) in which the algorithm was not only able to give good accuracy in predicting movement of time-series data, but it was also able to extract new knowledge in the form of sets of fuzzy rules which govern the movement of the series. This has stimulated us to make an effort to mine knowledge about the
existence of repeating patterns in a time-series movement, particularly in a chaotic time-series data (e.g. stock prices, exchange rates), and then to use extracted knowledge to predict future movement of the series. We are aiming to represent the rules in the form of repeating polynomial functions, group them based on their likeness, and do prediction for future value by trying to discover similar patterns from the past that can be associated with current condition. In addition, we also expect the algorithm to acquire the ability to evolve when new data sample comes, therefore it would be able to adapt when new problems emerge.
In this study, we used in general two different types of data set as experimental data, which are; (1) the financial data set consists of the Indonesian stock prices data and some currency exchange rates as these data can be considered as a Complex Dynamic System (CDS) [5], and (2) a benchmark data set which in this case is the Mackey Glass data set.
2
Clustering as Local Modeling
One of the challenges in information science is to be able to represent dynamic systems, model them and then to reveal the rules that govern the behavior of the variables over time [3]. An option to build a complete model of a dynamic system is by clustering comparable problem sets from a complete problem space based on certain condition into different groups. A model then can be created for each group (i.e. a local regression), and by combining all models from each cluster it will constitute a complete model which might be able to cover all problems from the complete problem space [1], [2], [6]. Similarity in this case is usually (but not limited to) determined by calculating a Euclidean distance between two data samples [5].
We developed a new algorithm which will extract pattern from a localized data set or a chunk of data (as a sub-space problem from a complete problem space) using a polynomial regression. Extracted patterns (in forms of polynomial functions) then will be grouped based on the likeness of their shape (trend of movement). We believe that repeating patterns of movement exist in a time-series data based on [2], [5], [7], even in a chaotic one, and it can be used to predict future values.
2.1 Similarity and Distance Measurement
Defining similarity between two objects in clustering process is a very important step. Different definition about similarity would give us diverse solutions or various groups of data. In a clustering process, it is common to use the Euclidean distance to measure similarity between objects [5]. This can be done by calculating distance from each attributes that we used to describe the object.
Nonetheless, in our algorithm it will not be suitable to apply the Euclidean distance, as what we would like to group are not objects but sets of polynomial function which represent patterns of movement of a time-series data across time. Therefore, we applied a different method to calculate similarity between two polynomial functions, which is the Angular Separation or Cosine distance (equation
1). By using the Cosine distance, we were able to measure similarity between two polynomial functions based on the shape and direction of the function. As for the attributes that we used to describe a polynomial function, we took into consideration the coefficients of each part of the polynomial function.
(1)
2.2 ECM as Evolving Clustering Algorithm
Evolving Clustering Method (ECM) was introduced by [6]. ECM is a fast, one-pass algorithm for dynamic clustering of an input stream of data. It is a distance-based clustering method where the cluster centres are represented by evolved nodes in an on-line mode. In the clustering process, the data samples come from a data stream and this process starts with an empty set of clusters. As new data samples come, new clusters are created or if the new data sample is similar to those previous ones, it will be added into one of the existing clusters and the cluster centre will be updated.
ECM is used in Dynamic Evolving Neuro-Fuzzy Inference Systems (DENFIS) [7]. In our proposed algorithm, we have also implemented ECM as the core evolving clustering algorithm. Nevertheless, we have also made a fundamental change in the algorithm. ECM uses the Euclidean distance to measure similarity between objects when it creates or updates clusters. In our algorithm, we replaced the Euclidean distance with Cosine distance. The main reason of this modification is explained in sub-chapter 2.1.
2.3 DyCPR as a Novel Evolving Clustering Algorithm for Time-Series
Prediction
We named the proposed algorithm Dynamic Clustering with Polynomial Regression (DyCPR). The main idea behind the algorithm is to extract patterns of movement from a time-series data using a polynomial regression. After the patterns have been extracted, it will be grouped using the modified ECM algorithm. Cluster centres will represent the average movement calculated as a superposition function from all polynomial functions belong to the cluster. These cluster centres will be used as references to predict movement of the series by finding a centre that can be related with current condition. Complete algorithm of DyCPR is described as follow;
Step 0: First step of the algorithm is considered to be a data pre-processing step. In this step the algorithm, we will calculate the difference of values from the time-series data. difft = xt+1-xt, where difft is value difference at time t and X are actual
value at time point t+1 and t respectively. The motive why the algorithm calculates values difference from time-series data is, because it is the movement of values difference that will be predicted instead of the actual value.
Step 1: After values difference has been calculated, the next step of the algorithm is to find the best-fit regression function from a chunk of data, Xi with size n. For
every chunk of data which comes in, the best-fit regression function will be extracted by calculating linear regression and polynomial regression up to certain order (i.e. up to 6th order). PFi = {LRi, PR1i, PR2i, PR3i, PR4i, PR5i, PR6i} best-fit
regression function is defined by calculating bestPF = minMSE(PFi). Besides
calculating the best-fit regression function from the chunk of data with size n, the algorithm will also calculated best-fit regression function for next movement, PFMi using another chunk of data with the size n+1, Yi.
Step 2: For the first chunk of data, found bestPF will become the cluster centre of the first cluster, Ccj = bestPFi and the function to predict next movement of data
samples that belong to that cluster is set to PFMi. The radius of the cluster, Ruj is
set to 0. If there is no more chunks of data comes then the algorithm stops. If there are still more chunks of data then the algorithm returns to Step 1, where the best-fit regression function will be calculated again. After the bestPFi is calculated for Xi,
similarity between bestPFi with the Cc is measured. Similarity is calculated using
Cosine distance by taking coefficients of bestPFi function and Cc function into
account.
Step 3: The forth step of the algorithm is basically the implementation of the ECM algorithm, where the algorithm will calculate distance between bestPFi to all
existing cluster centres, Cc and makes update to cluster centre j, Ccj when it is
found that distance between bestPFi and Ccj is less than 2xDthr. The process of
updating the value of cluster radius, Ruj is the same as it is in ECM. However
DyCPR will update also the best-fit regression function for next movement of cluster j, PFMj by calculating superposition value between existing PFMj and
PFMi when it decides that bestPFibelongs to cluster j. If all chunks of data sample
have been processed than the algorithm stops, else it returns to Step 1.
Step 4: In the prediction step, the algorithm will calculate the best-fit regression function from current chunk of data with size n, Xt = {xt, xt-1, xt-2, …, xt-(n-1)}. Calculated best-fit regression function for time t, bestPFt, then will be compared to
all existing cluster centres, Cc. When closest Ccj is found, then PFMj will be used
as a reference function to calculate next movement of values differences, pxt+1. Predicted actual value then will be calculated as, xt+1 = xt + pxt+1. Learning process then will be continued by taking new data sample as a data sample to update existing clusters and the algorithm returns to Step 1.
One key characteristics of DyCPR (other than its power to evolve by creating and updating clusters when new data sample becomes available) is that the algorithm will do prediction of future values by predicting the polynomial function that will represent movement of the series in the future (this is explained in Step 1 and 3 in the DyCPR algorithm). This is significantly different in comparison to DENFIS where the algorithm does prediction by calculating real predicted values based on extracted fuzzy rules represent by each cluster centres [7].
3
Experiments and Results
In this study, we used data from financial field as experimental data. These data are; (1) data of five stock prices from Indonesian stock market (namely TLKMJK, AALIJK, LMASJK, KLBFJK, and ELTYJK; data are available from: http://finance.yahoo.com/q/cp?s=^JKSE) and (2) currency exchange rates data (i.e. NZD to USD and IDR to USD)1. The five stock prices data represent three different types of movement, which are; chaotic, increasing and decreasing. The stock prices data cover period of January 2005 to January 2009, while the currency exchange rates data expand from January 2006 to January 2009. As for benchmark data, we use the Mackey Glass data set to examine the robustness of the algorithm. Figure 1 illustrates movement of the Indonesian stock price data for ELTYJK data.
Fig. 1. Daily basis data (closing price) of ELTYJK in Indonesian stock exchange market spanning from January 2005 to January 2009.
No normalization process applied to the data before the training process is started. On the other hand, what will be extracted are patterns of movement of difference between values across time instead of movement of the actual values (as it has been explained in Step 1 in DyCPR algorithm).
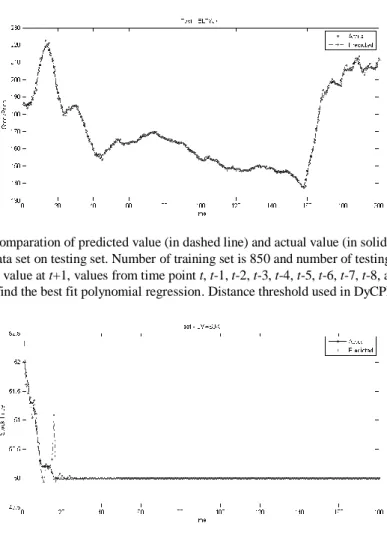
Results showed that the algorithm demonstrated its strength by giving a considerable high accuracy of prediction results (with RMSE of 2.4680 and 0.2449 for ELTYJK data and LMASJK data respectively; please note the RMSE is un-normalized RMSE). This can be seen in figure 2 and 3, where we attached prediction results for two stock prices data with different behavior which are; (1) ELTYJK data with increasing trend and (2) LMASJK data with decreasing trend, here we used 80% of total data set records as training set and 20% as test set. Even more, the algorithm showed its ability to adapt to new problems (unusual pattern of movement) which did not appear during the training step as in the case of LMASJK data for the last view points (i.e. a flat-line pattern).
Fig. 2. Comparation of predicted value (in dashed line) and actual value (in solid line) for ELTYJK data set on testing set. Number of training set is 850 and number of testing set is 200.
To predict value at t+1, values from time point t, t-1, t-2, t-3, t-4, t-5, t-6, t-7, t-8, and t-9 are used to find the best fit polynomial regression. Distance threshold used in DyCPR is 0.3.
Fig. 3. Comparation of predicted value (in dashed line) and actual value (in solid line) for LMASJK data set on testing set. Number of training set is 750 and number of testing set is 180.
To predict value at t+1, values from time point t, t-1, t-2, t-3, t-4, t-5, t-6, t-7, t-8, and t-9 are used to find the best fit polynomial regression. Distance threshold used in DyCPR is 0.3. As it is expected, the algorithm was not only able to provide excellent accuracy in predicting future values, it was also capable to extract new knowledge in the form of repeating polynomial functions which exist in the series over time. This can be seen in the clusters the algorithm created as showed in figure 4 for the ELTYJK data.
From figure 4, we can observe how the polynomial functions are being grouped into different clusters, and how the cluster centres represent the average movement function for each group. This finding justified our assumption that repeating patterns of movement do exist in a time-series data, and that it can be modeled using a polynomial functions. We have also conducted a benchmark test using the Mackey Glass data set as part of our experiment. Complete results of our experiments with the other data sets can be seen in table 1.
Fig. 4. Created clusters during training and testing process when predicting movement of stock price difference for ELTYJK data. Each clusters show comparable patterns of movement based on the likeness of shape and direction of extracted polynomial regression for each chunk of
data. Cluster centres (in wider line) represent movement of all polynomial functions which belong to a cluster, are calculated as superposition functions.
Results from table 1 showed that the algorithm demonstrated its superiority in chaotic time-series prediction. The algorithm is also effective to predict movement of different types of time-series data with different behaviours (e.g. fluctuative, increasing, and decreasing).
Table 1. Results of DyCPR used to predict 8 different types of data set covering stock prices data set, currency exchange rate data set, and the Mackey Glass data set. 80% of data is used as
training set and 20% as testing set for each experiments. Value of distance threshold, Dthr in DyCPR is set to 0.3.
Data Set Category Trend Range of Values RMSE TLKMJK Indonesian Stock Price Increasing 3,853.9-11,933.0 34.0077 AALIJK Indonesian Stock Price Fluctuate 346.0-32,026.0 109.3862 LMASJK Indonesian Stock Price Decreasing 35.0-1,304.8 0.2449 ELTYJK Indonesian Stock Price Fluctuate 331.75-1,508.4 2.4680 KLBFJK Indonesian Stock Price Fluctuate 10.0-680.0 3.1927 NZDUSD Exchange Rate Balanced 1.2235-1.9058 0.0083 IDRUSD Exchange Rate Decreasing 8,684.0-12,209.0 72.6284 Mackey Glass Benchmark Data Fluctuate 0.2192-1.3137 0.0057
4
Conclusion and Future Works
Dynamic Clustering with Polynomial Regression (DyCPR) showed its strength by giving high accuracy in predicting movement of chaotic time-series data. The
robustness of the algorithm has also been tested by conducting experiment using different data sets with different behaviours. Furthermore, proposed algorithm was also able to extract repeating patterns of movement from chaotic time-series data. It has also been verified that by using polynomial regressions to model patterns of movement in a localized sub-space of time-series data, we were able to acquire prediction of next movement with a considerably high accuracy.
As for future works, we would like to extend the algorithm so it can be used to predict movement of not only a single chaotic series data but for multiple time-series data as well. One possibility to achieve this is by implementing a recursive clustering method, where the first clustering process will group data from different series into a number of groups with comparable behaviour, and the second clustering process will be to extract patterns of movement from created clusters in the first step.
References
1. Kasabov, N.: Adaptation and interaction in dynamical systems: Modelling and rule discovery through evolving connectionist systems. Applied Soft Computing 6: 307-322, (2006)
2. Kasabov, N.: Global, local and personalised modelling and pattern discovery in bioinformatics: An integrated approach. Pattern Recognition Letters 28: 673-685, (2007)
3. Kasabov, N.: Evolving Connectionist Systems: The Knowledge Engineering Approach. Springer, (2007)
4. Kim, T., Adali, T.: Approximation by Fully Complex Multilayer Perceptrons. Neural Computation 15: 1641-1666, (2003)
5. Serguieva, A., Kalganova, T., Khan, T.: An intelligent system for risk classification of stock investment projects. Journal of Applied Systems Studies 4 (2): 236-261, (2003)
6. Song, Q., Kasabov, N.: ECM – A Novel On-line Evolving Clustering Method and Its Applications. In: Posner, M.I. (Ed.), Foundations of cognitive science: 631-682, (2001)
7. Song, Q., Kasabov, N.: Dynamic evolving neuro-fuzzy inference system (DENFIS): On-line learning and application for time-series prediction. IEEE Transactions of Fuzzy Systems 10: 144-154, (2002)
8. Yang, H., Chan L., King, I.: Support Vector Machine Regression for Volatile Stock Market Prediction. Lecture Notes in Computer Science 0302: 143-152, (2002)
9. Zanghui, Z., Yau, H., Fu, A.M.N.: A new stock price prediction method based on pattern classification. In: International Joint Conference on Neural Network 1999: 3866-3870, (1999)