Chalmers Publication Library
Copyright Notice
©2012 IEEE. Personal use of this material is permitted. However, permission to
reprint/republish this material for advertising or promotional purposes or for creating new
collective works for resale or redistribution to servers or lists, or to reuse any copyrighted
component of this work in other works must be obtained from the IEEE.
This document was downloaded from Chalmers Publication Library , where it
is available in accordance with the IEEE PSPB Operations Manual, amended 19 Nov. 2010, Sec. 8.1.9
Performance Evaluation of Coordinated Multi-Point
Transmission Schemes with Predicted CSI
Jingya Li1
, Agisilaos Papadogiannis1
, Rikke Apelfröjd2
, Tommy Svensson1
, and Mikael Sternad2
1Department of Signals and Systems, Chalmers University of Technology, Gothenburg, Sweden 2Signals and Systems, Uppsala University, Uppsala, Sweden
{jingya.li, agisilaos.papadogiannis, tommy.svensson}@chalmers.se, {rikke.apelfrojd, Mikael.Sternad}@signal.uu.se
Abstract—Coordinated multi-point (CoMP) transmission is
considered as an efficient technique to improve cell-edge per-formance as well as system spectrum efficiency. In CoMP-enabled systems, a cluster of coordinated base stations (BSs) are typically assumed to be connected to a control unit (CU) via backhaul links, and the provided performance gain relies heavily on the quality of the channel state information (CSI) available at the CU side. In this paper, we consider the downlink of a CoMP cluster and compare three different CoMP transmission schemes: zero-forcing coherent joint transmission, non-coherent joint transmission and coordinated scheduling. Moreover, for each of the analyzed schemes, the performance in terms of average sum rate of the CoMP cluster is studied with predicted CSI, considering the effects of the feedback and backhaul latency, as well as the user mobility. Compared to zero-forcing coherent joint transmission, we show that non-coherent joint transmission and coordinated scheduling are more robust to channel uncertainty. In addition, depending on the latency, user mobility and user locations, different schemes would achieve the highest average sum rate performance. Hence, a system could switch between the transmission schemes to improve the sum rate.
I. INTRODUCTION
Recently, Coordinated multi-point (CoMP) transmission has been considered as a promising technique to mitigate inter-cell interference (ICI) and improve spectrum efficiency in wireless communication systems [1]. CoMP transmission techniques can be divided into two main categories [2]:
• Joint transmission, where data to a single user is simultane-ously transmitted from multiple BSs. The ICI is then reduced by using the signals transmitted from other BSs to assist the transmission instead of acting as interference.
• Coordinated scheduling and/or coordinated beamforming, where data to a user is transmitted from one BS. However, scheduling and beamforming are coordinated to control ICI.
In CoMP-enabled systems, a cluster of coordinated BSs are typically assumed to be connected to a control unit (CU) via backhaul links [3]-[6]. In frequency division duplex (FDD) systems, each user within the cluster needs to estimate and pre-dict the channel state information (CSI) from all coordinated BSs, and then to feed it back to its serving BS. In a second step, each coordinated BS forwards this information via back-haul links to the CU. Based on the available predicted CSI,
This work is supported by the EU FP7 project INFSO-ICT-247223 ARTIST4G, and the Swedish Research Council via the framework program Dynamic Multipoint Wireless Transmission.
the CU designs the joint transmission and/or user scheduling and/or coordinated beamforming scheme. It then forwards these decisions via backhaul links to each coordinated BS. For the joint transmission approach, the user data also needs to be shared by all coordinated BSs or by a subset of BSs through backhaul links.
Depending on the restrictions of the feedback and backhaul links and the amount of information to be shared among coordinated BSs, the entire transmission loop within the CoMP cluster would introduce different degrees of latency, resulting in outdated CSI measurements [6]. In addition, the quality of the predicted CSI would also be affected by the mobility of the served users [7]. Note that the design of CoMP transmission schemes relies heavily on the quality of the CSI available at the CU.
In this paper, three CoMP transmission schemes that require different degrees of BS coordination are compared:
• Coherent joint transmission. In this approach, data symbols of all users within the CoMP cluster are available for all coordinated BSs. A linear precoding based on zero-forcing is performed for mapping the data symbols of all users to the transmit antenna of each BS [8].
• Non-coherent joint transmission. The BSs within the CoMP cluster are divided into user-specific cooperative BS sets. The data symbol of each user is non-coherently transmit-ted from a subset of BSs, i.e., its cooperative BS set, without joint phase adjustment [9].
• Coordinated scheduling. In this scheme, data to a single user is transmitted from its serving BS. However, scheduling decisions are jointly made at the CU to control ICI [10].
The performance in terms of sum rate is here evaluated for each CoMP transmission scheme. As a baseline, the performance of a traditional single cell transmission scheme without BS coordination is also given. We show that depending on the feedback and backhaul latency, user mobility, as well as user location, a system could switch between the transmission schemes to improve the sum rate.
Notation: Here, ()H , ()T and ()−1 denote the conjugate transpose, transpose and matrix inversion operations, respec-tively. The notation 1[m×n] and 0[m×n] represent the matrix
with m rows and n columns filled with ones and zeros, respectively.|M|denotes the cardinality of the setM.
II. SYSTEM MODEL
We consider the downlink of a CoMP cluster, where N single-antenna BSs are connected via backhaul links to a CU. M single-antenna users are grouped together using a particular resource slot, e.g., a time slot or a subchannel. TheNBSs are assumed to have the same maximum power constraint Pmax
and to share the same resource slot. Let x = [x1, ..., xN]T
denote the signal vector transmitted from all N BSs, with xH
nxn ≤Pmax for alln∈ {1, ..., N}. The received signal at
user m∈ {1, ..., M} can then be expressed as
ym =hmx+nm, (1)
where hm = [hm1, ..., hmN] denotes the channel vector
between user m and all N BSs. Above, nm is the sum of
the thermal noise and the uncoordinated out-of-cluster inter-ference, modeled as independent complex additive Gaussian noise with zero mean and covarianceσ2.
We assume that the system works in FDD mode. Each user m needs to predict the channel vector hm, and feed back
the predicted channel vectorhˆm to the CU via uplink control
channels. Hence, the predicted channel matrix of the system available at the CU isHˆ =[hˆT1, ..,ˆhTM]T
∈ CM×N, which will
be used for the CoMP transmission scheme design.
In this paper, similar to [11], we assume that the predicted channel vector hˆm(t|t−∆t) of each user m at time slot t
is predicted by Kalman predictors using pilot measurements available up to time slot t−∆t. The prediction horizon ∆t corresponds to the delay between the channel observation and the data transmission, including the implementation of user scheduling and precoding, and the feedback and backhaul latency. For optimal filters, such as the Kalman predictor, the prediction error ∆hm(t) is uncorrelated with the prediction.
This is achieved in the simulations by first modeling the predicted channel and the prediction error as i.i.d. complex circular symmetric Gaussian variables with variances σ2
ˆ h and
σ2
∆h respectively. Second, the true channel is calculated as
hm(t) = ˆhm(t|t−∆t) + ∆hm(t). (2)
Given a variance of the true channel σ2
h, the variance of
the channel prediction error, σ2
∆h, can be extracted from the
covariance matrix of (19) in the appendix. Then, σ2 ˆ h can be found from σ2 h=E hmhHm =σ2 ˆ h+σ 2 ∆h.
As can be seen in the appendix, the prediction performance depends on the pilot SNR (through (18)), on the prediction horizon (through (17)) and on the fading statistics including the shape of the Doppler spectrum and the maximum Doppler frequency, i.e. the user velocityv (through the poles of (16)). These factors were thoroughly investigated in [12]. In this paper, we assume a flat Doppler spectrum (as the one in figure 6.8 of [12]), a carrier frequency of fc= 2GHz, and a
fading channel modeled as a fourth order Auto Regressive (AR) model. For ρ = 4 adjacent flat fading pilot bearing subcarriers, with a spacing in time of 0.64 ms, the calculated joint prediction performance is presented in Figure 1. Here the prediction performance is given in terms of Normalized Mean Squared Error (NMSE)σ2∆h/σ2h, for different user velocities and
5 10 15 20 −40 −35 −30 −25 −20 −15 −10 −5 0 ∆t [ms] NMSE [dB] SNR=12 dB SNR=24 dB SNR=36 dB 50 km/h 30 km/h 10 km/h 5 km/h
Figure 1. Prediction performance forfc= 2GHz.v= 5,10,30,50km/h. Pilot SNR= 12,24,36dB.
pilot SNR, as a function of the prediction horizon. Clearly, an increased velocity leads to a decreased predictability.
III. COMP TRANSMISSIONSCHEMES
With the predicted channel matrixHˆ, three different CoMP transmission schemes are considered within a CoMP cluster. The objective is to maximize the sum rate of the cluster, under per-BS power constraints.
A. Coherent Joint Transmission
Assume that the data symbols of all the M users within the cluster are shared among the N coordinated BSs. A linear precoding approach, zero-forcing, is considered as the coherent joint transmission scheme in this section. Note that with linear precoding amongN single-antenna BSs, at most N single-antenna users can be served on the same resource slot without inter-user interference.
LetMdenote the set of scheduled users in a given resource slot, with M ⊆ {1, ..., M} and |M| ≤ N. Let b ∈ C|M| denote the data symbols of the selected users in set M. A precoding matrixW=[w1, ...,w|M|]∈ CN×|M| is designed
for mapping the data symbol vectorbinto the transmit signal vectorx, that is,
x=Wb. (3)
The mth column of W, w
m = [w1m, ..., wN m]T, is the
precoding vector for user m in the set M. Substituting (3) into (1), the received signal of usermcan be rewritten as
ym=hmwmbm+Pi∈M,i6=mhmwibi+nm. (4)
Letpm=bmbHmdenote the symbol power allocated to userm
across theN BSs. The true signal to interference plus noise ratio (SINR) of usermis then given by
γm= k
hmwmk2pm P
i∈M,i6=mkhmwik2pi+σ2
. (5)
Thus, the true sum rate of the cluster can be expressed as C =P
m∈Mlog2(1 +γm). (6)
LetHˆ(M)∈ C|M|×N denote the predicted channel subma-trix related to the set of scheduled users. Using zero-forcing
precoding, the precoding matrix is obtained as the pseudo-inverse of the predicted channel matrix,
W= ˆH(M)H( ˆH(
M) ˆH(M)H)−1. (7)
Based on Hˆ, the CU needs to design the scheduled user set Mand the power allocation vectorp= [p1, ..., p|M|], so as to
maximize the sum rate under per-BS power constraints. The optimization problem for the CU can be formulated as
max M,p P m∈Mlog2(1 + ˆγm) s.t.1)P m∈Mkwnmk2pm≤Pmax, n∈ {1, . . . , N}, 2)pm>0, m∈ M, 3)M ⊆ {1, ..., M},|M| ≤N. (8)
Note that only Hˆ is available at the CU. Hence, joint user scheduling and power allocation is designed based on the predicted SINR γˆm =pm/σ2, which is derived from (5) by
using ˆhm instead of the true channel vector hm.
If the scheduled user set is predetermined and feasible, i.e. if M is fixed and satisfies the constraint 3), then, the above problem becomes a joint power allocation problem. This problem is convex, since the objective function is a concave function ofpand the remaining constraints 1) and 2) are linear. Therefore, the optimal solution with respect to a givenMcan be obtained by numerical convex optimization (CVX) [13]. By solving the joint power allocation problem for every possible user set, the optimal M∗and p∗ can then be obtained. The
true sum rate can then be derived by substitutingM∗ andp∗
into (6). In the following, this zero-forcing joint transmission scheme with optimal power allocation is denoted as ZF-OPA. In order to reduce the complexity, a sub-optimal equal power allocation is considered [8]. In this case, for any given user set, M, the power allocation vector is derived as
p= ( min n=1,...N Pmax P m∈Mkwnmk2 ) 1[|M|×1]. (9)
We refer this zero-forcing joint transmission scheme with equal power allocation as ZF-EPA in this paper.
B. Non-coherent Joint Transmission
In this scheme, joint transmission is non-coherently per-formed without phase adjustment. Hence, this non-coherent joint transmission scheme might be more robust to channel uncertainty than coherent joint transmission.
Let S=[snm] denote a user selection indicator matrix of
size N ×M. If BS n transmits data to user m, snm = 1;
otherwise, smn = 0. Assume that a BS transmits data
non-coherently to at most one user in any given resource slot. Then, at most one single element in each row ofSis non-zero. Hence, the N BSs within a cluster are grouped into several subclusters, forming a group of user-specific cooperative BS sets (CBS). Denote CBSm as the CBS of user m, with
CBSm = {n|snm= 1,∀n∈ {1, ..., N}} consisting of the
BSs that provide data transmission to user m. Note that user m only receives its data from the BSs included in CBSm.
Hence, the amount of user data that needs to be exchanged
via backhaul links between BSs is reduced. The data symbol of usermis transmitted non-coherently from the BSs inCBSm
without phase adjustment, i.e., xn =lnbm for∀n∈CBSm,
where ln ∈ R. Therefore, ICI can not be mitigated by
cancellation. The received signal of usermis given by ym=
P
i∈CBSmhmixi+ P
j∈CBSmhmjxj+nm, (10)
whereCBSm is the complement set of CBSm. DenotePn=
xH
nxnas the transmit power of BSn. The true SINR for user
mis given as γm = P i∈CBSmhmi√Pi 2 P j∈CBSmhmj p Pj 2 +σ2 . (11)
Thus, the true sum rate can be calculated by C=PM
m=1log2(1 +γm). (12)
With the objective of maximizing the sum rate of the cluster, the CU needs to design the user selection indicator matrix S
and the power allocation vectorP= [P1, ..., Pn]based on the
predicted channel matrixHˆ. The optimization problem under per-BS power constraints can be formulated as
max S,P PM m=1log2(1 + ˆγm) s.t.1)0[N×1]PPmax1[N×1], 2)snm∈ {0,1}, 3)PM m=1snm≤1, n∈ {1, . . . , N}, (13)
where γˆm is derived from (11) by using the predicted ˆhm
instead of the true channel vectorhm.
The optimization problem (13) is a non-convex problem. Based on [9], a suboptimal binary power control (BPC) is considered for power allocation, i.e.,Pn= 0orPmaxfor∀n∈
{1, ..., N}. Then, the relaxed problem becomes an exhaustive binary search. The CU searches all the possible values of the user selection indicator matrix S and all feasible boundary point sets for binary power control. The chosen matrix S∗
and transmit power vector P∗ will be the ones that achieve the highestPM
m=1log2(1 + ˆγm). The corresponding true sum
rate can then be obtained by substitutingS∗andP∗into (12). In this paper, the non-coherent joint transmission scheme with BPC is named as NCJT-BPC.
C. Coordinated Scheduling
In the considered coordinated scheduling scheme, data to a single user is only transmitted from its serving BS, which is selected based on the long term channel quality measure-ments, including pathloss and shadow fading. Hence, user data exchange between BSs is not needed. Similar to NCJT-BPC, it is assumed that a BS can transmit data to at most one user in any given resource slot. The received signal of the selected usermto be served by BSncan be expressed as
ym=hmnxn+ P
j6=nhmjxj+nm. (14)
Recall thatPn=xHnxn denotes the transmit power of BSn,
γm= khmnk 2 Pn P j6=nkhmjk2Pj+σ2 . (15)
Thus, the true sum rate can be calculated by (12).
User scheduling and power allocation decisions are jointly made at the CU to control ICI. With the predicted channel matrix Hˆ, the CU designs the user selection indicator matrix
S and the power allocation vector P= [P1, ..., Pn], in order
to maximize the sum rate subject to per-BS power constraints. The optimization problem can be formulated similar to (13). However, the predicted SINR (γˆm) is instead derived from (15)
with the predictedˆhm. Binary power control, which is shown
to be a very efficient suboptimal power allocation solution [10], is performed in this scheme. Then, similar to NCJT-BPC, the suboptimalSandPcan be derived by an exhaustive binary search. In this paper, the coordinated scheduling scheme with binary power control is named as CS-BPC.
IV. SIMULATIONRESULTS
As depicted in Figure 2, we consider the downlink of a CoMP cluster withN= 3neighboring sectors.M= 3 single-antenna users are grouped together using a particular resource slot1. The cluster radiusR is 500 m. The path loss model is
PL(d) = 128.1 + 37.6 log10(d) in dB, with d given in km.
Long-term shadowing is log-normally distributed with zero mean and standard deviation 8 dB. The system SNR is set to 18 dB, which is defined as the received SNR at the boundary of the cell, assuming full power transmission Pmax from the
BS, accounting only for pathloss gain PL(R) and ignoring
shadowing and fast fading [14].
Assume that sector nis the serving sector of usern, with n = {1,2,3}. Each user is moving from the cluster center to the sector center of its serving sector along the dashed line of Figure 2. The performance in terms of cluster sum rate is studied for different CoMP transmission schemes (ZF-OPA, ZF-EPA, NCJT-BPC, CS-BPC), with respect to different sets of user starting locations. For each set of user starting locations, the sum rate is averaged over 1000 independent shadow fading realizations. Single cell transmission without BS coordination, denoted as SC, is used as baseline.
A. Sum rate performance with perfect CSI
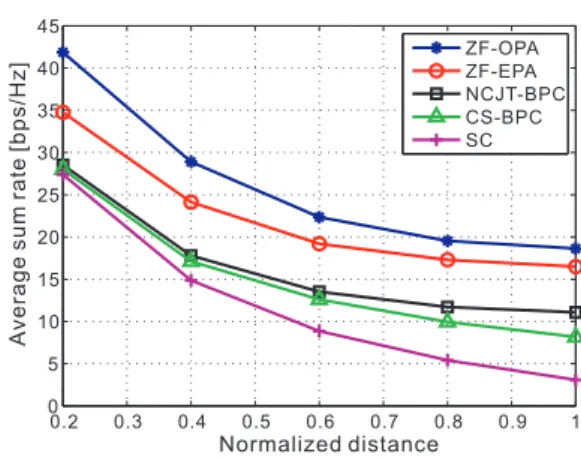
Let dbe the distance between a user and the center of its serving sector as shown in Figure 2. Assume that perfect CSI is available at CU. In Figure 3, the average sum rate of each transmission scheme is plotted versus the normalized distance (d/R). Compared with the SC scheme, the considered CoMP transmission schemes provide a significant average sum rate gain, especially for the users located at the cluster center areas or cell-edge areas (the users with large values ofd).
1Note that there is no constraint on the number of users within the cluster for all the CoMP transmission schemes considered in this paper. However, based on the system model,M=3 is already a full load scenario when focusing on one resource slot. Adding more users will provide multi-user scheduling gain for all schemes.
Figure 2. A CoMP cluster of 3 neighboring sectors (the shadowed area).
0.2 0.3 0.4 0.5 0.6 0.7 0.8 0.9 1 0 5 10 15 20 25 30 35 40 45 Normalized distance A v e ra g e s u m r a te [ b p s /H z ] ZF-OPAZF-EPA NCJT-BPC CS-BPC SC
Figure 3. Average sum rate vs. different normalized distance,d/R. Perfect CSI is assumed to be available at the CU.
Note that ZF-OPA and ZF-EPA achieve superior perfor-mance compared to the NCJT-BPC scheme. That is because, with perfect CSI at the CU, zero-forcing precoding performed in ZF-OPA and ZF-EPA can completely remove the ICI for all users within the CoMP cluster. In the NCJT-BPC scheme, a single user receives data symbols from a subset of BSs, hence, the BSs outside its cooperative BS set (CBSm) would still introduce ICI. In addition, the data symbols of each user are transmitted without phase adjustment, which would also result in performance degradation.
The CS-BPC scheme has the worst performance among the considered CoMP transmission schemes, as multi-BS joint transmission is not supported2. However, ICI is controlled
in the CS-BPC scheme by coordinating the user scheduling and power allocation decisions of the BSs within the cluster. Hence, compared with the SC scheme, CS-BPC can still provide a large performance gain for the users located in the cluster center areas, where ICI is high.
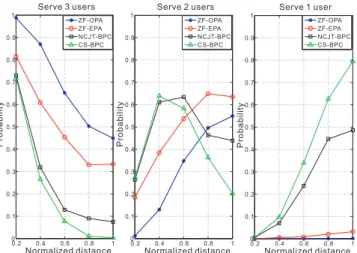
Note that with the objective of maximizing sum rate, some users may be excluded from transmission. Figure 4 shows the probability of serving different number of users for each CoMP transmission scheme versus different normalized dis-tance. We can see that the probability of serving all theM= 3
users decreases for all the considered CoMP transmission schemes as the normalized distance increases, i.e, when the
2The difference in performance between NCJT-BPC and CS-BPC is influ-enced by the cell selection algorithm criteria (instantaneous channel gain or long-term channel gain).
0.2 0.4 0.6 0.8 1 0 0.1 0.2 0.3 0.4 0.5 0.6 0.7 0.8 0.9 1 Normalized distance P ro b a b il it y Serve 3 users ZF-OPA ZF-EPA NCJT-BPC CS-BPC 0.2 0.4 0.6 0.8 1 0 0.1 0.2 0.3 0.4 0.5 0.6 0.7 0.8 0.9 1 Normalized distance P ro b a b il it y Serve 2 users ZF-OPA ZF-EPA NCJT-BPC CS-BPC 0.2 0.4 0.6 0.8 1 0 0.1 0.2 0.3 0.4 0.5 0.6 0.7 0.8 0.9 1 Normalized distance P ro b a b il it y Serve 1 user ZF-OPA ZF-EPA NCJT-BPC CS-BPC
Figure 4. The probability of serving different number of users vs. different normalized distance,d/R. Perfect CSI is assumed to be available at the CU.
users move towards the cluster center area. Compared with NCJT-BPC and CS-BPC for the users located at cluster center (d/R = 1), ZF-OPA and ZF-EPA can achieve much higher probability of serving all the 3 users, as ICI cancellation is provided via zero-forcing. For CS-BPC, where ICI can only be reduced via coordinated scheduling, the probability of serving only one user at the cluster center is very high, i.e., 80%. The probability of serving 3 users, 2 users and 1 user for NCJT-BPC at d/R= 1is 7.5%, 43.9% and 48.6% respectively.
B. Sum rate performance with predicted CSI
Due to practical issues (e.g., feedback and backhaul con-straints, user mobility), only imperfect CSI is available at the CU, which affects the performance of CoMP transmission schemes. In this subsection, the performance of the considered CoMP transmission schemes is evaluated with predicted CSI. The effects of feedback and backhaul latency 4t, and the user mobility v are considered. Channel prediction accuracy is obtained under the assumptions of Figure 1.
First, we investigate the effect of the feedback and backhaul latency on the average sum rate versus the normalized distance (d/R) for 4t = 10.2,20.4, and 30.6 ms respectively, when the user speeds (v) are set to 5 km/h. Figure 5 shows that the average sum rate of the considered CoMP transmission schemes decreases over all cluster area as 4t increases. Compared with the achieved performance under perfect CSI (see Figure 3), the average sum rate of the sector center users when 4t = 30.6 ms is decreased approximately by 30.2%, 24.1%, 1.5% and 1.2% for ZF-OPA, ZF-EPA, NCJT-BPC and CS-BPC respectively. For the cluster center users with 4t = 30.6 ms, the average sum rate of OPA and ZF-EPA dramatically decreases to 53.4% and 49.5%; while the performance loss due to imperfect CSI for NCJT-BPC and CS-BPC is 10.8% and 6.0% respectively. Hence, NCJT-BPC and CS-BPC are more robust to the effect of delay.
When the value of delay is relatively small, e.g.,4t= 10.2
ms, ZF-OPA and ZF-EPA still achieve better performance compared with other transmission schemes. However, when the delay increases, e.g., 4t = 20.4 ms, the average sum
0.2 0.4 0.6 0.8 1 0 5 10 15 20 25 30 35 40 Normalized distance A v e ra g e s u m r a te [ b p s /H z ] ∆ t = 20.4 ms ZF-OPA ZF-EPA NCJT-BPC CS-BPC SC 0.2 0.4 0.6 0.8 1 0 5 10 15 20 25 30 35 40 Normalized distance A v e ra g e s u m r a te [ b p s /H z ] ∆ t = 30.6 ms ZF-OPA ZF-EPA NCJT-BPC CS-BPC SC 0.2 0.4 0.6 0.8 1 0 5 10 15 20 25 30 35 40 Normalized distance A v e ra g e s u m r a te [ b p s /H z ] ∆ t = 10.2 ms ZF-OPA ZF-EPA NCJT-BPC CS-BPC SC
Figure 5. Average sum rate vs. different normalized distance,d/R.
v= 5km/h.4t= 10.2,20.4, 30.6 ms. 0.2 0.4 0.6 0.8 1 0 4 8 12 16 20 24 28 32 36 40 Normalized distance A v e ra g e s u m r a te [ b p s /H z ] v = 10 km/h ZF-OPA ZF-EPA NCJT-BPC CS-BPC SC 0.2 0.4 0.6 0.8 1 0 4 8 12 16 20 24 28 32 36 40 Normalized distance A v e ra g e s u m r a te [ b p s /H z ] v = 30 km/h ZF-OPA ZF-EPA NCJT-BPC CS-BPC SC 0.2 0.4 0.6 0.8 1 0 4 8 12 16 20 24 28 32 36 40 Normalized distance A v e ra g e s u m r a te [ b p s /H z ] v = 50 km/h ZF-OPA ZF-EPA NCJT-BPC CS-BPC SC
Figure 6. Average sum rate vs. different normalized distance,d/R.
4t= 5.1ms.v= 10, 30, 50 km/h.
rate of NCJT-BPC begin to converge to that achieved by ZF-EPA. When 4t= 30.6 ms, NCJT-BPC outperforms ZF-OPA for d/R > 0.4, with ZF-EPA falling below all other CoMP transmission schemes for d/R < 0.9. Note that in a realistic CoMP system, backhaul links can be implemented via high-latency X2 interfaces [6]. Considering the feedback latency and the data sharing among coordinated BSs, the total latency may be greater than 30.6 ms. Therefore, for high-latency backhaul links, NCJT-BPC is a better choice for CoMP transmission design.
Figure 6 shows the effect of user mobility on the perfor-mance of the considered transmission schemes. The feedback and backhaul latency (4t) is set to 5.1 ms. The average sum rate of each scheme is plotted versus normalized distance for v = 10,30, and 50 km/h respectively. We can see that the performance of ZF-OPA and ZF-EPA significantly decreases as the user velocity (v) increases. The NCJT-BPC and CS-BPC schemes are more robust to the effect of user mobility.
Note that ZF-OPA, which achieves the best performance with perfect CSI, falls below NCJT-BPC for most distances when v = 30 km/h. When v = 50 km/h, where the channel
uncertainty becomes higher, NCJT-BPC and CS-BPC converge to the SC scheme for d/R <0.4, with ZF-OPA and ZF-EPA falling even below the SC scheme in the sector center area (d/R <0.6). Hence, for the high mobility users located in the sector center area, a system would choose the SC scheme for data transmission. However, for d/R >0.4, NCJT-BPC and CS-BPC can still achieve significant performance improve-ment compared with the SC scheme, e.g., the average sum rate gain provided by NCJT-BPC and CS-BPC atd/R= 1is 168.3% and 119.9% respectively. Therefore, the system could switch to NCJT-BPC to increase the sum rate when the high mobility users are located at the cluster center area.
V. CONCLUSIONS
In this contribution, three CoMP transmission schemes, zero-forcing coherent joint transmission, non-coherent joint transmission and coordinated scheduling, have been compared for a CoMP cluster under predicted CSI. The effects of feed-back and feed-backhaul latency, as well as user mobility are studied. The considered performance metric is the average sum rate of a CoMP cluster, under per-BS power constraints. It has been shown that non-coherent joint transmission and coordinated scheduling are more robust to the channel uncertainty, while the performance of zero-forcing joint transmission heavily relies on the quality of CSI available at the control unit. There-fore, depending on the feedback and backhaul latency, user mobility and user locations, a system could switch between the transmission schemes to improve sum rate. For example, with low feedback and backhaul latency, zero-forcing joint transmission can be selected to serve the low mobility users. For the high mobility users located at the sector center area, a system would choose traditional single cell transmission, and then switch to the non-coherent joint transmission scheme when the high mobility users move to the cluster center area. The CoMP transmission schemes in this paper are designed with the objective of maximizing sum rate. Hence, all users in the cluster are not always served in a particular resource slot. In future work, the user fairness will be taken into account. In addition, distributed CoMP network frameworks will be considered and compared with this centralized framework.
VI. APPENDIX
We here assume Kalman predictors, located at the m = 1, ..., Musers, with perfect knowledge of the channel statistics over time, modeled by an Auto Regressive (AR) model
zm(t+ 1) =Az(t) +Bem(t),hm(t) =Cz(t). (16)
Here,zm(t)is the state vector,em(t)is the process noise and
A,B andC are the state space matrices on diagonal form. To improve prediction performance, at the price of higher computational complexity, a number of ρ > 1 adjacent pilot bearing subcarriers can be predicted jointly. Then everyhm,n
in hm is aρsized vector including the channels of the pilot
bearing subcarriers. We here assume that these subcarriers are flat fading, which is reasonable for an OFDM system whenρ is kept low and pilots are not too sparse in frequency.
Through the Kalman equations (see e.g. equations (3.4.33)-(3.4.39) of [12]) and the pilot measurements up to timetwe gain an estimate of the state variable vectorzˆm(t|t)and also
its covariance matrixP(t|t), at timet. The later can be used to iteratively calculate the covariance matrix for the predicted state variable vectorzˆm(t+ ∆t|t)at timet+ ∆tthrough
P(t+k|t) =AP(t+k−1|t)AH+BQBH, (17)
for k = 1, ..,∆t. Here, Q is the covariance matrix of the process noise in (16) and given by Q = Rh ! C! B1BH ! 1−aaH CH
[12], where denotes ele-ment wise division, andais a vector with the eigenvalues of A(i.e., the poles of the system). For flat fading channels and orthogonal pilots, the covariance matrixRh=E
hmhHm
is a block diagonal matrix
Rh=diag{pm1σ2h,1/σ21[l×l], ..., pmNσh,N2 /σ 21
[l×l]}, (18)
where pmnσh,n2 /σ2 is the SNR of the measured pilot from
BS n. Since the channel is predicted as hˆm(t|t−∆t) =
Czˆm(t+ ∆t|t), the covariance of the channel prediction error
can then be calculated through R∆h = CP(t+ ∆t|t)CH.
Assuming that the predictions of the channels from different BS are uncorrelated we get that, for flat fading channel,
R∆h=diag{pm1σ∆h,12 /σ21[l×l], ..., pmNσ∆h,N2 /σ21[l×l]}.
(19) REFERENCES
[1] M. Sawahashi, Y. Kishiyama, A. Morimoto, et al., “Coordinated multi-point transmission/reception techniques for LTE-Advanced,”IEEE Wire-less Commun. Mag., vol. 17, no. 3, pp. 26-34, June 2010.
[2] 3GPP TR 36.814 v9.0.0, Further advancements for E-UTRA physical layer aspects, 2010.
[3] J. Zhang, R. Chen, J. G. Andrews, A. Ghosh and R. W Heath, “Networked MIMO with clustered linear precoding,”IEEE Trans. on Wireless Commun., vol. 8, no. 4, pp. 1910-1921, April 2009. [4] A. Papadogiannis and G. C. Alexandropoulos, “The value of dynamic
clustering of base stations for future wireless networks,”in Proc. IEEE World Congr. Comput. Intell., Barcelona, Spain, Jul. 2010.
[5] J. Li, C. Botella, and T. Svensson, “Resource allocation for clustered network MIMO OFDMA systems,” EURASIP Journal on Wireless Commun. and Networking, 2012.
[6] R1-112339, CoMP performance evaluation under low-capacity and high-latency backhaul, 3GPP TSG RAN WG1 #66, Aug. 2011.
[7] R. Fritzsche and G. P Fettweis, “CSI distribution for joint processing in cooperative cellular networks,”in Proc. IEEE VTC2011-Fall, San Francisco, USA, 2011.
[8] H. Zhang and H. Dai, “Cochannel interference mitigation and coop-erative processing in downlink multicell multiuser MIMO networks,”
EURASIP Journal on Wireless Commun. and Networking, 2004. [9] J. Li, T. Svensson, C. Botella, T. Eriksson, X. Xu and X. Chen, “Joint
scheduling and power control in coordinated multi-point clusters,”in Proc. IEEE VTC2011-Fall, San Francisco, USA, 2011.
[10] A. Gjendemsjø, D. Gesbert, G. Øien and S. Kiani, “Binary power control for sum rate maximization over multiple interfering links,”IEEE Trans. Wireless Commun., vol. 7, no. 8, pp. 3164-3173, Aug. 2008. [11] R. Apelfröjd, M. Sternad and D. Aronsson, “Measurement-based
eval-uation of robust linear precoding for downlink CoMP,”in Proc. IEEE ICC’12, Ottawa, Canada, 2012.
[12] D. Aronsson, “Channel estimation and prediction for MIMO OFDM sys-tems - key design and performance aspects of kalman-based algorithms,” Department of Engineering Sciences, Uppsala University, March 2011. [13] S. Boyd and L. Vandenberghe, “Convex optimization”, Cambridge
Univesity Press, NY, USA, 2004.
[14] A. Papadogiannis, H. J. Bang, D. Gesbert and E. Hardouin, “Efficient selective feedback design for multicell cooperative networks,” IEEE Trans.Vehicular Techn., vol. 60, no. 1, pp. 196-205, Jan. 2011.