Risiken innovativ managen
Chancen nutzen – Werte schaffen
Risk Reporting and Risks Reported
„A Study on German HDAX-listed Companies
2000 to 2005“
Thomas Berger, Dr. Werner Gleißner
Paper presented at the
5th International Conference on Money, Investment & Risk Nottingham, 1 – 3 November 2006
Risk Reporting and Risks Reported 2 of 20
Risk Reporting and Risks Reported:
A Study on German HDAX-listed Companies 2000 to 2005
by
Thomas B. Berger and Dr. Werner Gleißner*
Abstract
In recent years new reporting standards and laws have been issued. For German companies, the KonTraG (Corporate Sector Supervision and Transparency Act) was introduced in 1998 and the German Accounting Standard (GAS 5 Risk Reporting) is in place since 2001. This study analyses the disclosure of risks within the annual reports from 2000 to 2005, based on the re-quirements of the GAS 5. In the study, the annual reports of all non-financial companies listed in the HDAX (DAX, MDAX and TecDAX) are analysed. The current sample includes 92 companies enlisted in the above standards at the Frankfurt Stock Exchange as of 31 December 2005. The risk disclosures and the information quality are analysed in the three categories information con-tent, reported risk management system and reported risks. The results show that there is some improvement in the quality of risk disclosure since 2000 but at a low level and depending on the standard. The quality of the reported risk management system as also improved, but at a very low level. Especially the aggregation of risk and the quality of derivation of risk exposure is highly questionable. The number and proportion of risks reported have also changed, although some risks have always been reported frequently.
Key words
Risk disclosure, Risk reporting, Risk Management HDAX, GAS 5
* Dr. Werner Gleißner is managing director of the risk management consultancy RMCE RiskCon GmbH and CEO of FutureValue Group AG. He is a reader in risk management and rating at University Stuttgart, University Augs-burg (ZWW) and European Business School (Oestrich-Winkel). Thomas Berger is consultant with RMCE Risk-Con and lecturer at the University of Co-operative Education Stuttgart, the University of Applied Science Nuertin-gen and the University of Oldenburg. Corresponding address: [email protected] The authors would like to thank Daniel Jürgens, Sven-Christian Mayer and Christian Württemberger for their help in carrying out the study
Contents
1 RISK REPORTING ... 4
1.1 German Framework for the Disclosure of Risks ... 4
1.2 Current Literature and Empirical Findings for Germany... 4
2 STUDY DESIGN ... 6
2.1 Background and Aim of Study... 6
2.2 Research Methods... 6
2.2.1Information Content ... 6
2.2.2Risk Management System ... 6
2.2.3Risk Analysis ... 7
2.2.4Statistical Analysis ... 7
3 RESULTS ... 8
3.1 Information Content ... 8
3.2 Risk Management Systems ... 9
3.3 Risk Analysis ... 11 3.4 Statistical Analysis ... 14 4 CONCLUSION... 14 5 APPENDIX ... 16 5.1 Methodological Details ... 16 5.1.1Information Quality... 16
5.1.2Risk Management Systems ... 16
5.2 Risk Categories and Risk Fields ... 17
5.3 Company Sample for 2005 ... 18
5.4 Best Practise Companies 2005 ... 18
Risk Reporting and Risks Reported 4 of 20
1 Risk Reporting
1.1 German Framework for the Disclosure of Risks
In Germany, risk reports are a mandatory part of the progress report since 1998 with the intro-duction of the KonTraG (Corporate Sector Supervision and Transparency Act)1. According to § 289, 1 HGB, it was made mandatory to disclose information concerning the business activity and the associated risks2. Although this was a legal requirement, it was not exactly clear what kind of risk information and to what extend companies had to disclose. This led to the development of the German Accounting Standards Board standard on risk reporting (GAS 5). GAS 5 applies to risk disclosure in the group annual report, but its application is recommended for risk disclosure in the annual report, too. (Dobler 2003: 3) In short, the GAS 5 requires company-groups to dis-close information about
► the risk management system,
► qualitative and quantitative data on relevant risks, classified into risk categories, ► the risk policy, as well as
► risk treatment measures.
In addition, GAS 5.15 states that risks which may lead to an insolvency must explicitly be la-belled accordingly with the German expression “bestandsgefährdend” (risk of insolvency). Al-though that it seems clear what should be disclosed, the GAS 5 leaves some open doors for the non-discloser of quantitative information. Companies are only required to disclose hard data if the underlying techniques for assessing the impact of these risks are well-sounded and the processes of quantification can be economically undertaken (GAS 5.20). Based on these re-quirements, this study on risk reporting of German companies was carried out.
1.2 Current Literature and Empirical Findings for Germany
There is a growing body on studies concerning risk reporting of German companies3. Kajüter (2001) analysed the progress reports of 82 non-financial German DAX30 and MDAX-listed com-panies in 1999 shortly before the introduction of GAS 5. The information quality was not suffi-cient and the disclosure of relevant information was questionable. After the introduction of GAS 5, Kajüter and Winkler (2003) in a study covering all German HDAX-listed companies for the fi-nancial years 1999 to 2001, analysed the risk reports again and came to a similar conclusion. Especially the requirements of the GAS 5 where not seen as being met yet.
1
For all financial years following the 31/12/2004, the new requirements of the Bilanzrechtsreformgesetz must be met. Two of the requirements are the disclosure of chances and their underlying assumptions for the planning within the progress report. See Kaiser (2005)
2
For international studies see Hossaini/Perera/Rahman (1995) for New Zealand; Linsley/Shrives (2000) for the UK, Denk/Exner-Merkelt/Ruthner (2005) for Austria; Beretta/Bozzolan (2004) for Italy. For an overview of this field see Linsley/Shrives (2006); Berger (2006); Duch (2006) or Gleißner et al (2005)
3
There is also a growing number of literature on the theoretical background of risk reports, analysing the incen-tives and role in disclosing risk information. See e.g. Bungartz (2003), Dobler (2004) and Duch (2006)
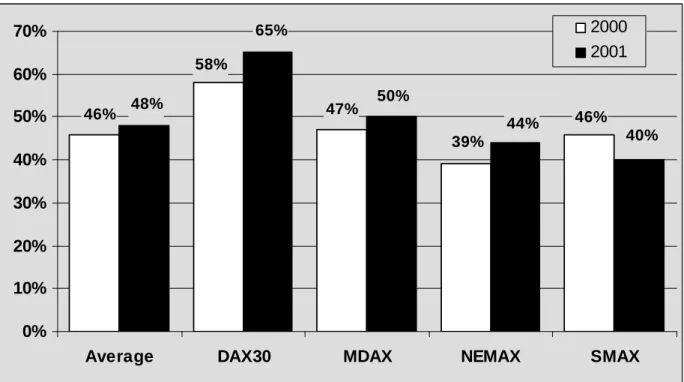
Küting and Heiden (2002) in their study of German companies listed in the DAX, MDAX, NEMAX and SMAX for 2000 and 2001 saw an improvement of the information quality as can be taken from the following figure.
46% 47% 58% 46% 39% 48% 65% 50% 44% 40% 0% 10% 20% 30% 40% 50% 60% 70%
Average DAX30 MDAX NEMAX SMAX
2000 2001
Figure 1: Information quality for 2000 and 2001 (Küting/Heiden 2002: 936)
Nevertheless, the overall quality was only seen as satisfying and far from being good, with an average of 48% of the maximum possible score. The range of fulfilment in 2001 was between 40% for the SMAX and 65% for the DAX30, showing that bigger companies had a higher infor-mation quality. Interestingly, only a few companies like e.on or DaimlerChrysler disclosed quanti-fied information regarding risks.
Hoitsch/Winter/Baumann (2006), in a 2005 questionnaire-based study by the University of Mannheim4 aimed at assessing the state and role of risk controlling of 250 randomly chosen German incorporated firms with more than 500 employees and more than €50m in turnover. The methods and techniques used are generally simple ones, methods like value at risk/cash flow at risk or simulation techniques are not widespread. Additionally, risk controlling is not integrated into other processes but seen as a stand-alone process. Asked for the reason, companies im-plemented risk management, the vast majority stated legal requirements. This could explain why these companies in general do not take advantage of their early warning system.
4
Risk Reporting and Risks Reported 6 of 20
2 Study Design
2.1 Background and Aim of Study
The following study, carried out by RMCE RiskCon, builds up on the above mentioned studies on the quality of risk reporting after the introduction of GAS 5. It extends the period of analysis to six years and covers all HDAX listed non-financial companies since 2000, with a current sample size of 92 companies. It further extends the analysis to the assessment of the reported risk management systems. Besides this, the study is the first one to analyse the disclosed risks of German companies over time.
2.2 Research Methods
The risk reports are analysed in three different ways: Firstly by assessing the information con-tent, secondly by analysing the reported risk management system and finally by systematically analysing the reported risks. In addition, a statistical analysis is carried out to look for possible correlations between the variables. Details of the method can be taken from the appendix.
2.2.1 Information Content
The information content is assessed by assigning a maximum of three points per category in five different categories, derived from the GAS 5:
► KR1: Definition of risk categories (GAS 5.16)
► KR2: Description of risks and supporting information (GAS 5.18) ► KR3: Risk quantification (GAS 5.20)
► KR4: Description of risk treatment measures (GAS 5.21) ► KR5: Risk Exposure (GAS 5.15)
2.2.2 Risk Management System
The state of the (reported) risk management system is analysed by breaking down the require-ments of the GAS 5 into five categories and assigning a maximum of three points in every cate-gory5:
► KS1: Risk Policy (GAS 5.29)
► KS2: Risk Analysis methods and techniques (GAS 5.29) ► KS3: Risk Aggregation method (GAS 5.13/25)
► KS4: Organizational framework (GAS 5.28)
► KS5: Risk Controlling, documentation (GAS 5.28/29)
5
Note that the GAS does require disclosures of risk management processes but does not specify these require-ments. Therefore, based on the existing literature on risk management, the current state of risk management was taken at the basis for the assessment. See e.g. Culp (2002) or Gleißner (2005)
2.2.3 Risk Analysis Risk Categories
All risk reports where analysed and the stated risks where grouped into the following six risk categories:
► Strategic Risks ► Market Risks ► Financial Risks
► Political/Legal and socio-economic Risks ► Risks from Corporate Governance
► Operational Risks, Risks from value-chain and supporting processes, other risks
These risk categories consist of several risk fields, as can be taken from the appendix.
Risk Relevance
All analysed risks are also grouped according to the respective relevance into the five relevance groups 1 (“not significant risk”), 2 (“medium risk”), 3 (“relevant risk”), 4 (“serious risk”) 5 (“risk of insolvency”). According to the GAS 5, risk reports must include all risks that are relevant to the investor’s decision-making (GAS 5.10). Therefore it can be assumed that if not otherwise stated a risk can be seen as being relevant and can be grouped into category three. If companies plau-sibly state that they can handle a risk, it is grouped into category two. Risks that are described as insignificant, are grouped into category one. Risks that could lead to an insolvency have to be named so and can be grouped into category five. Risks that are described as serious, but are not seen as endangering the company, are grouped into category four.
2.2.4 Statistical Analysis
Besides the qualitative analysis of risk reporting, the following data were also taken into account and the stochastic dependencies analysed:
► Market capitalization as of 31/12/2005 in €m ► Number of pages of risk report
► Assessment of information quality (points achieved) ► Assessment of risk management system (points achieved)
► Overall assessed quality of risk reports (% of points achieved in both categories) ► Equity ratio (taken from the study carried out by the IWP (2006))
► Profitability (taken from the study carried out by the IWP (2006)) ► Number of risk fields reported
Risk Reporting and Risks Reported 8 of 20
3 Results
3.1 Information Content
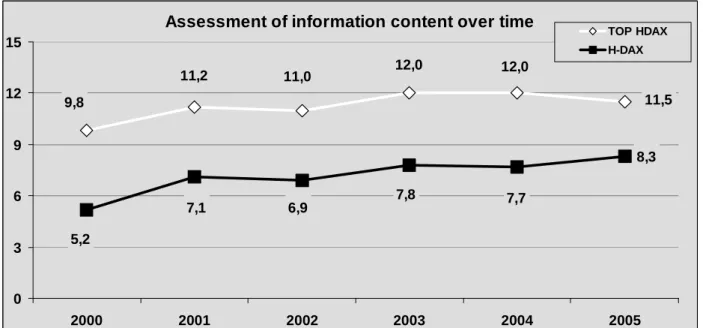
The information content has improved over time, with a total of 8.3 points in all five categories in 2005, from just 5.2 in 2000. But as can be seen from the comparison with the average of 11.5 of best 25% and the maximum assessment of 15 points, this is far from being good.
Assessment of information content over time
8,3 11,5 12,0 9,8 11,2 11,0 12,0 7,7 7,8 5,2 6,9 7,1 0 3 6 9 12 15 2000 2001 2002 2003 2004 2005 TOP HDAX H-DAX
Figure 2: Information content over time
Looking at the details in the three categories and the different segments of the HDAX, one can find some differences across the segments.
Inform ation Content
2,5 2,4 0,5 2,1 1,0 2,7 2,4 1,1 2,4 2,4 0,4 2,1 1,1 2,4 2,2 0,3 1,7 0,6 0,6 2,3 0 1 2 3
Risk Cate g o rie s Risk De scrip tio n Risk Qu antification De scriptio n o f Risk Tre atme n t
Risk Exp osu re HDAX DAX 30 M DAX Te cDAX
In general, companies describe risks and the risk treatment in detail and also use risk categories to group the different risks in the risk report. Unfortunately, they do not provide much quantitative information. Only one company, Jenoptik AG, discloses more than one number in more than one category. The same is true for the risk exposure. Although more than half the sample receive at least one point, only two companies disclose the size of the risk exposure quantitatively: Deutsche Börse AG and Hochtief AG6. Some companies like SAP do also state the impact of single risks in comparison with the risk exposure.
3.2 Risk Management Systems
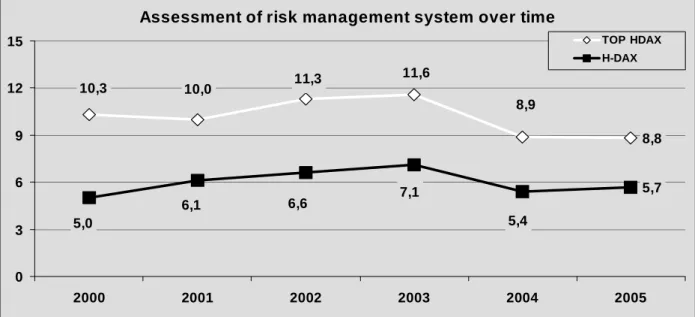
A similar picture can be yielded with the results for the reported risk management system. But in contrast to the information content, there can not be seen a clear improvement7 and the average score is just above one third of the maximum score. Even for the best 25% of the sample, the to-tal score is just at 8.8 points, meaning 59% of the requirements met of what is seen as state of the art in risk management.
Assessment of risk management system over time
8,8 5,7 8,9 10,0 10,3 11,6 11,3 5,4 7,1 6,6 5,0 6,1 0 3 6 9 12 15 2000 2001 2002 2003 2004 2005 TOP HDAX H-DAX
Figure 4: Risk management system assessment over time
The detailed results yield to a similar tendency as for information content: companies listed in the DAX30 achieve better results as companies in the other sectors, with an average of 7.2 compared to the MDAX with 5.6 and the TecDAX with 4.2 points8.
6
See annual report 2005, Deutsche Börse AG, p. 100; Hochtief AG, p. 74.
7
It has to be noted, that for the years after 2003, the criteria have been re-adjusted to measure the effects of the Bilanzrechtsreformgesetz which affects all annual reports after 31/12/2004 and to measure if the requirements of this law are being met.
8
Risk Reporting and Risks Reported 10 of 20
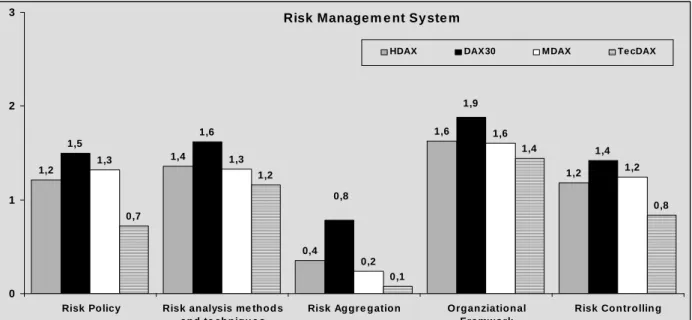
Risk Manage m e nt Sy ste m
1,2 1,4 0,4 1,6 1,2 1,5 1,6 1,4 1,3 1,3 0,2 1,6 1,2 0,7 1,2 0,1 1,4 0,8 1,9 0,8 0 1 2 3
Risk Policy Risk analysis me thod s and te chniqu e s
Risk Aggre gation Organziational Framwork
Risk Controllin g
HDAX DAX30 MDAX Te cDAX
Figure 5: Assessment of risk management systems across the segments
Companies provide investors with sufficient information about the organizational framework and to a lesser extend with information about risk analysis methods and techniques and risk control-ling. The disclosure of the risk policy almost reaches 50% of the possible maximum. Here, Metro as well as ThyssenKrupp can be seen as good examples. All three distinguish between core risks and peripheral risks and state that peripheral risks are transferred if possible and cheaper than bearing the risk9.
The most obvious weakness lies in the area of risk aggregation: Only three companies state a risk aggregation using simulation techniques – Deutsche Börse, Deutsche Telekom and SAP – all listed in the DAX30. Whether this is the actual picture or not can not be said. The findings from Hoitsch/Winter/Baumann (2006) would support that this is the actual picture. If this would be true, it must be heavily doubted that information regarding the risk exposure is accurate, as the dependencies between the different risks would have not been taken into account.
This can be shown for the DIS AG10. DIS discloses all relevant single risks on-line and also states the risk exposure in €m. The risk exposure is determined by simply adding up the net im-pact – size x probability – of all risks11. Of course, this was certified by the auditors as being compliant with the requirements, which must be heavily doubted12.
9
See annual reports 2005 Metro AG, p. 63 and ThyssenKrupp, p. 98
10
DIS AG is listed in the SDAX and was not part of the current study, but in previous years has fulfilled all require-ments and gained the maximum score for their information content.
11
A method that is widely used as we can tell from our own experience as risk management consultants. A recent study of German companies came to the result that only 20% of all companies use mathematically sounded simulation techniques like Monte-Carlo-Simulation. See also Ernst&Young (2006).
12
The relevant requirements for the auditing of the risk management system can be found in the IDW Auditing standard 340 of the German Institute of Certified Public Accountants (Institut der Wirtschaftsprüfer, IDW)
3.3 Risk Analysis
As described above, all mentioned risks are grouped into several risk fields and six broader risk categories. The results for 2005 yield the following distribution:
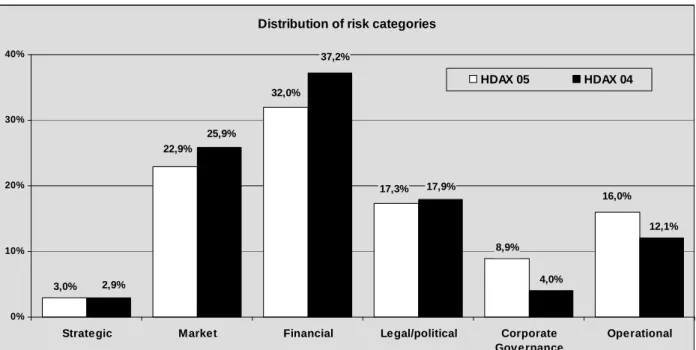
Distribution of risk categories
3,0% 8,9% 4,0% 22,9% 17,3% 16,0% 32,0% 12,1% 17,9% 37,2% 25,9% 2,9% 0% 10% 20% 30% 40%
Strategic Market Financial Legal/political Corporate
Governance
Operational
HDAX 05 HDAX 04
Figure 6: Distribution of risk categories for 2005 and 2004
As in the years before, financial risks dominate, but to a far lesser extend. Changes can be seen in the field of market and operational risks. Minor changes can be seen in the field of le-gal/political risks and strategic risks.
Especially in the case of strategic risk, it can be argued that despite the importance of these kind of risks, companies will not voluntarily disclose information about strategic risks due to their commercial sensitivity (Dobler 2005: 2). Although this may be true, some companies do report strategic risks. Loewe, a TV screen manufacturer, has disclosed several statements about the improper strategy in the past, focusing on standard TV screens instead of focusing on flat screen TVs and the problems of adjusting to the market demand13.
The most obvious change occurred in the field of corporate governance. The proportion of risks reported in this field have doubled since 2004, to the highest proportion since 2000. This could be due to the corruption scandals in Germany like the one at Volkswagen which could have lead to a more sensitive analysis of possible risks in this field and more openly disclosure.
Although there are some differences across the segments, these are not major ones, as can be taken from the below figure.
13
See the Loewe annual reports 2002, 2003 and 2004. Another example would be Cargolifter, an airship producer which went out of business in 2002 and has always stated that its business model is highly questionable. Car-golifter went out of business in 2002.
Risk Reporting and Risks Reported 12 of 20
Risk categories in comparison
3,0% 8,9% 8% 10% 16% 2% 23% 31% 9% 16% 32,0% 22,9% 17,3% 16,0% 15% 17% 33% 24% 3% 3% 32% 22% 17% 18% 0% 10% 20% 30% 40%
Strategic Market Financial Legal/political Corporate
Governance
Operational HDAX DAX 30 MDAX TecDAX
Figure 7: Distribution of risk categories across the segments
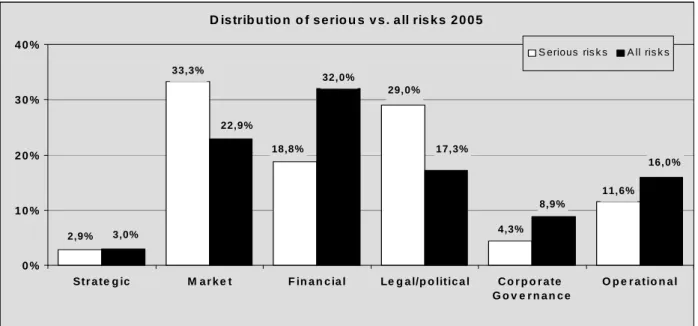
In total, 978 risks (risk fields) where taken from the risk reports, with an average of 10.6 risks per company. The vast majority was seen as being relevant (81%) and grouped into relevance three. 11.6 % of all risks where grouped under relevance two, 1% under relevance one.
Serious risks
From the sample of 978 risks identified, 33 where seen as being serious, belonging to the rele-vance four (“serious risk“) or five (“risk of insolvency“)14. In the following figure, the distribution of these risks is shown against the distribution of all risks reported.
D is trib u tio n o f s e rio u s v s . a ll ris k s 2 0 0 5
33,3% 11,6% 32,0% 29,0% 18,8% 2,9% 3,0% 4,3% 22,9% 17,3% 8,9% 16,0% 0 % 1 0 % 2 0 % 3 0 % 4 0 % Str a te g ic M a r k e t F in a n c ia l Le g a l/p o litic a l C o r p o r a te G o v e r n a n c e O p e r a tio n a l
S erious ris k s A ll ris k s
Figure 8: Distribution of serious and all risks in comparison
14
When looking at the distribution of serious risks, the biggest threads according to the sample, derive from the market, followed by legal and political risks. One may argue that it is easier for managers to disclose risk that are outside his or her sphere of influence, i.e. external risks. This can be supported when looking at the frequently mentioned serious risks: legal and political framework (19%), economic risks (9%) and procurement risks (8%).
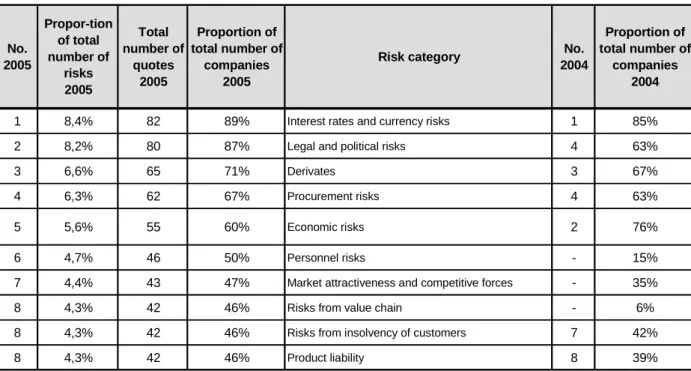
Most Frequently Mentioned Risks
Finally, the frequently mentioned risk fields where analysed, covering all reported risks. Risks from changes of interest rates or exchange rates, risks from derivatives, legal and political risks, procurement risks and economic risks are always under the first ten most frequently mentioned risks. The results for 2005 are compared with the results for 2004, as in the following table.
No. 2005 Propor-tion of total number of risks 2005 Total number of quotes 2005 Proportion of total number of companies 2005
Risk category No.
2004
Proportion of total number of
companies 2004
1 8,4% 82 89% Interest rates and currency risks 1 85%
2 8,2% 80 87% Legal and political risks 4 63%
3 6,6% 65 71% Derivates 3 67%
4 6,3% 62 67% Procurement risks 4 63%
5 5,6% 55 60% Economic risks 2 76%
6 4,7% 46 50% Personnel risks - 15%
7 4,4% 43 47% Market attractiveness and competitive forces - 35%
8 4,3% 42 46% Risks from value chain - 6%
8 4,3% 42 46% Risks from insolvency of customers 7 42%
8 4,3% 42 46% Product liability 8 39%
Table 1: Most frequently mentioned risks 2005 in comparison with 2004
As can be taken from the table, the first five most frequently mentioned risks have not changed significantly compared to 2004. The same is true for the last two risks in the table. Two risks have changed significantly: Risks from value chain and personnel risks.
Risks from value chain have been mentioned by 6% of the companies in 2004, compared to 46% in 2005. Personnel risks have been mentioned by 15% of the companies in 2004, but by 50% in 200515.
15
It must be noted here, the risk field “personnel risks” has be newly introduced in 2005. It was made up of two risk fields in the past. The numbers for 2004 are the sum of these two risk fields.
Risk Reporting and Risks Reported 14 of 20 3.4 Statistical Analysis
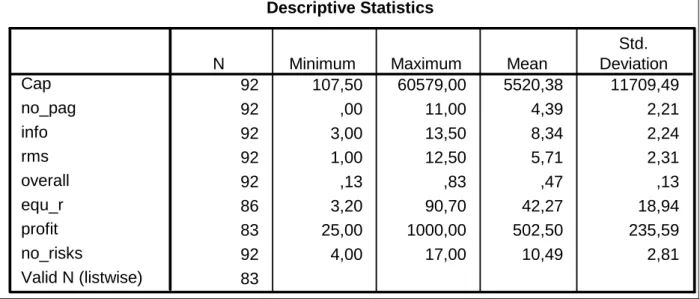
Below are the results for the statistical analysis, carried-out with SPSS
Descriptive Statistics 92 107,50 60579,00 5520,38 11709,49 92 ,00 11,00 4,39 2,21 92 3,00 13,50 8,34 2,24 92 1,00 12,50 5,71 2,31 92 ,13 ,83 ,47 ,13 86 3,20 90,70 42,27 18,94 83 25,00 1000,00 502,50 235,59 92 4,00 17,00 10,49 2,81 83 Cap no_pag info rms overall equ_r profit no_risks Valid N (listwise)
N Minimum Maximum Mean
Std. Deviation
Table 2: Descriptive statistics for the variables
The following table shows the correlations for all the variables.
Correlations 1 ,153 ,249* ,232* ,280** -,230* ,062 ,358** ,146 ,017 ,026 ,007 ,033 ,579 ,000 92 92 92 92 92 86 83 92 ,153 1 ,471** ,253* ,418** -,028 ,128 ,291** ,146 ,000 ,015 ,000 ,797 ,250 ,005 92 92 92 92 92 86 83 92 ,249* ,471** 1 ,437** ,844** -,155 ,089 ,374** ,017 ,000 ,000 ,000 ,153 ,421 ,000 92 92 92 92 92 86 83 92 ,232* ,253* ,437** 1 ,849** -,371** ,016 ,220* ,026 ,015 ,000 ,000 ,000 ,883 ,035 92 92 92 92 92 86 83 92 ,280** ,418** ,844** ,849** 1 -,304** ,062 ,347** ,007 ,000 ,000 ,000 ,004 ,576 ,001 92 92 92 92 92 86 83 92 -,230* -,028 -,155 -,371** -,304** 1 ,471** -,206 ,033 ,797 ,153 ,000 ,004 ,000 ,057 86 86 86 86 86 86 83 86 ,062 ,128 ,089 ,016 ,062 ,471** 1 ,035 ,579 ,250 ,421 ,883 ,576 ,000 ,752 83 83 83 83 83 83 83 83 ,358** ,291** ,374** ,220* ,347** -,206 ,035 1 ,000 ,005 ,000 ,035 ,001 ,057 ,752 92 92 92 92 92 86 83 92 Pearson Correlation Sig. (2-tailed) N Pearson Correlation Sig. (2-tailed) N Pearson Correlation Sig. (2-tailed) N Pearson Correlation Sig. (2-tailed) N Pearson Correlation Sig. (2-tailed) N Pearson Correlation Sig. (2-tailed) N Pearson Correlation Sig. (2-tailed) N Pearson Correlation Sig. (2-tailed) N cap no_pag info rms overall equ_r Ertragsstärke_Profit no_risk
cap no_pag info rms overall equ_r
Ertragsstä
rke_Profit no_risk
Correlation is significant at the 0.05 level (2-tailed). *.
Correlation is significant at the 0.01 level (2-tailed). **.
Table 3: Pearson correlation
4 Conclusion
The information quality of risk reports in Germany has improved since 2000, although at a low level. This is especially true for the disclosure of quantitative data. Why companies do not dis-close more risk information may have two reasons: Firstly, the managers have no more and
bet-ter information about risks, secondly, they may have reasons not to disclose more information (Dobler 2005: 2). The risk management systems and the early warning systems can not provide managers with a perfect foresight. They should be good enough to be aware of the most impor-tant risks and their development. But as has been shown with the example of the DIS AG in chapter 3.2, some companies simply have no sound risk management system, that is they “col-lect” all kind of risks and simply add them up to get the risk exposure. Some even assess risks solely qualitatively.
Beside this, managers could have no incentives for the disclosure of more information. Espe-cially when it comes to the disclosure of strategic risks, these could be withheld as they are very sensitive. Indeed, providing information about theses risks, e.g. inconsistency of strategy or false forecasts of business opportunities, would be very important for companies and investors. But again, for managers to state that their strategy might not be suitable or inconsistent would simply not be advisable and is not incentive to them. Although it must be said that some companies have done so in the past.16 Another point could be that managers will not be willing to disclose quantitative information on the size of the risk exposure. This could lead to a situation where in-vestors call for a distribution of capital as the risk adjusted capital needed could be much lower than the actual company’s equity capital. This can be illustrated with the example of Hochtief. This company states a risk exposure of not more than 10% of the current EBT (€33m). This would mean it has an equity coverage ratio of more than 6.900% (€ 33m compared to € 2’200m of equity capital). If this would be the accurate picture, many investors could call for a distribution of equity capital and a substitution with loan capital as credits would be much cheaper17.
Looking at the results of this and other studies into the state of risk management systems, in-vestors may ask if the companies risk exposure is assessed well-sounded as only three compa-nies state a simulation technique. But this is at the heart of risk management. The aggregation of risks must be undertaken with a simulation technique as the correlation of risks – which can be modelled by risk simulation procedures– have explicitly to be taken into account to get the “real picture”. In particular, the capital requirements of a company’s divisions (“risk-adjusted capital”, RAC) necessary for the calculation of the costs of capital can be determined: Capital (shareholders equity) in this sense is a "potential risk-cover“ and is thus required to cover at least the possible losses of the aggregated risk effects. Risk aggregation therefore creates the foundation for calculating the individual contribution of value for each company’s division and of each investment. This is necessary for a value-based corporate management (Gleißner 2005: 484pp.), based on the company’s risk exposure.
In conclusion, the results clearly show even under a mandatory reporting regime like the one in Germany, there may well be an information asymmetry when it comes to risk information due to e.g. Agency problems. To quote Dobler, “the comprehensive risk reporting is rather vague pro-viding dissatisfying information content.” (Dobler 2005: 2)
16
See chapter 3.3 for an example.
17
Risk Reporting and Risks Reported 16 of 20
5 Appendix
5.1 Methodological Details
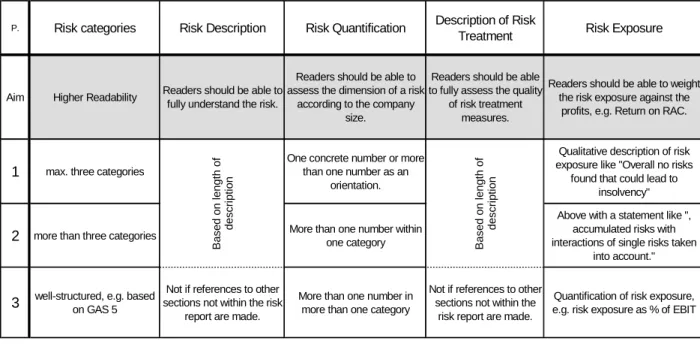
5.1.1 Information Quality
P. Risk categories Risk Description Risk Quantification Description of Risk
Treatment Risk Exposure
Aim Higher Readability Readers should be able to fully understand the risk.
Readers should be able to assess the dimension of a risk
according to the company size.
Readers should be able to fully assess the quality
of risk treatment measures.
Readers should be able to weight the risk exposure against the
profits, e.g. Return on RAC.
1 max. three categories
One concrete number or more than one number as an
orientation.
Qualitative description of risk exposure like "Overall no risks found that could lead to
insolvency"
2 more than three categories More than one number within one category
Above with a statement like ", accumulated risks with interactions of single risks taken
into account."
3 well-structured, e.g. based on GAS 5
Not if references to other sections not within the risk
report are made.
More than one number in more than one category
Not if references to other sections not within the
risk report are made.
Quantification of risk exposure, e.g. risk exposure as % of EBIT
B a s e d o n l e n g th o f d e s c ri p ti o n B a s e d o n l e n g th o f d e s c ri p ti o n
Table 4: Scheme for the assessment of information quality
5.1.2 Risk Management Systems
P Risk Policy Risk analysis methods
and techniques Risk Aggregation method
Organizational
Framework Risk Controlling
Aim
Readers should be able to fully understand the organization's risk policy
Readers should be able to assess the quality of risk
analysis.
Readers should be able to assess the quality of the determination of the risk
exposure.
Efficiency and effectiveness of risk
management.
Readers should be able to assess the quality (of methods and techniques used in the process) of
risk controlling.
1
Standards, limits, uniformal, systematic approach, with
some more details, Weighting of profit against
risks in general
Key expressions like identification, assessment
and documentation and some details with different
methods and techniques.
Expressions like: Summarizing; aggregation; cumulation; aggregated; taken
into account interactions; usage of scenario techniques
AND more details OR combination of two of the
expressions
Something like "integral part"
Subject to regular internal auditing.
2
"hurdle rate", weighting of risks vs. profits with some
more information concerning risk management like targeted
rating.
2,5 if
value-based-management in the context of risk management is mentioned, e.g. derivation of cost of capital based on
risk exposure.
3 Distinction of core risks and peripheral risks.
Two from Value at Risk; planning derivation
analysis; usage of different distributions
Aggregation method must be named, e.g. Monte-Carlo
Simulation
Mention of risk managment software
Like level two with concrete examples Risk maps, early recognition systems, defintion of threshold
values and related measures. Risk committees, risk
owners, organisation chart inclosed Probability and size of risk
AND interactions of risks mentionend OR Simulation
technique mentioned Probability and size of risk
taken into account OR one method from level three
OR "simulation"
5.2 Risk Categories and Risk Fields
Strategic risks
► Core statements, assumptions, consistency of corporate strategy ► Structure of business fields
► Thread of critical success factors and strategic goals
Financial Risks
► Financial stability and liquidity ► Interest rates and exchange rates ► Security and portfolio risks ► Derivative risks
► Risk of insolvency of customers ► Risks from shareholding ► Investment and financing risks ► Pension risks
Market risks
► Market trends: chances and threads
► Market attractiveness and competitive forces
► Thread of market position and competitive advantages ► Economic risks
► Procurement risks
Legal/Political and Socio-Economic Risks
► Legal and political environment ► Socio-economic trends ► Legal liabilities ► Product liabilities
► Risks from General Standard Terms and Conditions and contractual relationships
Corporate Governance
► Risks from organization structure and processes, competencies ► Risks from lack of motivation, organization climate, management style ► Personnel risks in general
► Risk culture and risk communication ► Incentive structure and payments system
Operational Risks, Risks from Value-Chain and Supporting Processes, Other Risks
► Risks from value chain
► Risks from supporting processes and other related risks ► Technical risks (availability)
► Damages to plant and equipment (exogenously influenced) ► Calculation risks
Risk Reporting and Risks Reported 18 of 20
5.3 Company Sample for 2005
ADIDAS AG Aixtron AG ALTANA AG AWD HOLDING AG BASF AG BMW AG BAYER AG Bechtle AG Beiersdorf AG Bilfinger Berger AG CELESIO AG ComBOTS AG Conergy AG Continental AG DaimlerChrysler AG Degussa AG Deutsche Börse AG Deutsche EuroShop AG Deutsche Post AG Douglas Holding AG Drägerwerk AG Vz Deutsche Telekom AG E.ON AG EPCOS AG
ErSol Solar Energy AG Evotec AG
Fielmann AG Fraport AG freenet.de AG
Fresenius Medical Care AG Fresenius AG Funkwerk AG GEA Group AG GPC Biotech AG Heidelberger Druckm. AG Heidelberger Cement AG Henkel KGaA Hochtief AG Hugo Boss AG IDS Scheer AG Infineon Technologies AG IVG Immobilien AG IWKA AG Jenoptik AG K+S AG Karstadt-Quelle AG Kontron AG Krones AG Lanxess AG Leoni AG Linde AG Lufthansa AG MAN AG MediGene AG Medion AG Merck KGaA Metro AG MLP AG mobilcom AG MorphoSys MPC AG
MTU Aero Engines Hold. AG Norddeutsche Affinerie AG Pfeiffer Vacuum AG Pfleiderer AG Premiere AG ProSiebenSAT.1 Media AG PUMA AG Q-CELLS AG QSC AG Rheinmetall AG Rhoen-Klinikum AG RWE AG Salzgitter AG SAP AG Schering AG Schwarz Pharma AG SGL Carbon AG Siemens AG Singulus Technologies AG Software AG SolarWorld AG Stada AG Südzucker AG T-Online AG Techem AG ThyssenKrupp AG TUI AG United Internet AG Volkswagen AG Vossloh AG WINCOR NIXDORF AG
5.4 Best Practise Companies 2005
The following companies belong to the best 25% of the sample in the respective seg-ment information quality and risk manageseg-ment system. Names in italic indicate compa-nies which belong to the best 25% in both segments information content and risk man-agement system. Adidas AG DaimlerChrysler AG Degussa AG Deutsche Börse AG Deutsche EuroShop AG Deutsche Telekom AG Douglas Holding AG Fraport AG Fresenius AG Heidelberger Druckm. AG Heidelberger Cement AG Hochtief AG IWKA AG Jenoptik AG Linde AG Lufthansa AG MAN AG Metro AG MLP AG Mobilcom AG Norddeutsche Affinerie AG RWE AG Salzgitter AG SAP AG Schering AG Siemens AG ThyssenKrupp AG Vossloh AG
6 References
Berger, T. (2006): Risikoberichterstattung, in: Risikomanagement im Unternehmen, 18. Ergänzungslieferung 2006 Beretta, S./Bozzolan, S. (2004): A framework for the analysis of firm risk communication. Journal of Accounting, vol.
39, pp. 265-288
Bungartz, O. (2003): Risk Reporting, Sternenfels 2003 Culp, C. (2002): The ART of risk management, Chichester
Denk, R./Exner-Merkelt, K./Ruthner, R. (2005): Risikoberichterstattung börsennotierter Unternehmen in Österreich, in: Wirtschaft und Management - Schriftenreihe zur wirtschaftswissenschaftlichen Forschung (Hg. Fachhochschule des bfi Wien), No. 4, pp. 9-39
Dobler, M. (2003): Auditing Corporate Risk Management, Munich Business Research Paper 2001-03, revised version 2003
Dobler, M. (2004): Risikoberichterstattung-eine ökonomische Analyse, Frankfurt am Main et al 2004
Dobler, M. (2005): How Informative is Risk Reporting? – A review of disclosure models, Munich Business Research Paper 2005-01, January 2005
Duch, J. (2006): Risikoberichterstattung mit Cash-Flow at Risk-Modellen, Frankfurt/Main 2006 Ernst & Young (2006): Best Practice Survey “Risikomanagement 2005”
German Accounting Standards Board, 2001. Risk reporting (GAS 5). GASB, Berlin.
Gleißner, W. (2001): Identifikation, Messung und Aggregation von Risiken, in: Wertorientiertes Risikomanagement für Industrie und Handel (Eds. Gleißner/Meier), Wiesbaden 2001, 111pp.
Gleißner, W. (2005): Value-based corporate risk management, in: Corporate risk management-challenge and oppor-tunity (Eds. Frenkel/Hommel/Rudolf), Berlin/Heidelberg 2005, pp. 479-494
Gleißner, W./Berger, T./Rinne, M./Schmidt, M.: Risikoberichterstattung und Risikoprofile von H-DAX-Unternehmen 2000 bis 2003. FINANZ BETRIEB, no. 5/2005, pp. 343-353
Hoitsch, H.-J./Winter, P./Baumann, N. (2006): Ergebnisse einer empirischen Untersuchung. Controlling, no. 2/2006, pp. 69-78.
Hossaini, M./Perera, M/Rahman, A (1995): Voluntary disclosures in the annual reports of New Zealand companies. Journal of International Financial Management and Accounting, vol. 6, no. 1, 69-85
IWP – Institut für Wirtschaftsprüfung an der Universität des Saarlands (2006): Handelsblatt Firmencheck 2006 Kaiser, K. (2005): Erweiterung der zukunftsorientierten Lageberichterstattung, Folgen des
Bilanzrechtsreformgesetz-tes für Unternehmen. Der Betrieb, no. 7/2005, pp. 345-353
Kajüter, P. (2001): Risikoberichterstattung: Empirische Befunde und der Entwurf des DRS 5. Der Betrieb, no. 3/2001, pp. 105-111
Kajüter, P./Winkler, C. (2003): Die Risikoberichterstattung DAX-100 Unternehmen im Zeitvergleich – Ergebnisse einer empirischen Untersuchung. KoR-Zeitschrift für kapitalmarktorientierte Rechnungslegung, no. 5/2003, pp. 217-228 Küting, K./Heiden, M. (2002): Zur Informationsqualität der Lageberichterstattung in deutschen Geschäftsberichten –
Branchenangaben, Risikobericht, Prognosebericht. StuB - Steuern und Bilanzen, no. 19/2002, pp. 933-937 Linsley, P./Shrives, P. (2000): Risk Management and Reporting Risk in the UK. Journal of Risk, vol. 3, no. 1, pp.
115-129
Linsley, P./Shrives, P. (2006): Risk reporting: A study of risk disclosures, The British Accounting Review, article in press
Rang, R. (2004):Qualität der Lageberichterstattung von Kapitalgesellschaften in Deutschland; Study carried out on behalf of the Hans-Böckler Foundation, available on-line at www.boeckler.de
RMCE RiskCon GmbH Bahnhofstr. 11a D-90402 Nürnberg Germany Obere Gärten 18 D-70771 Leinfelden- Echterdingen/Stetten Germany Valentinskamp 20 D-20354 Hamburg Germany Budapester Str. 31 D-20354 Berlin Germany Lugeck 1 A-1010 Vienna Austria [email protected] www.rmce.de Tel +49[0]911-959 96-50 Fax +49[0]911-959 96-16 Tel +49[0]711-7973 58-50 Fax +49[0]711-7973 58-48 Tel +49[0]40-359 14-149 Fax +49[0]40-359 14-406 Tel +49[0]30-2500 92-850 Fax +49[0]30-2500 92-755 Tel. +43[0]1-58910-0 Fax +43[0]1-58910-222