Interpretability-oriented data-driven
modelling of bladder cancer via
computational intelligence
Julio Cesar De Alejandro Montalvo
Department of Automatic Control and Systems
Engineering
The University of Sheffield
This dissertation is submitted for the degree of Doctor of
Philosophy
i
Abstract
The research presented is this thesis entails the study of microarray-based bladder cancer data and the development of new model-based data mining methodologies for accurate prediction of cancer stage, grade and survival. The main focus of the presented research work, from a systems engineering perspective, is on producing models that are more accurate, while maintaining a simple computational structure, interpretable and with good generalisation performance. Such traits deem the developed methodologies as easier to create and use by non-experts.
The presented data-driven computational modelling framework includes a Radial-Basis-Function (RBF) Neural-Fuzzy function, where the universal approximation property is utilised to create an accurate, yet simple, model structure. The scaling-up performance of the developed model is also examined, resulting in a proposal for an enhanced knowledge-capture and model optimisation method. The predictive modelling results show that the RBF-Neural-Fuzzy model outperforms existing modelling attempts in the literature, while identifying clinically relevant gene signatures.
A major contribution of this thesis is the creation of model-based feature-selection framework, as an embedded method for gene signature identification for bladder cancer. For the first time in the literature, an entropy-based iterative algorithm is combined with the previously created RBF model to create an efficient feature selection technique. The Tagaki-Sugeno-Kang (TSK) output layer of the RBF model is used as a feature discriminator, to estimate the relative contribution of each gene to the overall gene signature. The reduced size model (as a result of the iterative feature-selection) achieves more than 80% accuracy on the prediction of patient survival on new
ii
(“unseen”) patient cohorts, whilst achieving this with less than 25 genes. This is the best performing model-based approach in the literature for this type of cancer, for a gene-signature of less than 25 genes (typical microarray-based gene-signature size in the literature is 100-200 genes).
An in-depth analysis of the generalisation performance of the developed models is carried out by cross-validating distinct microarray data and applying data integration techniques. Three data integration approaches are utilised, to address the well-known issue of data cohort mismatch (for different microarray technologies), and based on the results a model-based non-linear mapping approach is introduced. The obtained results demonstrate how data integration methods for model cross-validation can have a significant increase in the generalisation performance, and enable previously developed models to be used in different patient cohorts.
iii
Acknowledgments
I would like to gratefully and sincerely thank Dr. George Panoutsos, Professor Mahdi Mahfouf and Dr. James Catto for their guidance, understanding, and patience during my graduate studies at The University of Sheffield.
Finally, and most importantly, I would like to thank my family for their support, encouragement and patience.
iv
Table of Contents
Abstract ... i
Acknowledgments ... iii
List of acronyms ... viii
List of figures ... x
List of tables ... xii
Chapter 1: Motivation and thesis overview ... 1
1.1 Background and Motivation ... 2
1.2 Research Objectives and Contributions ... 4
1.2.1 Publications: ... 6
1.3 Thesis Outline ... 8
Chapter 2: Microarray technologies and data-driven modelling for bladder cancer ... 11
2.1 Cancer Overview ... 11
2.2 Bladder Cancer ... 12
2.3 Microarray Analysis ... 15
2.4 Feature selection methods applied to microarray ... 17
2.4.1 Filter Methods ... 19
2.4.2 Feature Selection: Wrapper Methods ... 21
2.4.3 Embedded Methods... 22
2.5 Feature selection methods in high dimensional low sample size data ... 23
2.6 Machine learning models for microarray Cancer Classification ... 24
2.6.1 Computational Intelligence Modelling for Cancer Classification ... 24
2.6.2 Machine learning models specific to microarray bladder cancer Stage, Grade and Survival Classification ... 29
v
2.7 Summary ... 30
Chapter 3: Modelling of microarray gene signatures via Radial Basis Function networks ... 34
3.1 Introduction ... 34
3.2 Data Pre-processing and Initial Gene Selection ... 36
3.2.1 Normalisation and Missing Values ... 37
3.2.2 Initial Gene Selection with T-Test ... 39
3.3 Initial rule-base elicitation via Fuzzy C-Means ... 40
3.4 RBF-Neural-Fuzzy System ... 42
3.5 Levenberg Marquardt Optimisation ... 46
3.6 Simulation Results ... 47
3.6.1 Survival Prediction ... 49
3.6.2 Stage and Grade Prediction ... 53
3.6.3 Fuzzy Logic-type linguistic rule-base ... 56
3.6.4 Comparative Study ... 57
3.7 Summary ... 59
Chapter 4: Scaling-up performance of RBF models in bladder cancer prediction 63 4.1 Introduction ... 63
4.2 Methodology ... 66
4.2.1 FCM and RBF-NF function model ... 66
4.2.2 WFCM and RBF-NF function model ... 67
4.2.3 WFCM, validation index and RBF-NF function model ... 69
4.3 Scaling-up performance of RBF-NF models ... 70
4.4 Analysis of predictive performance ... 82
4.5 Summary ... 83
Chapter 5: A new Fuzzy entropy model-based feature selection framework ... 86
5.1 Introduction ... 87
vi
5.3 Entropy Measures ... 89
5.3.1 Definition of Entropy ... 90
5.3.2 Fuzzy Entropy ... 91
5.4 RBF- Neural-Fuzzy Entropy Feature Selection ... 91
5.5 Simulation Results ... 99
5.5.1 Prediction of patient stage and grade for bladder cancer using microarray data ... 100
5.5.2 Prediction of patient survival in bladder cancer ... 104
5.5.3 Fuzzy Logic-type linguistic rule-base ... 111
5.5.4 Comparative Study ... 113
5.6 Summary ... 119
Chapter 6: Generalisation properties of microarray-based models ... 122
6.1 Introduction ... 122
6.2 Data Integration ... 126
6.2 .1 Median Adjust ... 126
6.2.2 Quantile discretisation... 127
6.2.3 Input-Output Mapping using a Neural Network ... 127
6.3 Data Integration Results ... 130
6.3.1 Produce models with common genes ... 133
6.3.2 Cross-validate models ... 142
6.5 Summary ... 152
Chapter 7: Conclusions and future research directions ... 155
7.1 Future research directions ... 159
7.1.1 Future research directions for the RBF NF model ... 160
7.1.2 Future research directions for microarray analysis ... 162
References ... 163
vii
Appendix B ... 209 Appendix C: Synthetic Data Set ... 214 Appendix D: Input-output mappings across different microarray technologies, showing the non-linear behaviour ... 215
viii
List of acronyms
(AUC) Area under the Curve
(BN) Bayesian Networks
(BNN) Bayesian Neural Networks
(COG) Centre of gravity
(CI) Computational Intelligence
(CFS) Correlation-Based feature selection
(DNA) Deoxyribonucleic acid
(DOD) Dead of Disease
(FCM) Fuzzy C-means
(FL) Fuzzy Logic
(HDLSS) High dimensional data low sample size data
(HPC) High Performance Computing
(LM) Levenberg-Marquardt
(mRNA) Messenger Ribonucleic acid
(MSE) Mean Square Error
(NN) Neural Networks
(NF) Neural-Fuzzy
ix (PAM) Prediction Analysis for Microarray
(RBF-NN) Radial Basis Function – Neural Network
(RBF-NF) Radial Basis Function Neural-Fuzzy Network
(ROC) Receiver Operating Characteristic
(RMSE) Root Mean Square Error
(SVM) Support Vector Machine
(SVM-RFE) SVM Recursive Feature Elimination
(TSK) Takagi Sugeno Kang
x
List of figures
Figure 2.1: Bladder and nearby organs ... 12
Figure 2.2: DNA microarray ... 16
Figure 3.1: Radial Basis Function Neural-Fuzzy Modelling structure ... 36
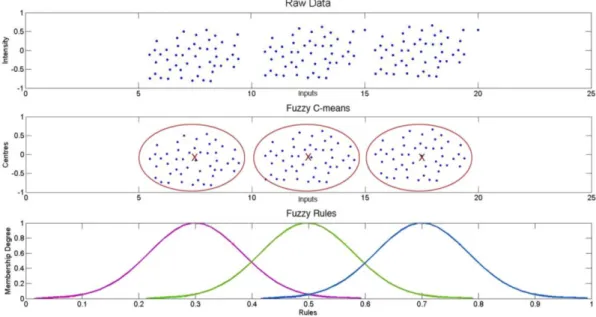
Figure 3.2: Data clustering towards ‘information granules’ in the Fuzzy Logic domain ... 41
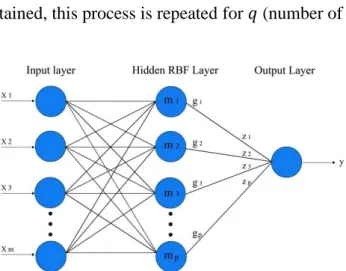
Figure 3.3: RBF Neural-Fuzzy structure ... 45
Figure 3.4: Modelling structure for the prediction of survival in bladder cancer ... 48
Figure 3.5: Example of a RBF-NF rule base, here for simplicity just two rules are shown ... 57
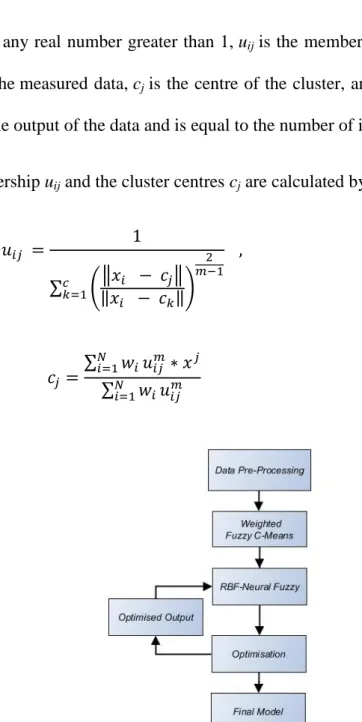
Figure 4.1: Data-mining workflow for the WFCM and RBF-NF model ... 68
Figure 4.2: Flow chart of the processing of the data with weighted FCM and the validation index ... 70
Figure 4.3: Behaviour of the performance for the 3 models. ... 83
Figure 5.1: RBF-NF Modelling Structure ... 89
Figure 5.2: RMSE behaviour ... 94
Figure 5.3: TSK output layer of RBF Linear combination of the inputs and each 𝑍𝑖 weight is directly linked to 𝑔𝑖 rule. ... 95
Figure 5.4: Fuzzy Entropy Feature Selection ... 96
Figure 5.5: Example of the behaviour of the Output weights of 5 Genes in Rule 3. ... 98
Figure 5.6: Example of a RBF-NF rule base, here for simplicity just two rules are shown, one for a positive outcome and one for a negative. ... 112
Figure 6.1: Boxplot of behaviour of 3 different data sets. From left to right: Blaveri, Sanchez-Carbayo and Kim. ... 123
xi
Figure 6.3: Data integration approach ... 125
Figure 6.4: One hidden-layer Neural Network ... 128
Figure 6.5: Methodology followed for the analysis of the Individual models ... 132
Figure 6.6: Methodology followed for the cross-validation of the models... 133
Figure 6.7: Median adjusted for the three data sets using as reference Sanchez-Carbayo. Distribution from Sanchez-Carbayo data set. ... 145
Figure 6.8: Median adjusted for the three data sets using as reference Sanchez-Carbayo. Distribution from Blaveri data set. ... 145
Figure 6.9: Median adjusted for the three data sets using as reference Sanchez-Carbayo. Distribution from Kim data set. ... 146
Figure 6.10: Quantile discretisation for the three data sets using as reference Sanchez-Carbayo. Distribution from Sanchez-Carbayo Data set data set. ... 148
Figure 6.11: Quantile discretisation for the three data sets using as reference Sanchez-Carbayo. Distribution from Blaveri data set. ... 148
Figure 6.12: Quantile discretisation for the three data sets using as reference Sanchez-Carbayo. Distribution from Kim data set. ... 148
Figure 6.13: Class NED best validation performance ... 149
Figure 6.14: Class DOD best validation performance ... 150
Figure 6.15: Class NED best validation performance ... 151
Figure 6.16: Class DOD best validation performance ... 151
xii
List of tables
Table 3.1: Bladder cancer – microarray gene intensity data sets ... 37
Table 3.2: Encoding of the Survival Outcome ... 38
Table 3.3: Cancer Stage ... 38
Table 3.4: Cancer Grade ... 38
Table 3.5: Interpretation of the Normalised Gene Intensity Range ... 43
Table 3.6: Sanchez-Carbayo performance for Survival ... 50
Table 3.7: Blaveri performance for Survival ... 51
Table 3.8: Kim performance for Survival ... 52
Table 3.9: Performance for Stage... 54
Table 3.10: Performance for Grade ... 55
Table 3.11:Performance of Survival using microarray data. For comparison purposed the results in this example are shown as the area under the curve (AUC) of a ROC plot ... 58
Table 3.12: Comparison of results from the prediction of Stage to existing publications in the literature ... 59
Table 3.13: Comparison of results from the prediction of Grade to existing publications in the literature (Accuracy) ... 59
Table 4.1: Performance of the model using 25 inputs and 5 rules ... 72
Table 4.2: Gene Signature for Bladder Cancer Survival in Sanchez-Carbayo Data Set 73 Table 4.3: Performance of the model using 50 inputs and 5 rules ... 74
Table 4.4: Gene Signature for Bladder Cancer Survival in Sanchez-Carbayo Data Set 75 Table 4.5:Performance of the model using 100 inputs and 5 rules ... 76
Table 4.6: Gene Signature for Bladder Cancer Survival in Sanchez-Carbayo Data Set 77 Table 4.7:Performance of the model using 300 inputs and 5 rules ... 79
xiii
Table 4.8: Performance of the model using 500 inputs and 5 rules ... 80
Table 4.9: Performance of the model using 1000 inputs and 5 rules ... 81
Table 4.10: Performance of the model using 2000 inputs and 5 rules ... 81
Table 4.11: Performance of the model using 5000 inputs and 5 rules ... 82
Table 5.1: Gene Signature for Bladder Cancer Stage in Sanchez-Carbayo Data Set .. 101
Table 5.2: Prediction of Stage using 5 rules and 25 inputs ... 102
Table 5.3: Gene Signature for Bladder Cancer Grade in Sanchez-Carbayo Data Set .. 103
Table 5.4: Prediction of Grade using 5 rules and 25 inputs ... 104
Table 5.5: Prediction of Survival using Stage Only ... 105
Table 5.6: Prediction of Survival using Grade Only ... 106
Table 5.7: Prediction of Survival using Stage and Grade Only ... 106
Table 5.8: Survival Prediction using Microarray Data, 5 rules and 25 inputs ... 108
Table 5.9: Gene Signature for Bladder Cancer Survival in Sanchez-Carbayo Data Set ... 110
Table 5.10: Prediction of Survival using Stage, Grade and Microarray data, 5 rules and 25 inputs ... 111
Table 5.11: Comparison of results from the prediction of Stage to existing publications in the literature ... 114
Table 5.12: Comparison of results from the prediction of Stage to the results shown in Chapter 3 ... 115
Table 5.13: Comparison of results from the prediction of Grade to existing publications in the literature (Accuracy) ... 115
Table 5.14: Comparison of results from the prediction of Grade to the results shown in Chapter 3 ... 115
xiv
Table 5.16: Performance of Survival (Accuracy) using Stage, Grade and microarray data as inputs ... 117 Table 5.17: Performance of Survival using Stage, Grade and microarray data as inputs. For comparison purposed the results in this example are shown as the area under the curve (AUC) of a ROC plot ... 118 Table 5.18: Performance (AUC) of Survival using Stage, Grade and microarray data as inputs ... 118 Table 6.1: Top Genes for the prediction blader cancer’s survival from Sanchez-Carbato, Blaveri and Kim ... 130 Table 6.2: Gene Signature for Bladder Cancer Survival in Sanchez-Carbayo Data Set ... 135 Table 6.3: Prediction of Survival using 5 rules and 25 inputs with Sanchez-Carbayo’s Top 25 Inputs ... 136 Table 6.4: Gene Signature for Bladder Cancer Survival in Blaveri Data Set ... 137 Table 6.5: Prediction of Survival using 5 rules and 25 inputs with Blaveri’s Top 25 Inputs ... 138 Table 6.6: Gene Signature for Bladder Cancer Survival in Kim Data Set ... 139 Table 6.7: Prediction of Survival using 5 rules and 25 inputs with Kim’s Top 25 Inputs ... 140 Table 6.8: Top Global Genes List ... 141 Table 6.9: Prediction of Survival using 5 rules and 25 inputs with Top Global Gene List ... 142 Table 6.10: Prediction of Survival using 5 rules and 25 inputs with Sanchez-Carbayo’s Top 25 Inputs ... 143 Table 6.11: Prediction of Survival using 5 rules and 25 inputs with Sanchez-Carbayo’s Top 25 Inputs Cross validated with Blaveri as Testing ... 143
xv
Table 6.12: Prediction of Survival using 5 rules and 25 inputs with Sanchez-Carbayo’s Top 25 Inputs Cross validated with Kim as Testing ... 144 Table 6.13: Prediction of Survival using 5 rules and 25 inputs with Sanchez-Carbayo’s Top 25 Inputs with Data Integration Cross-validated with Blaveri ... 144 Table 6.14: Prediction of Survival using 5 rules and 25 inputs with Sanchez-Carbayo’s Top 25 Inputs with Data Integration Cross-validated with Kim ... 145 Table 6.15: Prediction of Survival using 5 rules and 25 inputs with Sanchez-Carbayo’s Top 25 Inputs with Data Integration ... 147 Table 6.16: Prediction of Survival using 5 rules and 25 inputs with Sanchez-Carbayo’s Top 25 Inputs with Data Integration Cross-validated with Blaveri ... 147 Table 6.17: Prediction of Survival using 5 rules and 25 inputs with Sanchez-Carbayo’s Top 25 Inputs with Data Integration Cross-validated with Kim ... 147 Table 6.18: Prediction of Survival using 5 rules and 25 inputs with Sanchez-Carbayo’s Top 25 Inputs with Data Integration Cross-validated with Blaveri ... 149 Table 6.19: Prediction of Survival using 5 rules and 25 inputs with Sanchez-Carbayo’s Top 25 Inputs with Data Integration Cross-validated with Kim ... 150 Table 6.20: Comparison of results between RBF-NF models with 5 rules and 25 inputs ... 152
Chapter 1:
Motivation
and thesis overview
The healthcare professionals community (medical, biology, chemistry, and engineering) have improved gradually the quality and length of life. It is expected that in developed countries, by year 2020 the female life expectancy will be of around 90 years, however the male life expectancy is not expected to have a considerable life expectancy increase [1]. New vaccinations and novel treatments have been developed for diseases years ago where not possible to treat or cure. These advances in medicine led to a decrease in the mortality rate in many countries. However, it can be said that several diseases are still the focus of research. For example, tobacco-related diseases, which include: respiratory diseases, circulatory diseases and several types of cancer [1].
In healthcare, it is accepted that: “If we live long enough, at certain point of our lives we would develop some type of cancer” [2]. This is why cancer research is of paramount importance, if a cure is found quality and length of life for the patients could be improved. Cancer analysis used to be an area of research destined only for clinicians but as the new technologies emerged and the amount of information increased meteorically, Systems Engineering was required to analyse all of this information. The research presented in this thesis is based on the study of microarray bladder cancer data. Bladder cancer is a highly recursive type of cancer and that it is challenging to treat. The classification of the tumour’s behaviour is a crucial point, particularly at the early stage of the cancer when clinicians try to decide which treatment strategy to follow.
Chapter 1: Motivation and Thesis Overview 2 This early categorisation of cancer aggressiveness not only helps the patient avoid unnecessary treatment but will also allow substantial cost savings. The focus of this research is to produce a data-driven computational model that identifies the genes (feature selection) significant to the prediction of stage, grade, and survival of bladder cancer while maintaining simplicity, transparency and accuracy.
1.1 Background and Motivation
Bladder cancer is a type of cancer that is extremely recursive, and depending on the type it can affect the patient’s life even after being cured [3]. From a medical point of view, there are two types of cancer according to the evolution of the tumour: aggressive tumours (tumours of poor prognosis and resistant to conventional treatments) and non-aggressive tumours (tumours that respond well to conventional treatment and with good prognosis). However, currently there are no biological markers or reliable parameters to categorise the two types of the disease.
Biology methods based on the analysis of clinical history and biopsies studies are the only routine tools for identification and confirmation of the stage of the disease. From a molecular level since a few years ago genetic profiles and possible markers have been studied. These markers may help us discover the cause and development of the disease; however research is on-going in this area.
Existing analytical techniques, predictive methodologies (regression, prognostic nomograms) and statistical data analysis methods struggle to cope with the inherited noise and uncertainty associated with this type of clinical data therefore yielding average prediction results [4, 5].
In recent years, new techniques have been developed and the study of genetic markers has become more common, however the research is ongoing in this area as at the moment there is still no irrefutable list of genetic markers related to bladder cancer [4-12]. The main prognostic tools are based on histologic stage and grade, and as explained before these tools have their drawbacks. It is logical to assume that there is a research gap, and this is where Systems Engineering may be able to contribute and improve the diagnosis methods via the analysis of both clinical data sets and gene data, in order to find suitable markers that predict cancer stage, grade and survival. The Systems Engineering’s aim is to achieve a correct diagnosis, which will lead to the optimisation of the patient’s therapy.
For certain cancer types the clinicians perform a number of tests to diagnose the patient. This involves clinical data, chemical tests, and medical examinations and more recently there is interest to investigate gene expression data. Unfortunately, these tests/data are not very well understood. This is where systems engineering and data-driven modelling come in. If hybrid models are built from the test data along with behaviour from cancer biopsies and gene expression data, the understanding of how these tests relate to cancer prediction could be improved, and a treatment therapy could be informed; part of this study is focused on the analysis of microarray data. Microarray is a new technique to analyse tissue samples, and this will be explained in detail in the Chapter 2. Microarray data analysis has opened new possibilities for diagnosis and treatment of numerous diseases, including cancer; however microarray data comes with its limitations. For example, high-dimensionality, low sample size, noisy, missing data and the necessity of applying feature selection methods to identify relevant markers. The diagnosis of numerous malignancies has been improved by the use of microarrays.
Chapter 1: Motivation and Thesis Overview 4 For this reason, the search for a robust classifier for the tumours’ categorisation and feature selection algorithm has been intensive.
1.2 Research Objectives and Contributions
One of the biggest challenges in bladder cancer prediction is the accurate and early classification; in recent years microarray technologies and related research have helped with this task with feature selection and systems engineering models. Current clinical diagnostic methods are not definitive enough; to date the search for conclusive markers to lead to a precise classification is still ongoing [9, 13, 14].
The main challenges that microarray studies run across are the thousands of genes combined with a small number of samples (patients) and the uncertainty of raw data due to measurement process and variation in the technology. This presents a challenging Systems Engineering classification and identification problem (high dimensionality, low number of samples). To tackle the challenge of high number of features, feature selection algorithms have become indispensable components of the data mining process [15].
The objectives of this research are to:
1. Introduce a Radial-Basis-Function Neural-Fuzzy modelling structure for the analysis of noisy high dimensional low sample size data; the main characteristics of the model are transparency and simplicity.
2. Investigate the scaling-up performance of Radial Basis Function Neural-Fuzzy models using a standard PC and a High Performance Computing (HPC) server. The aim of the research is to find the limit for the maximum number of inputs to use in the model while maintaining low computational complexity and high accuracy.
3. Introduce a new model-based iterative method for feature selection that directly links the relative contribution of each feature to the system’s performance. 4. Improve the generalisation performance in microarray bladder cancer data 5. Maintain simplicity, transparency and accuracy.
The main novelty of this research relies on producing models that are accurate, simpler, interpretable, with good generalisation performance (robust) and easier to develop and to be used by non-experts given their simplicity and transparency.
A Neural-Fuzzy algorithm was chosen because it possesses the learning abilities of Neural-Networks, the interpretability of Fuzzy logic and can model non-linearity. Furthermore, Neural-Fuzzy models require less data than Neural-Networks [16]. Apart from the previously mentioned characteristics, Neural-Fuzzy models already proved to make accurate bladder cancer classification [7, 16-19]. Compared to Neural-Networks, Support Vector Machines (SVM) or Logistic Regression, Neural-Fuzzy models deliver comparable or improved accuracy in classification with the advantage of being more interpretable [17]. A drawback of Neural-Fuzzy models is that they encounter problems when the dimensionality is relatively high [20].
In this thesis, the following research contributions have been made:
1. Reduction in the complexity of the model: number of inputs of the model (features) and linguistic statements to describe the model (fuzzy rules).
2. An enhanced rule-base extraction framework is proposed to improve the model’s performance for high-dimensional low sample size data (microarray data). With the enhanced rule-base, the scaling-up performance of Radial Basis Function (RBF) Neural-Fuzzy models was improved.
Chapter 1: Motivation and Thesis Overview 6 3. For the first time, a Neural-Fuzzy model (Radial-Basis-Function with a TSK
output) was applied to microarray bladder cancer data to make a feature selection in the training phase (embedded feature selection): the aim of the iterative feature selection method is to use a measure of uncertainty (fuzzy entropy) to select relevant features during the model-training phase, whilst maintaining the system’s simplicity and interpretability and taking into account the interactions between the genes.
4. The inclusion of the cancer stage and grade as extra features of the predictive model is evaluated, thus producing a hybrid gene-clinical data model.
5. Improve the generalisation performance in microarray bladder cancer data: two different data integration approaches were presented for the first time: median adjust and NN mapping of input-output. The results obtained prove that the data integration methods for cross validation of the models helps to have a considerable increase in the performance.
Considering the aforementioned objectives and contributions, and the impact of this disease in the society, the research work described in this thesis is underpinning for the development of new methods of diagnosis and prediction of the behaviour of bladder cancer.
1.2.1 Publications:
Each publication is linked to a Chapter and objective within the thesis and study respectively, for example:
Chapter 3 is linked to publications 1 and 4 and objectives 1 and 5. Chapter 4 is linked to publications 2 and 2b and objective 2.
Chapter 5 is linked to publications 1, 3 and 4 and objectives 1,3 and 5 Chapter 6 is linked to objective 4 and 5.
Peer reviewed Journal and Conference Publications
[1] J. De Alejandro Montalvo, G. Panoutsos, M. Mahfouf and J. W. Catto, Radial-Basis-Function Neural-Fuzzy model for microarray signature identification, BIOSIGNALS 2013 - Proceedings of the 4th International Conference on Bioinformatics Models, Methods and Algorithms, Barcelona, Spain 11-14 February, (2013)
[2] J. De Alejandro Montalvo, G. Panoutsos, M. Mahfouf and J. W. Catto, High dimensionality and scaling-up performance of RBF models with application to healthcare informatics, 2014 5th International Conference on Computer and Computational Intelligence, Paris, France, 6-7 December, (2014).
[2b] J. De Alejandro Montalvo, G. Panoutsos, M. Mahfouf and J. W. Catto, High dimensionality and scaling-up performance of RBF models with application to healthcare informatics, International Journal of Machine Intelligence and Computing (IJMLC) (post-conference volume-invited).
Invited/Peer reviewed workshops and seminars
[3] Microarray model-based gene signature identification for the accurate prediction of survival in bladder cancer, University of Sheffield- INSIGNEO Institute for In-silico Medicine Showcase, Sheffield, UK (2014).
[4] Human-Centric Approaches for Modelling Complex Systems’, University of Sheffield Engineering Symposium - USES 2013, Sheffield, UK (2013)
Chapter 1: Motivation and Thesis Overview 8 1.3 Thesis Outline
The rest of this thesis is organised as follows:
Chapter 2: definition of cancer, microarrays and a brief literature review is presented. Previous methods used for microarray data analysis, either for feature selection or cancer classification are also covered in this Chapter.
Chapter 3: This Chapter introduces a Radial-Basis-Function Neural-Fuzzy modelling structure, aiming to maintain simplicity and transparency in the form of a linguistic Fuzzy-Logic rule-base. The proposed methodology is validated by selecting a signature for the identification of the stage, grade and survival of bladder cancer. The signature selection and predictive modelling results are compared to previous research work on the same dataset, showing that the RBF-NF model outperforms the previous modelling attempts by achieving high predictive accuracy (>80% on average).
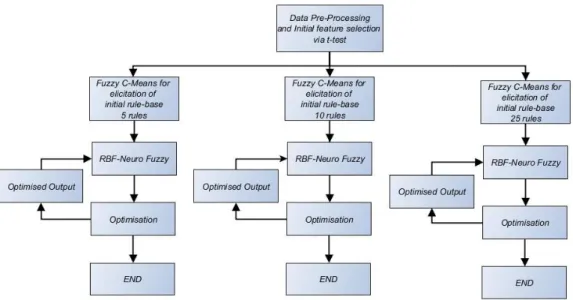
Chapter 4: the scaling-up performance of Radial Basis Function Neural-Fuzzy models is investigated. Based on the findings, an enhanced rule-base extraction framework is proposed to improve the model’s performance for high-dimensional low sample size data. To overcome the challenges present when high dimensional data is used, a Weighted Fuzzy C-means (WFCM) algorithm for the analysis of high-dimensional low sample size data is introduced. A second contribution of this chapter is a cluster optimisation algorithm based on the Xie-Beni cluster validity index to improve the quality of the initial clusters (rule-base) calculated by the WFCM. Via the proposed framework the scaling-up performance of RBF Neural-Fuzzy models is enhanced, hence the predictive modelling framework can be used without the use of filter-based feature selection methods. The aim is to find the rational limit for the maximum number
of useful inputs (genes) to use in the model while still maintaining low computational complexity and high accuracy.
Chapter 5: In this chapter, a new model-based iterative method for feature selection based on fuzzy entropy measures is introduced. The presented approach is based on a Radial Basis Function – Neural-Fuzzy which is designed to be equivalent to a Fuzzy Logic TSK-based system. A fuzzy entropy measure is used to directly link the relative contribution of each feature to the system’s performance. An iterative algorithm is then used to identify the most relevant features of the process under investigation; the modelling-feature selection is performed in one iterative process. In predicting the patients’ survival as a result of their bladder cancer gene signature, the inclusion of the cancer stage and grade as extra features of the predictive model is evaluated, thus producing a hybrid gene-clinical data model. The simulation results confirm that the new approach outperforms existing predictive models in the literature for bladder cancer survival based on gene signature only; the additional novelty of the presented approach relies on the added benefit of producing models that are simpler (considerably less genes in the signature), interpretable, with good generalisation performance and easier to develop and use by non-experts due to the absence of complex pre-processing which is common in this field.
Chapter 6: In this Chapter, the generalisation performance of the developed models is investigated. The approach studied in this chapter is to cross-validate distinct microarray data by applying data integration techniques. Three different data integration approaches were analysed: quantile discretisation, median adjust and NN mapping of input-output. The latter two approaches are introduced for the first time to a bladder cancer classification algorithm. The results obtained
Chapter 1: Motivation and Thesis Overview 10 demonstrate that the data integration methods for cross validation of the models helps to have a significant increase in the performance.
Chapter 7: Conclusions and future research directions: the conclusions of the thesis and the direction for future research. This covers performance summarisation of the presented work and research proposals towards multi-cohort modelling approaches.
Chapter 2:
Microarray
technologies and
data-driven modelling for
cancer
Case Study on Bladder Cancer; definition of cancer, microarrays and a brief literature review is presented. This Chapter also presents previous methods used for microarray data analysis, either for feature selection or cancer classification.
2.1 Cancer Overview
In order to assess the complexity of the problem of cancer and cancer research in the world a brief literature review is presented here. There are more than 200 types of cancer and millions of new cases of cancer are recorded each year [21-24]. According to [23], the most common cancers occurring in the UK are:
Female breast Lung Prostate Cancer Bowel Malignant Melanoma Non-Hodgkin Lymphoma Bladder
Chapter 2: Microarray technologies and data-driven modelling for cancer 12 As stated in [23], “More than 331000 people were diagnosed with cancer in the UK in 2011. More than 1 in 3 people in the UK will develop some type of cancer during their lifetime”.
For the UK, the survival rates for cancer have increased considerably in the last decades; nevertheless cancer is the cause of more than 25% of all deaths [23].
2.2 Bladder Cancer
Bladder cancer is the 11th most common type of cancer in the world [21, 25]. In the UK, is the 7th most common type of cancer [21, 23].
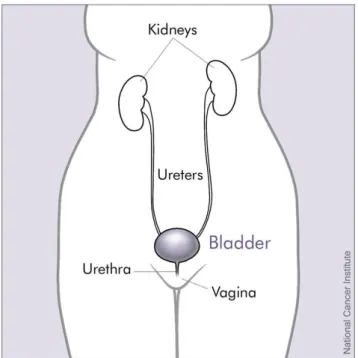
The bladder is an organ (Figure 2.1) [26] that stores urine and it is located in the abdomen, the majority of the bladder cancer forms in the tissues of the bladder.
Figure 2.1: Bladder and nearby organs
The risk factors linked to bladder cancer are [27, 28]:
Age
Cancer therapies Ethnicity
Cancer occurs when something goes wrong with the cell reproduction and the cells do not die but instead they continue reproducing. If those cells are not dying and new cells are reproducing, eventually a tumour may form [23]. The correct classification of future tumour behaviour is one of the biggest challenges in cancer. Whilst it is crucial to avoid unnecessary treatment for indolent tumours, delays in radical intervention for aggressive disease lead to worsening survival and quality of life [29-31]. The prediction of outcome is best performed using pathological stage, grade and various other histological and clinical parameters.
The cancer Stage encoding is based on the staging system that uses numbers to indicate the stage of the cancer, this is defined as follows:
“Stage 0a, there is a small area of cancer only in the bladder lining.
Stage 0, the cancer cells are confined to the inside layer of the lining of the bladder.
Stage 1, the cancer has grown into the layer of connective tissue beneath the bladder lining.
Stage 2, the cancer has grown into the muscle of the bladder wall under the connective tissue layer.
Stage 3, the cancer has grown through the muscle of the bladder and into the fat layer surrounding it. It may have spread to other organs.
Stage 4, the cancer has spread to the wall of the abdomen or pelvis, the lymph nodes or to other parts of the body” [32].
Chapter 2: Microarray technologies and data-driven modelling for cancer 14 Similar to the encoding applied to the previous model for the prediction of stage; three grades are used to rate cancer. The Grading of bladder cancer tumours is defined according to:
Grade 1 or low-grade cancer
Grade 2 or moderate/intermediate grade
Grade 3 or high-grade cancer[22].
The risk of disease-progression, as well as the frequent reoccurrences, require extensive clinical monitoring of bladder cancer patients, making this disease one of the most expensive to manage [33]. One of the challenges in the screening of cancer is the search for markers that identify tumour of aggressive and non-aggressive behaviour. This is a crucial point, especially at the early stage of the cancer when clinicians try to decide which treatment strategy to follow. This early categorisation of cancer aggressiveness not only helps the patient avoid unnecessary treatment (often avoiding serious side-effects) but will also allow substantial cost savings.
There is a high lifetime cost on patients with superficial tumours. Removing the bladder can treat the disease, but it may result in various complications that the person has to live with for the rest of their life [28] . Current clinical diagnostic methods are not definitive enough; at this time there are no determinant markers to do a precise detection. Biology methods based on the analysis of clinical history and biopsies studies are the only routine tools for identification and confirmation of the stage of the disease. From a molecular level since a few years ago genetic profiles and possible markers have been studied. These markers may help discover the cause and development of the disease; however research is on-going in this area. Limitations in the accuracy of clinical diagnostic methods have led to the search for more robust biomarkers such as
those derived from gene expression data [7, 34, 35]. In recent years microarray technologies and related research help with the task of making an accurate and early classification of the cancer and with the identification of clinically relevant genes.
2.3 Microarray Analysis
Microarray is a technique to analyse tissue samples. Microarrays make possible the analysis of thousands of genes simultaneously; since thousands of genes are analysed, the data generated from each microarray is enormous. This literature review will focus on giving the basic concepts of microarray and explain what the data represents.
The present section is divided into 3 sub-sections:
1. Microarray Basic concepts.
2. Representation and extraction of information
3. Analysis of Gene Expression Data; different methods for the analysis of microarrays, from statistical to soft computing.
2.3.1 Microarrays Basic Concepts:
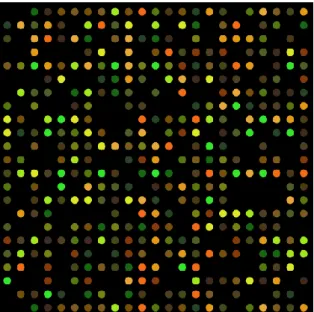
Deoxyribonucleic acid (DNA) microarrays are a technology to simultaneously monitor the expression levels for thousands of genes [36]. The process of transcription of genes into messenger Ribonucleic acid (mRNA) and subsequent conversion to form proteins is called Gene expression [36]. DNA microarrays are used to identify disease biomarkers in many applications, for example: in neurological diseases, Alzheimer, multiple sclerosis, diabetes [37, 38]. As shown in Figure 2.2 [39], DNA microarrays are solid supports where gene sequences are immobilised [38].
Chapter 2: Microarray technologies and data-driven modelling for cancer 16
Figure 2.2: DNA microarray
In a microarray, the gene sequences must be attached to their support in a permanent way, since scientists use the position of each spot in the array to detect a gene sequence [38]. The entire process is based on hybridisation probing, defined in [40] as: “a technique that uses fluorescently labelled nucleic acid molecules to identify complementary molecules and sequences that are able to base-pair with one another.”
Once the hybridisation is complete, a ‘scanner’ will examine the microarray. A laser stimulates the fluorescent tags, and the scanner produces a digital image of the array. The image is stored and, as explained in Section 2.3.2, is subsequently analysed.
2.3.2 Representation and Extraction of Information
i. Image Processing and analysis
As mentioned in section 2.3.1, the expression level for each gene can be stored as an image. The processing of the image is the initial step in the analysis of microarray data.
Image processing involves:
Identification of the spots
Determination of the area to be analysed Assigning the spot intensity [41].
After the image processing and analysis, normalisation is necessary to adjust for any bias that arises from differences in the microarray process [38, 41].
ii. Gene Expression Data Matrices
As stated in [41], there are several representations for the measurements of microarray data:
Absolute; the expression level of the gene is represented in abstract units. Relative; the gene expression of a gene in abstract units is normalised with
respect to its expression in a reference.
Log2; the gene expression values are converted to log2 to eliminate the high variations between the gene’s intensities.
Discrete; the gene expression values are converted to discrete numbers.
Microarray data can be also seen as a vector, where the gene expressions are represented in a vector space [41].
2.4 Feature selection methods applied to microarray
One of the biggest challenges in cancer is the correct classification of future tumour behaviour and it may be achieved via a number of information sources, including clinical and radiological data and potentially, biochemical or molecular tests. However, limitations in the accuracy of these data have led to the search for more robust
Chapter 2: Microarray technologies and data-driven modelling for cancer 18 biomarkers such as gene expression data. In recent years microarray technologies and related research help with this task. A reliable predictor capable of an accurate assessment at an early stage of the cancer will undoubtedly avoid unnecessary treatment, save costs and in general would improve the patients’ quality of life.
Current clinical diagnostic methods are not definitive enough; to date the search for the conclusive markers to lead to a precise classification is still ongoing [9, 13, 14].
The main challenges that these types of studies run across are a) the high dimensionality, translated into tens of thousands of genes combined with a small number of samples (patients) and b) uncertainty of the raw data due to measurement process and variation in the technology. This presents a challenging Systems Engineering classification and identification problem (high dimensionality, low number of samples). To tackle the challenge of high number of features, feature selection algorithms have become indispensable components of the data mining process [15]. The objective of feature selection is to improve the performance of the predictor, provide faster and more computationally inexpensive predictor. There are numerous benefits of feature selection: simplifying data understanding, decreasing the computational complexity, and most importantly decreasing training times [42]. There are three categories for feature selection: filters (typically applied as a pre-processing step), wrappers (optimise a classifier as part of the feature selection procedure) and embedded methods (perform feature selection in the process of training). The goal of this literature review is to offer an analysis of the current feature selection methods applied to microarray data (high dimensional low sample size).
2.4.1 Filter Methods
Filter methods evaluate the correctness of the proposed feature subset by analysing the relation of each gene with the class by the calculation of basic statistics [43, 44]. Filter approaches are the most used feature selection method in microarray literature for gene selection [36, 45].
Filter methods rank the features depending on a score: then, the features with the highest score are chosen and applied as inputs for the classifier [44]. Filter feature selection methods can be separated in two categories: multivariate and univariate. Multivariate methods consider, to some extent, the dependencies between the features; on the contrary, univariate filter methods consider each feature individually [43, 44]. The costs of considering the dependency is being slower, loose some scalability while at the same time still not has interaction with the classifier [24].
i. Univariate Filter Feature selection Methods
The majority of the filter methods belong to the univariate category. The advantages of Univariate filter feature selection methods are that they are fast, scalable and independent from the classifier [24]. The disadvantages of using univariate feature selection methods are that they ignore feature dependencies and lack interaction with the classifier [24]. Some of the most common examples of univariate filter feature selection methods are t-test [46], ANNOVA [46], Information Gain [47].
ii. Multivariate Filter Feature selection Methods
Examples of filter methods applying correlation for feature selection are the Correlation-Based feature selection (CFS) [48] and the fast correlation-based filter method [49].
Chapter 2: Microarray technologies and data-driven modelling for cancer 20 In [48], the method selects the feature (genes) subsets based on correlation or dependence. The method’s objective is to select subsets of genes that show a high correlation with the class but no correlation between the genes. The CFS method reports results (breast cancer) comparable or better than wrapper approaches, with the benefit of being faster.
In [49], the filter method is based on measuring the ‘predominant correlation’, identifying the features relevant to the class and minimising the redundancy between the selected features. The method is applied to lung cancer, reporting high classification results.
Numerous multivariate filter feature selection approaches [50-53] have been applied to microarray analysis, reporting similar or improved results compared to more specialised methods.
iii. Recent approaches
Recent approaches [54, 55] are considering applying discretisation followed by a filter feature selection algorithm. The authors report an increase in the classification accuracy and the complexity of the model (applied to prostate cancer).
The benefits of using filter techniques are that they can be applied without difficulty to high-dimensional datasets (microarray data); they are computationally inexpensive and fast [24]. A drawback of filter methods is that most techniques consider each feature separately, ignoring feature dependencies, and that they do not interact with the classifier [44]. This could result in an inferior performance of the classifier when compared to more complex methods [44].
2.4.2 Feature Selection: Wrapper Methods
Wrapper feature selection methods optimise a predictor as part of the selection procedure; their computational complexity is high because it grows with the number of features [24]. Consequently, wrapper feature selection approaches have been avoided in recent years. In wrapper feature selection methods, several subsets are produced and assessed [24]. The assessment of each subset is achieved by training and testing each classification model [43]. Wrapper feature selection approaches are popular in machine learning, however due to its large computational cost they are not popular in microarray analysis [43].
Most of the work applying wrapper methods was done in the early years of microarray analysis, and that wrapper methods have not evolve as the same speed as filter or embedded feature selection methods [44]. Despite their high computational cost, several authors [56, 57] state that they have better predictive accuracy.
In [58], the authors evaluate widely applied wrapper feature selection algorithms finding that by using these algorithms the accuracy is improved and the number of genes of the classification model is considerably reduced in size.
In [59], the authors introduce a procedure named successive feature selection. The proposed algorithm consists on separating the genes into subsets (of size s), and subsequently selecting smaller subsets (of size bs) containing the best genes from each subset (of size bs<s) based on their classification accuracy. Afterwards, all the selected genes are merged to obtain the ‘top genes subset’.
Chapter 2: Microarray technologies and data-driven modelling for cancer 22 2.4.3 Embedded Methods
Embedded methods perform feature selection in the process of training the classifier [44]. Similar to wrapper methods, embedded methods also have interaction with the classifier, which increase the computational complexity. However, compared to wrapper methods, the computational complexity is smaller. Embedded methods can be seen as an intermediate solution for feature selection with less computational burden than wrapper methods but higher computational burden than filter methods, without being independent from the classifier [44].
Perhaps the most applied embedded method is a SVM using Recursive Feature Elimination (SVM-RFE) [60]. SVM-RFE is a weighted-based method that trains a SVM with a set of genes and eliminates the genes that are not significant to the solution based on a feature ranking criteria. However, as reported by [44] in their study for breast and cancer prediction, the SVM-RFE achieves comparable or inferior classification accuracy compared to simpler feature selection techniques.
A different SVM approach presented in [61], consists of simultaneously determining a classifier with good classification performance and an small number of features by ‘penalising’ the usefulness of each feature in the elicitation of the model. The approach selects the relevant features according to the width of a Gaussian function, where a small width represents that a feature is important.
2.5 Feature selection methods in high dimensional low sample size data
Although microarray data can be considered as the most representative and complex case of high dimensional data low sample size data (HDLSS), it must not be overlooked that in many different areas HDLSS data is present. Several publications [24, 43, 44, 51, 58, 62-64] have reviewed feature selection algorithms in different areas, for example: image processing, text recognition, financial data, and climate data.
As stated in, [24], the analysis of HDLSS has evolved simultaneously for all the different areas. All the areas come to an agreement that the limitations of the study must be defined: filter feature selection methods are faster but they do not take into account the interactions between the features, wrapper methods consider the interactions but the computational complexity and the necessary time for the calculations augments exponentially, embedded methods suffer from computational high complexity (smaller than wrapper methods but still considerable).
For microarray gene expression feature selection, the interaction of the features
is of paramount importance; moreover a low complexity is desirable to work closer with clinicians. Nevertheless, it is essential not to fail to recall that feature selection is half of the necessary work for making a correct classification. Typically, feature selection is done and subsequently a much smaller subset of features is analysed to make the classification. In section 2.6: Machine-learning models for microarray cancer classification, an overview of the most important methods for cancer classifications is presented.
Chapter 2: Microarray technologies and data-driven modelling for cancer 24 2.6 Machine learning models for microarrayCancer Classification
It is stated previously that the classification of microarray gene expression data is data dependent; furthermore cancer classification is also dependent on the type of cancer. The most common types of cancer analysed are:
Breast Prostate Lung
While breast cancer may report high accuracies (circa 90-95 of accuracy) for the prediction of survival using machine learning algorithms, bladder cancer (which is one of the least popular and more recursive) report accuracies approximately 65-80% for the prediction of survival.
2.6.1 Computational Intelligence Modelling for Cancer Classification
Computational Intelligence (CI) can be defined as “the study of adaptive mechanisms to enable or facilitate intelligent behaviour in complex problems” [65]. CI algorithms have proven to be popular in the analysis of microarray data because they can detect complex nonlinear associations between the different variables and offer substantial benefits in terms of tolerance to imprecision and system interpretability. Computational Intelligence includes techniques such as Neural Networks (NN), Fuzzy Logic (FL), Neural-Fuzzy Logic, Support Vector Machine and Bayesian Networks. A review of a number of CI techniques applied to bioinformatics is presented in [66].
In, [7, 17, 18], the authors compared different CI approaches for cancer classification and state that traditional analytic methods fail to give accurate results in microarray data applications because this methods assume biological linearity and use
correlation or dependence to find the relationship between a gene and its class. Within CI there is an area of study called Soft computing. Soft computing could be seen as a number of methods so that real problems could be solved in a similar way as humans solve them [67]. This is one of the most important reasons for the use of Soft Computing, to apply the human reasoning to solve a problem and a human understandable explanation of the model.
Soft Computing includes techniques such as Neural Networks, Fuzzy Logic, Neural-Fuzzy Logic, and Support Vector Machine.
i. Fuzzy Logic
Fuzzy Logic is a linguistic method based on a number of rules that describe the system. The transparency of FL and the possibility of easily interpret the results makes it an attractive and effective method for the analysis of gene expression data [68-71].
An important aspect to take into account at the moment of reducing the number of rules is that in fact is important reduce the rules but the most important is to prove that the reduction of rules does not affects the accuracy of the model. The goal is to have a minimum number of rules with the best accuracy of prediction, not one rule per input.
That is the same case with the number of genes; there is a discussion between the effectiveness of using a large or a small number of genes. As stated previously in this chapter, microarray data is composed of thousands of genes so the main purpose is to find the best genes that could lead us to make a good prediction.
Recent research has shown that a small number of genes are enough for accurate prediction of most cancers, nevertheless the number of genes vary between
Chapter 2: Microarray technologies and data-driven modelling for cancer 26 diseases [72]. A large set of gene expression will decrease the classification accuracy due to the curse of dimensionality [73]. In this phenomenon, the classification accuracy decreases as the dimensionality increases.
A list with the advantages of Fuzzy Logic method:
Transparency because of the linguistic rules.
Easy interpretation of the output because of the Low, Low Medium, Medium, Medium High, High states.
Rules explaining the model, making easier to clinicians to understand the model.
Due to the characteristics of microarray data (high dimension and low sample size) Fuzzy logic models (as many other methodologies) struggle to make an accurate classification [68].
ii. Neural Networks
Neural Networks are inspired by how the human brain learns and processes information, they have the capability to solve complex tasks [74]. Their concept simulates the behaviour of a biological neural network [74]. While in humans, learning is done by adjusting the synaptic connections between neurons; in NNs, learning is done by adjusting the weights existing between the processing elements of the network [74].
Neural networks can obtain a good performance with higher learning speed in many applications. However, a high complexity of the network (large number of hidden nodes) translates into a slower response of the trained network [75].
A possible disadvantage of neural networks, especially with microarray data, is overtraining. In overtraining, a model can learn a local solution for each example as opposed to finding a global solution [76].
Neural Networks have been successfully applied to the prediction of cancer [77, 78], but some of the informed disadvantages are that the elicited network is hidden within a ‘black box’, consequently deeming the gain of any insight into the process aspects and into a clinical interpretation [7].
iii. Neural-Fuzzy
The characteristics of Fuzzy Logic and Neural Networks have been discussed in this Chapter; these two methodologies can be combined to form a hybrid Neural-Fuzzy (NF) model. Neural-Neural-Fuzzy models combine the learning ability of Neural Networks and the interpreting ability of Fuzzy systems [72]. The fuzzy logic rules of this type of models can be translated into linguistic statements to allow understanding and interrogation of the model.
Neural-Fuzzy systems, are a popular approach for addressing tolerance to imprecision and system simplicity (interpretability) and is widely used in literature [79-82] and more recently also used for the prediction bladder cancer [7, 16-18]. Neural-Fuzzy systems take advantage of the simplicity and tolerance to imprecision of Neural-Fuzzy Logic structures and the adaptive learning ability of NN while the inclusion of knowledge to the model is still possible. In general, fuzzy set theory [83] has been extensively applied to pattern classification and FL system have been proven to perform well on uncertain information [84-86]. In terms of their simplicity and interpretability, Neural-Fuzzy models allow model knowledge to be represented in the form of just a
Chapter 2: Microarray technologies and data-driven modelling for cancer 28 few simple linguistic rules thus rendering such modelling structures appropriate for systems oriented towards human-reasoning (human-centric systems) e.g. clinical decision support systems [87-89].
iv. Support Vector Machines
The support vector machine was initially created to solve classification problems and has been successfully applied to a number of real world problems. Support Vector Machines has exhibited outstanding performance in classification tasks. SVM aims at searching for a hyper plane that separates the two classes of data with largest margin. SVM is shown to be a good classifier for microarray data [90].
Support Vector Machine is a popular method in microarray analysis because it is possible to deal with data with a large number of features and a small number of samples [91]. One of the drawbacks for this method is the high algorithm complexity and the extensive computing requirements of the large-scale quadratic programming tasks. A second problem often mentioned is the poor interpretability as compared to other methods [92, 93].
v. Bayesian Networks
Bayesian networks (BNs) reflect the random nature of gene expression and use Bayes’ rule [94]. They are also known as probabilistic networks or probabilistic graphical models. The hypothesis in BN is that gene expression values can be defined by random variables that follow probability distributions [94].
Bayesian networks provide a flexible framework for combining expert knowledge into the modelling process [95, 96]. An additional advantage of BNs is that they are good with modelling the randomness and noise associated with microarray
data [97]. Bayesian networks deal with probabilities but the ‘causality’ or factors that generated the solution are also important for the network [97].
Bayesian Networks have also been applied to Cancer Prediction [98-101] in particular in the form of a Bayesian Neural Networks (BNN). Bayesian Networks are modelling structures for expressing multidimensional joint probability distributions. The main challenge in using BNN is the necessity to estimate the topology of a BNN from observations, which is not a trivial problem due to the large amount of uncertainty and high computational complexity even for moderate sizes of networks [98, 102, 103].
2.6.2 Machine learning models specific to microarray bladder cancer Stage, Grade and Survival Classification
Specifically, in bladder cancer prediction with microarray, Statistical regression methods (Logistic Regression, Linear Regression) can estimate the progression rate of a population of tumours with limited accuracy (around 70%) [4, 5, 7]. One of the difficulties of statistical methods is that they do not take into account the interaction between the genes; they are only concerned about linear relations between the input and the output.
Specifically to bladder cancer, there are examples in the literature that demonstrate the use of microarray biomarkers (gene signatures) for the prediction of Stage, Grade, Survival, Recurrence and Progression [7, 17, 18, 35, 104-112]. Lauss [113] and Riester [114] demonstrate the use of a SVM to model and predict bladder cancer progression. In [113, 114], the authors identify the most relevant genes for bladder cancer (feature selection) and subsequently develop a model to predict the Stage, Grade, Progression and Survival. In [113] an average prediction accuracy was
Chapter 2: Microarray technologies and data-driven modelling for cancer 30 reported in the range of 70% to 90%, concluding that signatures with more than 150 genes are needed to obtain robust performance in validation sets.
In [114] it is reported that the simplicity of a predictive modelling structure for bladder cancer survival can be improved by the use of nomograms [115] combined to just 20 genes; however this was achieved at the expense of model accuracy (56% to 75%). Specifically in predicting bladder cancer progression the publications [7, 17-19] report interesting results using a Neural-Fuzzy model that aims to be accurate and transparent, and contrary to the study presented in this thesis, the computational simplicity is not essential.
In this Thesis, the use of a Radial Basis Function Neural-Fuzzy (RBF-NF) structure is proposed to address the challenges of: model simplicity, model generalisation and low computational cost. The proposed approach will consist of an embedded method based on a RBF-NF system. The proposed iterative feature selection method takes advantage of a Fuzzy-entropy measure to select relevant features during the model-training phase, whilst maintaining the system’s simplicity and interpretability. The biggest strengths of the proposed approach are that the feature selection occurs in the training phase, taking into account the interactions and making it recursive. The proposed approach will be applied to identify suitable gene signatures and predict bladder cancer survival.
2.7 Summary
In this Chapter, the extensive use of microarray in the prediction and treatment of several diseases [9, 105, 107, 113, 114, 116-121] has been discussed. For that reason, there is an increasing amount of data sets available in the public domain; the next logical step would be to validate the results from those experiments. Making these
comparisons may help to obtain more valid and reliable results; however, several difficulties might arise due to the differences in technologies, protocols or analysis used to create each data set.
Several approaches had been made in the past years for analysing microarray data. As described before one of the difficulties that microarray analysis has is the large number of genes, the method has to be effective, fast and as transparent as possible. An important feature of this type of systems is that they are effective working with noisy data. Joined to the trend of low number of genes, researchers are also focused on the robustness of the results and for that reason the cross validation of the results has also become of paramount importance. K-fold validation, Leave-one-out cross validation and Distribution optimally balanced stratified cross-validation are among the most used methods to overcome this issue [122].
As stated in [123],the features in a dataset can be categorised into: Relevant: features that help with the classification
Misleading: features that have a negative effect in the classification
Irrelevant: features that do not affect (either negatively or positively) the classification
Redundant: features of a class that has other relevant features.
As stated in [123], “the presence of misleading features will reduce the classification accuracy and, the presence of irrelevant and redundant features will increase the computational burden”.
Chapter 2: Microarray technologies and data-driven modelling for cancer 32 The use of microarrays for cancer classification still represents a great challenge for biologists, clinicians and researchers in general. It must not be forgotten that the amount of information coming from these data is massive and there are still some difficulties when the information is acquired. The biggest challenges to defeat are:
1. There is no standard to make comparable the data obtained from various experiments.
2. The quality of the samples needs to be standardised. 3. Missing values in microarrays
4. Errors and/or noise made in every step of the analysis. From the biologist to the image analysis.
5. The classes are imbalanced
To deal with imbalanced classes bootstrap [124] methods have been used in the literature. Bootstrap refers to resample from the sample data and create an n number of ‘phantom samples’.
What can be improved in bladder cancer classification is to provide sufficient information and description of any activity in a model, in other words, transparency and
simplicity in the model. In the next chapters, a model with main characteristics of transparency and simplicity will be introduced; this human-centric approach aims to work closer with clinicians in order to identify new combination of genes to predict bladder cancer. This transparency and simplicity can be achieved, at a certain degree, via a RBF Neural-Fuzzy model. Nevertheless, it must never be overlooked that the data modelling performance is at the mercy of the quantity and quality of the measurements of the studied data, in this case the microarray data.