University of Huddersfield Repository
Tian, Xiange, Gu, Fengshou, Rehab, Ibrahim, Abdalla, Gaballa and Ball, Andrew
A robust fault detection method of rolling bearings using modulation signal bispectrum analysis
Original Citation
Tian, Xiange, Gu, Fengshou, Rehab, Ibrahim, Abdalla, Gaballa and Ball, Andrew (2015) A robust
fault detection method of rolling bearings using modulation signal bispectrum analysis. In: 28th
International Congress of Condition Monitoring and Diagnostic Engineering Management
(COMADEM 2015), 1st - 4th December 2015, Buenos Aires, Argentina.
This version is available at http://eprints.hud.ac.uk/26687/
The University Repository is a digital collection of the research output of the
University, available on Open Access. Copyright and Moral Rights for the items
on this site are retained by the individual author and/or other copyright owners.
Users may access full items free of charge; copies of full text items generally
can be reproduced, displayed or performed and given to third parties in any
format or medium for personal research or study, educational or not-for-profit
purposes without prior permission or charge, provided:
•
The authors, title and full bibliographic details is credited in any copy;
•
A hyperlink and/or URL is included for the original metadata page; and
•
The content is not changed in any way.
For more information, including our policy and submission procedure, please
contact the Repository Team at: [email protected].
Xiange Tian
a, Fengshou Gu
a,b*, Ibrahim Rehab
a, Gaballa M. Abdalla
a, and Andrew D. Ball
aa Centre for Efficiency and Performance Engineering, University of Huddersfield, Queensgate, Huddersfield, HD1 3DH, UK
bSchool of Mechanical Engineering, Taiyuan University of Technology, Shanxi, China, 030024
Keywords: Modulation signal bispectrum, bearing fault detection, envelope analysis, fast Kurtogram.
1. Introduction
Bearings are at the heart of almost every rotating machine and have received massive attention in the field of vibration analysis as they represent a common source of faults (1). In order to keep machinery operating at its best condition and avoid catastrophic failure, financial cost and personal injuries. Many methods for bearing fault diagnosis have been developed and used to detect the machine faults at an early stage, among which vibration measurement and associated signal processing are the most frequently investigated (2).
For an accurate diagnosis of the bearing fault, a number of techniques have been proposed to separate deterministic fault components from noisy bearing vibration. Darlow explored high frequency resonance technique (HFRT), which is also widely known as envelope analysis (3). Antoni applied cyclostationary spectral analysis to fault detection and diagnosis in rolling element bearings (4, 5). Furthermore, cepstrum analysis, bispectrum analysis and time-frequency analysis are also introduced to bearing fault diagnostic. D. Ho and R.B. Randall investigated the efficient application of self-adaptive noise cancellation (SANC) in conjunction with envelope analysis in order to remove discrete frequency masking in bearing vibration signals (6). Barszcz applied SANC to denoise wind turbines vibration signal for outer race fault diagnosis (7). N. Sawalhi, R. B. Randall and H. Endo presented an algorithm for enhancing the surveillance capability of SK by using the minimum entropy deconvolution (MED) technique. The MED technique effectively deconvolves the effect of the transmission path and clarifies the impulses, even where they are not separated in the original signal (8). S. Zhao applied empirical mode decomposition (EMD) and the Approximate Entropy (ApEn) method for quantitative diagnosis of a spall-like fault of a rolling element bearing (9). Barszcz proposed a new method named protrugram, which is based on the kurtosis of the envelope spectrum amplitudes of the demodulated signal, rather than on the kurtosis of the filtered time signal. The advantage of the method is the ability to detect transients with smaller signal-to-noise ratio (SNR) comparing to the SK based Kurtogram (10).
However, most of the detection schemes presented in the literature mentioned above are based on tracking the variation of the characteristic fault frequency but with limited efforts on the utilization of the modulation characteristics in extracting the diagnostic information. I. Rehab et al applied MSB to extract the fault feature from envelope signals due to its capability to suppress noise for reliable bearing fault severity diagnosis (11). But it still takes envelope analysis as a preliminary step. Therefore, in this paper a MSB detector is developed based on the demodulation characteristics obtained by MSB analysis.
2. MSB detector
Generally, vibration signals from a rolling element bearing with a single-point fault can be expressed as (12)
) ( ) ( ) ( ) ( ) ( ) (t x t x t x t x t n t x = f q bs + s + ... (1)
∗ Corresponding author. Tel.: +44-1484-473548; fax: +44-1484- 473075; e-mail: [email protected]
ABSTRACT- Envelope analysis is a widely used method for bearing fault detection. To obtain high detection accuracy, it is critical to select an optimal narrowband for envelope demodulation. Fast Kurtogram is an effective method for optimal narrowband selection. However, fast Kurtogram is not sufficiently robust because it is very sensitive to random noise and large aperiodic impulses which normally exist in practical application. To achieve the purpose of denoising and frequency band optimization, this paper proposes a new fault detector based on modulation signal bispectrum analysis (MSB) for bearing fault detection. As MSB results highlight the modulation effects by suppressing stationary random noise and discrete aperiodic impulses, the detector developed using high magnitudes of MSB can provide optimal frequency bands for fault detection straightforward. Performance evaluation results using both simulated data and experimental data show that the proposed method produces more effective and robust detection results for different types of bearing faults, compared with optimal envelope analysis using fast Kurtogram.
COMADEM 2015 + X CORENDE
where xf(t) is the impulse produced by the fault, xq(t) is the modulation effect due to the non-uniform load distribution and xbs(t) is the bearing-induced vibrations determined by the bearing structure dynamics,xs(t) is the machinery-induced vibrations determined by the machine structure or other components, and n(t) is the noise which is encountered inevitable in any measurement system. It shows that the fault signatures are from modulation effects between fault signatures, load distribution and structure resonances. Moreover, the signals are also contaminated by noises and different interferences. Therefore, to extract the fault signature effective, the signal must be denoised and demodulated.
MSB has the capability to enhance nonlinear modulation components and suppress random noise by detecting phase coupling in the modulation signal. The definition of MSB can be described by Eq. (2). (13, 14)
) ( ) ( ) ( ) ( ) , ( c x c x c x * c * c MS f f E X f f X f f X f X f B = + − ... (2)
where, fx is modulated frequency; fc is the carrier frequency and fc + fx and fc − fx are modulation frequencies. And the magnitude and phase of MSB can be expressed as Eqs. (3) and (4).
) ( ) ( ) ( ) ( ) , ( c x c x c x * c * c MS f f E X f f X f f X f X f A = + − ... (3) ) ( ) ( ) ( ) ( ) , ( c x c x c x c c MS f f =f f + f +f f − f −f f − f f f ... (4)
It takes into account both fc + fx and fc − fx simultaneously in Eq. (3) for measuring the nonlinear effects of modulation signals. If they are due to the nonlinear effect between fc and fx, there will be a bispectral peak at bifrequency BMS(fc,fx). On the other hand, if these components are not coupled but have random distribution the magnitude of MSB will be close to nil. In this way, it allows the wideband noise in bearing vibration signals to be suppressed effectively so that the discrete components can be obtained more accurately.
To enhance the effect of the small amplitude sidebands, MSB sideband estimator (MSB-SE) (14) was proposed as express in Eq. (5)
(
)
(
) (
) ( ) ( )
( )
+ − = 2 * * , c c c x c x c x c SE MS f X f X f X f f X f f X E f f B ... (5)Based on the MSB property of highlighting modulation effect, a MSB detector can be developed. Firstly, MSB amplitude array is averaged along the fx direction according to Eq. (6) to obtained an average spectrum at different
c f . ∑ = i ij j A N A 1 ... (6)
where i and j is the index of fx and fc respectively. Then, the carrier frequencies which have high amplitudes are selected as the candidates for feature extraction. Finally, the selected fc slices are further averaged to get the MSB detector as expressed by Eq. (7).
∑ = = m k k j ij dt A m MSB 1 1 ... (7)
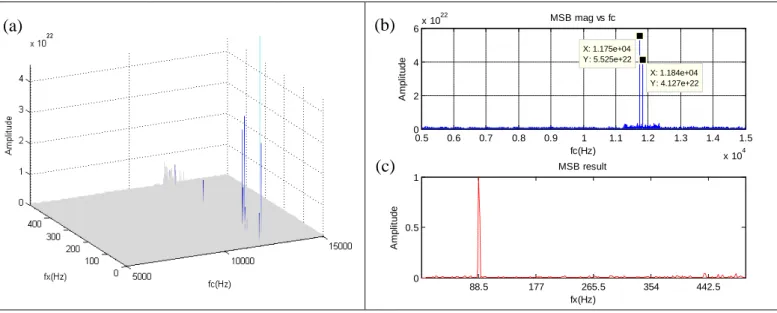
To illustrate the calculation procedure of the MSB detector, a very high SNR signal is used to show the detection using the detector. Figure 1(a) shows the result of MSB of the signal. Several distinctive peaks appear in MSB, indicating that nonlinear modulation phenomena exist significantly between frequency fc and fx in the simulated signal. Then, MSB amplitude is averaged along the fx direction, resulting in the graph in Figure 1(b). And the carrier frequencies which have high amplitudes are selected for feature extraction as marked in the graph. At last, the selected fc slices are averaged to get the MSB detector as shown in the graph of Figure 1(c). From the MSB result, it can be found that the outer race fault frequency of 88.5Hz and its harmonics can be detected by the detector.
Figure 1. MSB of simulated signal and MSB detector result
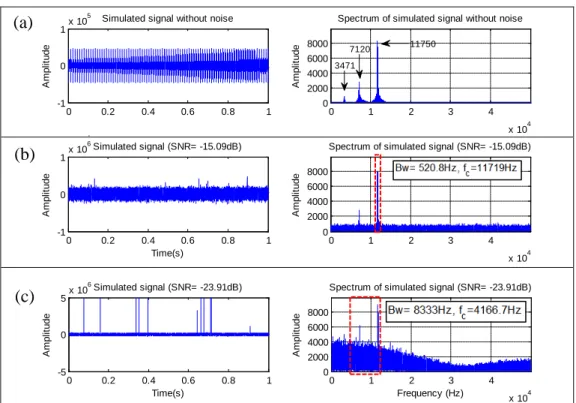
3. Simulation study
The simulated bearing signal with outer race fault and corresponding spectrum are given out in Figure 2(a). The spectrum of simulated signal includes three resonance frequencies at 3471Hz, 7120Hz, and 11750Hz corresponding to inner race, outer race and sensor modes respectively. Figure 2(b) and 2(c) illustrate the time domain signals and spectra for the high and low SNR cases in which the simulated signal are added with two levels of white noise and aperiodic impulsive interferences. It can be seen that in the high SNR signal the lowest resonance frequency is masked by the noise whereas in the low SNR signal the first two resonance frequencies are buried in noise. Due to the high level noise, it is quite difficult to locate the resonance frequency and hence implement accurate fault detection. Both kurtogram envelope analysis and MSB detector are applied to the two signals for fault detection for performance comparison.
The optimised filter bands by Kurtogram are illustrated by dashed rectangular and the parameters are given out in the text box in Figure 2(b) and 2(c). For the high SNR case, the filter locate at the third frequency resonance with a narrow band, while for the low SNR case, the optimised filter locate at lower frequency with a very wide frequency range where too much noise is included.
Figure 3(a) and 3(b) give out the MSB slice optimization results for the two cases. For the high SNR case, the two high resonance frequencies of the simulated signal can be observed. The two high amplitude carrier frequencies are selected to calculate the MSB detector. However, only one resonance frequency can be seen in Figure 3(b). Similarly, the two high amplitude carrier frequencies are selected. Figure 3(c) and 3(d) present the fault detection results comparison of Kurtogram based envelope spectrum and MSB detector. Both Kurtogram based envelope spectrum and MSB detector are effective for high SNR signal. However, for low SNR signal, Kurtogram result could not give out fault indication while MSB detector still can extract the fault frequency. Therefore, it can be concluded that MSB detector outperforms Kurtogram based envelope spectrum in detecting the small modulating components that are contaminated by white noise and aperiodic impulses.
0.5 0.6 0.7 0.8 0.9 1 1.1 1.2 1.3 1.4 1.5 x 10⁴ 0 2 4 6x 10 22 X: 1.175e+04 Y: 5.525e+22 MSB mag vs fc fc(Hz) A m pl it ude X: 1.184e+04 Y: 4.127e+22 88.5 177 265.5 354 442.5 0 0.5 1 MSB result fx(Hz) A m pl it ude
(a)
(b)
(c)
COMADEM 2015 + X CORENDE
Figure 2. Simulated bearing signal with white noise and aperiodic impulses
Figure 3. Fault detection by Kurtogram based envelope spectrum and MSB detector
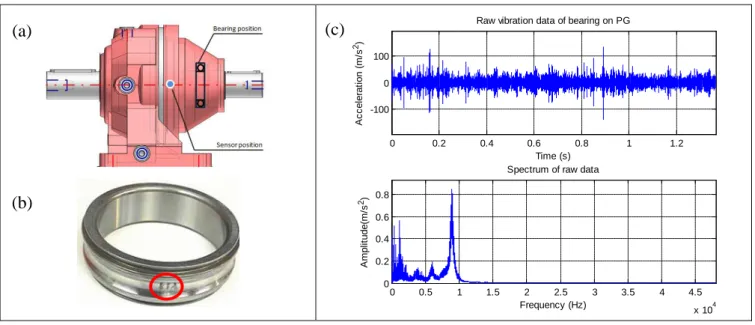
4. Bearing fault in a planetary gearbox
To further verify the effectiveness of MSB detector for low SNR signals, the vibration signal acquired from an in-house planetary gearbox test system is investigated in this paper, in which the bearing components can be contaminated seriously because of the modulations due to multiple gear meshing pairs and planetary motions. The maximum torque of planetary gearbox is 670 Nm, the maximum input speed is 2800 rpm and maximum output speed is 388 rpm. The schematic in Figure 4(a) illustrates the position of the accelerometer that mounted on the outer surface of the ring gear and the location of sun gear under tests. Figure 4(b) shows the size of defect on the inner races.
In the experiment, the planetary gearbox operates at 20% of its full speed under 25% of the full load. The vibration is measured by a general purpose accelerometer with a sensitivity of 31.9 mv/(ms-2) and frequency response ranges
0 0.2 0.4 0.6 0.8 1 -1 0 1x 10 5 A m pl it ude
Simulated signal without noise
0 1 2 3 4 x 10⁴ 0 2000 4000 6000 8000
Spectrum of simulated signal without noise
A m pl it ude 6 3471 7120 11750 0 0.2 0.4 0.6 0.8 1 -1 0 1x 10 6 Time(s) A m pl it ude Simulated signal (SNR= -15.09dB) 0 1 2 3 4 x 10⁴ 0 2000 4000 6000 8000
Spectrum of simulated signal (SNR= -15.09dB)
A m pl it ude 6 0 0 0.2 0.4 0.6 0.8 1 -5 0 5x 10 6 Time(s) A m pl it ude Simulated signal (SNR= -23.91dB) 0 1 2 3 4 x 10⁴ 0 2000 4000 6000 8000
Spectrum of simulated signal (SNR= -23.91dB)
Frequency (Hz) A m pl it ude 2000 4000 6000 8000 10000 12000 14000 0 2 4 6x 10 22 X: 1.175e+04 Y: 5.519e+22 MSB mag vs fc fc(Hz) A m pl it ude X: 1.184e+04 Y: 2.811e+22 2000 4000 6000 8000 10000 12000 14000 0 5 10x 10 22 X: 1.175e+04 Y: 8.006e+22 MSB mag vs fc fc(Hz) A m pl it
ude X: 1.184e+04Y: 4.072e+22
88.5 177 265.5 354 0 0.5 1 fx(Hz) A m pl it ude
Results of Kurtogram and MSB for high SNR (SNR=-15.09dB) By Kurtogram By MSB 88.5 177 265.5 354 0 0.5 1
Results of Kurtogram and MSB for low SNR (SNR= -23.91dB)
fx(Hz) A m pl it ude
(a)
(b)
(c)
(a)
(b)
(c)
(d)
from 1Hz to 10kHz. All the data were logged simultaneously by a multiple-channel, high-speed data acquisition system with 96 kHz sampling rate and 24-bit resolution. This operating condition means that the calculated fault frequency is at 65.68Hz for the inner race fault of the bearing.
Figure 4. Raw vibration data of planetary gearbox and spectrum
Figure 4(c) shows the raw vibration data collected on planetary gearbox and its corresponding spectrum. From MSB analysis, the MSB detector has found that two frequency components appearing at 1166 and 1230Hz show the significant modulation feature, as shown in Figure 5(a). Subsequently, the average of the two components obtains the results from MSB detector as shown in Figure 5(b). The results show clear peaks at inner race fault frequency and its 2nd harmonic. In addition, small peaks are also observable at 3rd to 5th harmonics, which allows the fault to be detected without doubt. In the meantime, the detector also founds two significant peaks at meshing frequencies, which allows the monitoring of meshing processes.
Figure 5. Results of Kurtogram based envelope spectrum and MSB detector
However, by applying the Kurtogram to the signal it results in an optimal filter with a centre frequency of 44063Hz and a bandwidth of 375Hz. Its corresponding envelope spectrum has very high level background noise and no distinctive peaks appear at the fault frequency. Therefore, it shows that the MSB detector is much more accurate and reliable than Kurtogram based envelope spectrum.
5. Conclusions
0 0.2 0.4 0.6 0.8 1 1.2
-100 0 100
Raw vibration data of bearing on PG
Time (s) A c c el er at ion ( m /s 2) 0 0.5 1 1.5 2 2.5 3 3.5 4 4.5 x 10⁴ 0 0.2 0.4 0.6 0.8
Spectrum of raw data
Frequency (Hz) A m pl it ude( m /s 2) 1000 2000 3000 4000 5000 6000 2 4 6 8 10 12 x 106 MSB mag vs fc fc(Hz) A m pl it ude( m /s 2) 1166 1230 65.6814 131.3628 197.0442 262.7256 328.4069 0 0.2 0.4 0.6 0.8 1
Comparing results of MSB and Kutogram
fx(Hz) A m pl it ude By Kurtogram By MSB 164 230
(a)
(b)
(c)
(a)
(b)
COMADEM 2015 + X CORENDE
MSB analysis is effective in suppressing random noise and decomposing the nonlinear modulation components in the measured vibration signals. In this paper, a novel MSB detector is developed for accurate diagnosis of bearing faults to overcome the filter band optimisation problem in traditional narrowband envelope analysis. It shows that the detector allows the successful separation of bearing fault signatures from signals contaminated with both noise stationary white noise and aperiodic impulses. The simulation study shows that the detector can resolve the fault signal for the case of SNR as low as -22dB. This high performance of robustness allows it to detect the bearing fault from a planetary gearbox. On the other hand, the Kurtogram based envelope spectrum has little noise reduction effect, and consequently fails to detect the faults.
References
1. P. McFadden and J. Smith, 'Model for the vibration produced by a single point defect in a rolling element bearing', Journal of Sound and Vibration, vol. 96, no. 1, pp. 69-82, 1984.
2. Y. Lei, Z. He and Y. Zi, 'A new approach to intelligent fault diagnosis of rotating machinery', Expert Systems with Applications, vol. 35, no. 4, pp. 1593-1600, 2008.
3. M. S. Darlow, R. H. Badgley and G. W. Hogg, 'Application of high frequency resonance techniques for bearing diagnostics in helicopter gearboxes', US Army Air Mobility Research and Development Laboratory, 1974.
4. J. Antoni, 'Cyclic spectral analysis in practice', Mechanical Systems and Signal Processing, vol. 21, no. 2, pp. 597-630, 2007.
5. J. Antoni, 'Cyclostationarity by examples', Mechanical Systems and Signal Processing, vol. 23, no. 4, pp. 987-1036, 2009. 6. D. Ho and R. B. Randall, 'Optimisation of bearing diagnostic techniques using simulated and actual bearing fault signals ',
Mechanical Systems and Signal Processing, vol. 14, no. 5, pp. 763-788, 2000.
7. T. Barszcz, 'Decomposition of Vibration Signals into Deterministic and Nondeterministic Components and its Capabilities of Fault Detection and Identification', International Journal of Applied Mathematics and Computer Science, vol. 19, no. 2, 2009.
8. N. Sawalhi, R. Randall and H. Endo, 'The enhancement of fault detection and diagnosis in rolling element bearings using minimum entropy deconvolution combined with spectral kurtosis', Mechanical Systems and Signal Processing, vol. 21, no. 6, pp. 2616-2633, 2007.
9. S. Zhao, L. Liang, G. Xu, J. Wang and W. Zhang, 'Quantitative diagnosis of a spall-like fault of a rolling element bearing by empirical mode decomposition and the approximate entropy method', Mechanical Systems and Signal Processing, vol. 40, no. 1, pp. 154-177, 2013.
10. T. Barszcz and A. JabŁoński, 'A novel method for the optimal band selection for vibration signal demodulation and comparison with the Kurtogram', Mechanical Systems and Signal Processing, vol. 25, no. 1, pp. 431-451, 2011.
11. I. Rehab, X. Tian, F. Gu and A. Ball, 'The fault detection and severity diagnosis of rolling element bearings using modulation signal bispectrum', in Eleventh International Conference on Condition Monitoring and Machinery Failure Prevention Technologies, Manchester, UK, 2015.
12. Z. Kıral and H. Karagülle, 'Vibration analysis of rolling element bearings with various defects under the action of an unbalanced force', Mechanical Systems and Signal Processing, vol. 20, no. 8, pp. 1967-1991, 2006.
13. A. Alwodai, T. Wang, Z. Chen, F. Gu, R. Cattley and A. Ball, 'A Study of Motor Bearing Fault Diagnosis using Modulation Signal Bispectrum Analysis of Motor Current Signals', JSIP, vol. 04, no. 03, pp. 72-79, 2013.
14. F. Gu, Y. Shao, N. Hu, A. Naid and A. Ball, 'Electrical motor current signal analysis using a modified bispectrum for fault diagnosis of downstream mechanical equipment', Mechanical Systems and Signal Processing, vol. 25, no. 1, pp. 360-372, 2011.