Hosseini, Michael and Stephen, Bruce and McArthur, Stephen D. J. and
Helm, Joseph (2018) Current-based trip coil analysis of circuit breakers
for fault diagnosis. In: 2018 IEEE PES Innovative Smart Grid
Technologies Conference Europe (ISGT-Europe). IEEE, Piscataway, NJ.
ISBN 9781538645055 ,
http://dx.doi.org/10.1109/ISGTEurope.2018.8571478
This version is available at
https://strathprints.strath.ac.uk/64784/
Strathprints is designed to allow users to access the research output of the University of Strathclyde. Unless otherwise explicitly stated on the manuscript, Copyright © and Moral Rights for the papers on this site are retained by the individual authors and/or other copyright owners. Please check the manuscript for details of any other licences that may have been applied. You may not engage in further distribution of the material for any profitmaking activities or any commercial gain. You may freely distribute both the url (https://strathprints.strath.ac.uk/) and the content of this paper for research or private study, educational, or not-for-profit purposes without prior permission or charge.
Any correspondence concerning this service should be sent to the Strathprints administrator: strathprints@strath.ac.uk
The Strathprints institutional repository (https://strathprints.strath.ac.uk) is a digital archive of University of Strathclyde research outputs. It has been developed to disseminate open access research outputs, expose data about those outputs, and enable the
978-1-5386-4505-5/18/$31.00 ©2018 Crown
Current-Based Trip Coil Analysis of Circuit Breakers
for Fault Diagnosis
Michael Hosseini, Bruce Stephen,
Stephen D. J. McArthur
Electronic & Electrical EngineeringUniversity of Strathclyde Glasgow, UK
Joseph Helm
Asset Management Northern Powergrid Castleford, UKAbstract—Trip coil current trace analysis is commonly used in the condition monitoring of circuit breakers. Its effective implementation enables an unobtrusive method of diagnosis, reducing costs and increasing safety. Conventional methods of analysis rely on the extraction of knowledge-driven, time-based features from the trace, followed by diagnosis through an expert system. Many utility companies rely on the automated feature extraction capabilities provided within the trip coil current recorder. This paper highlights markers of potentially poor circuit breaker health missed when relying solely on such time-based analysis. A supplementary, data-driven method focusing on identifying such cases using machine learning techniques is introduced and demonstrated in this paper. Additionally, attention is drawn to the susceptibility of incorrect feature extraction by the recorders when subject to some of the explained current-based abnormalities.
Index Terms—Circuit breakers, Fault diagnosis, Machine learning
I. INTRODUCTION
Circuit breakers are safety-critical devices that are idle for most of their operational life. This results in the risk of encountering faults during necessary operation; posing a threat to other network assets and safe operation [1]. Maloperation can cause unplanned interruptions to supply, potentially leading to regulatory punitive actions. It is therefore essential to effectively monitor their conditions in order to prevent, or at least pre-empt, failures. In practice, a utility company’s portfolio consists of a varied asset base of different models of circuit breakers, whose ages can vary by upwards of several decades. Trip coil current trace analysis has proven to be a popular technique [2]–[13] in the condition monitoring of circuit breakers given its unobtrusive nature, and that it can avoid the need for retrofitting sensors to older models.
Domain knowledge in established circuit breaker diagnostics centres on relating the trace characteristics to the physical tripping mechanism within the circuit breaker, and on setting thresholds for acceptable value ranges for these characteristics to fall between [3]–[13]. Outliers are then mapped to a diagnosis by linking deviations in the trace to
physical events, again based on domain knowledge. These works either started from raw signals [4]–[9], or from the provided automatically-extracted features given by commonly used handheld trip coil current measuring devices [10]–[13].
The cases starting from the raw traces obtained their data from relatively homogenous, and often new, asset bases. Many of the faults were then recreated in a laboratory setting or digitally synthesised. Furthermore, most extracted features were based on existing domain knowledge of the mechanism’s action using signal processing techniques that had to be tuned for each model.
The cases using the provided automated feature extraction from the handheld devices had large sets of real field data of a heterogenous asset base. This paper sets out to demonstrate that the established features are insufficiently reliable with their accuracy under certain circumstances. It has yet to be shown whether the existing methodologies from other works can be transferred to real datasets of in-use asset bases with limited sensor measurements. In such a scenario, there are no pre-labelled ‘perfect’ traces to set as a benchmark a priori.
Additionally, this paper demonstrates the existence of a subset of potential faults that are not reflected in time-based features; thus, necessitating an additional method of analysis to identify such cases. Where some of these faults have been covered by others [4]–[9], DC voltage and relevant relay readings were used for analysis; these are measurements not available in this paper’s dataset nor were they operationally captured in many cases. This paper will therefore seek to map some faults relating to the battery and the ‘a’ and ‘b’ relays from solely the current trace.
Finally, this paper draws attention to the susceptibility of commonly-used handheld measuring devices to extracting erroneous features when subject to unexpected waveforms. This paper will use a data-driven machine learning approach for diagnosis. This can potentially also be used to automatically highlight cases where the handheld device is likely to make a mistake in its feature extraction.
This work was supported by the EPSRC (Engineering and Physical Sciences Research Council).
II. BACKGROUND
A. Circuit Breaker Circuitry and Tripping Mechanism This paper focusses on medium voltage circuit breakers and tests the methodology only on spring-operated tripping mechanisms. A simplified circuit diagram of the circuit breaker in relation to the commonly used handheld measuring device is shown in Fig. 1 and was adapted from [14]. Excluded from it is the battery powering the control circuitry, and the anti-pumping mechanisms in place to prevent multiple trips in quick succession. Should the battery fail to sufficiently power the control circuitry, the AC source meant for charging the battery is relied upon [3].
Figure 1. Simplified circuit diagram of a conventional circuit breaker. Adapted from [14].
There are the two relays: one to trip the breaker, and one to close it. These are commonly referred to as 52a and 52b relays [5]. Once a switch is closed, the corresponding coil is energised which eventually operates the breaker mechanism to operate the interrupter, disconnecting the main circuit. The measuring device measures the current across the control circuitry, as well as measuring the main circuit. This allows it to record the conventional trip coil current trace, as well as record directly when the main circuit is disconnected.
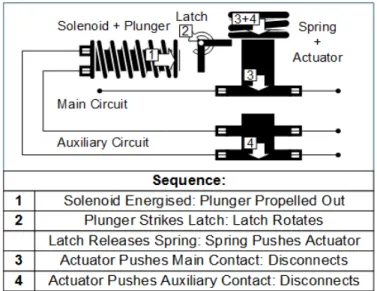
The specifics of the circuit breaker mechanism will vary between manufacturers, however a generalised illustration of a spring-operated mechanism is provided in Fig. 2, which is adapted from [15]. Once a signal is received to trip, the auxiliary circuit energises a solenoid. Once sufficient electromotive force is generated, the plunger is propelled into a latch. The latch then releases a compressed spring which in turn moves an actuator. This first disconnects the main circuit, and then disconnects the auxiliary circuit; de-energising the solenoid and resetting the system [2].
B. Circuit Breaker Trip Coil Current Analysis
The principle of the trip coil current analysis is to infer the circuit breaker’s operation using the current of the auxiliary circuit as a proxy. This is possible as that the movement of the plunger induces a current affecting the measured current in the auxiliary circuit. Fig. 3 is an annotated example of a trace highlighting the point at which a given event occurs, this is adapted from [15]. This paper refers to such analysis as ‘time-based’.
Figure 2. Simplified diagram of a spring-operated tripping mechanism. Adapted from [15].
The specific features used depend on the sensors used, however those listed in Fig. 3 contain those most commonly cited [3]–[14]. “Start” refers to the time at which the coil begins energising. “Peak” can be both the time and the current of the first peak in the trace prior to the latch being struck. “Latch” is the time at which the plunger hits the latch, slowing and thus causing the deflection in the trace. “Buffer” refers to the time at which the trace is once again deflected as the plunger reaches the extent of its motion. “Plateau” can be both the time and the current of the peak in the trace after the plunger stops moving. “Aux. Contact” is short for Auxiliary Contact, which is often termed as “Acon” and it refers to the
time at which the auxiliary circuit beings de-energising. “End” then refers to the time at which the current reaches zero. In addition to these, “Main Contact”, sometimes referred to as “Mcon”, is also often captured separately and used in the
analysis; it is the point at which the main circuit is de-energised.
Each event has an expected value range and relation to the others. Outliers can be used to isolate the point at which there is likely a problem with the mechanism. For example, if the “Start” and “Peak” times are as expected, but the “Latch” and all subsequent events are delayed, it can be inferred that the problem is with the latch. Domain knowledge will link this to likely scenarios, such as the latch being overly stiff due to poor lubrication for example [8].
Despite the numerous advantages of this method, such as its relative ease in applying domain expertise to the analysis through methods such as rule-based diagnostic systems, there are also some limitations. Firstly, there remains some indicators of potential poor health of the circuit breaker which are not reflected in these features. Examples of these are some types of battery problems, dirty or damaged auxiliary contacts, damaged coils, poor connections, and poor readings [3], [14]. This paper refers to these as ‘current-based’ indicators as they do not necessarily affect the time at which the events in the mechanism occur. An example of this is shown in the top trace in Fig. 4.
Figure 3. Annotated example of a trip coil current trace. Adapted from [15].
Another fundamental limitation is that these extracted values are assumedly tied to physical events occurring within the mechanism. However, some new circuit breakers do not employ such mechanisms, rendering such assumptions obsolete. New work must then be undertaken to again find links between the trace and the mechanism.
Another limitation is regarding its implementation; to successfully extract the desired events, signal processing techniques are required. Such methods require tuning to function correctly [5]. As different circuit breaker models with different trace characteristics are employed, either the signal processing must be re-tuned, or run the risk of erroneous readings. Even in cases where the system would regularly work, when subject to extreme deviations such as those caused by the current-based indicators, false readings may be acquired. It is possible to draw false conclusions under certain circumstances if the incorrect readings happen to correspond to an assumed fault. The bottom trace in Fig. 4 shows an example of a trace where the automatically extracted features from the commonly used handheld device would have indicated a fault regarding motion of the plunger.
Another area where false readings become problematic is when relying on all data points to determine an expected value for normal behaviour. This is due to the difficulty in automatically filtering cases of poor feature extraction from cases of poor circuit breaker performance. In the bottom trace in Fig. 4, one could reason that the combination of a highly elongated buffer time would be unlikely to coincide with a highly shortened plateau current duration and use this as a basis for filtering. However, this would require a complex ruleset attempting to predict likely patterns of failed feature extraction. Instead, it may be possible to scan for high levels of current-based indicators as a flag that the time-based extraction process is more susceptible to make a mistake. C. Current-Based Indicators
This section will discuss the subset of indicators of potential poor health being classed as ‘non-event based’. Further research is required in documenting and classifying the indicators that would fall under this subset. The categories discussed are: battery problems, degraded contacts and coils, poor connections, measurement issues, and the remaining unknown causes. Relevant examples are shown in Fig. 5 and are explicitly referenced individually in the subsequent paragraphs.
1) Battery Problems
The specific cause of the battery problem can vary, and as such, so do the symptoms. There are primarily two aspects: the output voltage, and the storage capacity. As batteries age, their storage capacity degrades [16]. Once there is insufficient stored energy to power the trip, the AC supply drives the auxiliary circuit instead [3], [14]. This imposes a periodic ripple of some form.
The second aspect is the voltage output which is also often related to the battery’s remaining charge [16]. The relationship depends on the battery’s chemistry. A reduced voltage will increase the time taken to sufficiently energise the coil to propel the plunger [8].
In the dataset available, only the current is available: increasing the difficulty in identifying the symptoms as there exists insufficient literature comprehensively mapping the symptoms over to the current trace. For example, the ripples found superimposed in the current do not necessarily conform to the conventional AC sinusoidal waveform. Speculatively, this is due to the presence of filtering, or the internal chemistry of the batteries, which would be supported by [17].
For the purposes of this paper, only the periodic waveforms are used as an indicator of a battery problem. Samples 1a and 1b are the relevant examples in Fig. 5. Often, the ripple only appears after the ‘buffer’ event as by then, enough charge has been expended for faulty batteries with limited storage capabilities to begin showing symptoms. Reduced voltage levels cannot be differentiated from other faults with sufficient confidence to identify them as such. Particularly, regarding why they happen at given points in the trace, and why they do not then lead to the superimposed ripple. As such, they are included in the ‘Unknown’ category.
It should also be noted that some circuit breaker designs rely on AC power to close as per design, and as such will always possess superimposed ripples on their close trips [3].
2) Degraded Contacts and Coils
This is another indicator that is difficult to categorise. the primary identifier is the presence of excessive noise and an overall reduction in current levels [3], [14]. However, the noise could also be caused from the measuring device’s contacts being dirty, or being placed too close to the coils; leading to electromagnetic interference [3]. Additionally, the reduction in current is small when compared to overall differences between circuit breakers. As such, it would require a comparison between previous performances of the specific circuit breaker to detect. Under such circumstances, the more traditional event-based indicators of ‘peak’ and ‘plateau’ currents should also be affected.
As the data in this paper is being viewed collectively and not grouped into specific circuit breakers, this category is not being used. Examples being classified as ‘Healthy’ and ‘Unknown’ potentially include some cases of degraded contacts and coils. Degraded contacts and coils can cause arcing that subsequently rapidly accelerates its rate of deterioration [3], [14]. Eventually, it can lead to a complete failure in the mechanism.
3) Poor Connections
Poor connections can cause momentary total loss of power. An example can be a loose fuse [3], [14]. Its primary identifiers are a fall in current of similar rate to when the Auxiliary Contact is disconnected, and the presence of re-saturation curves of the current in the coils after the power is regained. Over time, poor connections may develop to a complete failure in the mechanism. Samples 2a and 2b are the relevant examples in Fig. 5. If a contact is sufficiently damaged, it can result in a poor connection.
4) Measurement Issues
Measurement issues refer to intermittent, abrupt changes in current that cannot be explained through the loss - and subsequent regain - of power. The presumed cause is sensor reading errors potentially similar to when the measuring device’s contacts were dirty. The difference is that these errors are intermittent, and often occurs during points of high vibration, as opposed to superimposing a continuous stream of noise on the waveform.
An additional implication is that the reading does not reflect the actual current level. However, it is thought that the measurement issues are often caused by vibrations in the mechanism, which is a leading cause of failure in circuit breakers [1]. The vibrations coincide with the auxiliary contact moving.
5) Unknown Causes
Finally, there remains a subset of deviations of unknown causes. The ‘unknown’ category contains an unknown number of causes. Samples 4a, 4b, 4c, and 4d are the relevant examples in Fig. 5. Note the high variance in sample 4b in the current, particularly how it intermittently measures a current similar to the expected ‘plateau’ current. This differs from the other examples; perhaps indicating a different cause. Additionally, note sample 4d possessing the characteristic re-saturation curves post dips, indicating a poor connection. Sample 4a is possibly an example of power loss with little recovery. Finally, note that despite sample 4c possessing the
same re-saturation curves, its descents are concave as opposed to convex. Again, this could indicate a differing cause such as a reduction in voltage. Further research investigating the actual causes of these indicators could prove very useful for future diagnostics. It is thought that poor auxiliary switch contacts are a primary cause of many of these.
When the readings are particularly bad over an extended time, it is difficult to differentiate whether there also exists a loss of power. Ideally, one would recommend cleaning, and re-securing the probes away from the coils and rerunning the test to minimise the likelihood of interference with current readings [3]. This is also the case for readings containing the ‘unknown’ indicator. This requires for the problem to be noticed at point of inspection, and also undermines the ability of the analysis to pick up lubrication problems that often only exhibit themselves in the first shot after a prolonged period of inactivity [2]. 1a – Battery Issue 3a – Poor Readings 1b – Battery Issue 2b – Poor Connection 4a – Unknown 4b – Unknown
Annotated Plot of Example Trip Coil Current Trace
2a – Poor Connection
4c – Unknown 4d – Unknown 3b – Poor Readings
III. AUTOMATIC DIAGNOSIS OF NON-EVENT BASED
INDICATORS
A. Introduction
This paper explores the trip coil current traces of a specific circuit breaker model as measured in field. This is a legacy
Figure 5. Example of automated feature extraction of commonly used handheld devices provided misleading results.
Figure 4. (Top): Two examples of similar time-based features despite visual differences. (Bottom): Example of mistaken features automatically extracted
dataset spanning numerous years with no ground truth supplied.
Numerous steps were taken that significantly constrains the problem space. These will be relaxed in future work. Only samples exhibiting a single fault type are included. This is due to the limitation in labelling, being constraint by the classifier being used. To accommodate this, only cases where a single current-based features is present are being classified. Therefore, data that exhibits grossly unexpected waveforms in regard to time-based features, or multiple current-based features are filtered out.
The dataset contains 241 examples that have been manually labelled in accordance to the descriptors outlined in the sections above. The classes used are: ‘Healthy’, ‘Battery’, ‘Connection’, ‘Readings’, and ‘Unknown’. Given the aforementioned difficulties in identifying dirty contacts, they are omitted as a class. A breakdown of the data is provided in Table I.
B. Features Used
This paper seeks to use a more data-driven approach in the automated classification as it can theoretically be applied to multiple circuit breaker models without retuning. The approach relies on isolating the period expected to represent the ‘plateau’ and comparing it to the rest of the trace in various ways. This is making an assumption regarding the expected waveform, however it empirically outperformed alternatives.
The key properties of interest are the current’s statistical properties, its abruptness and periodicity, and the duration of the trace isolated in relation to the period prior and after it. A total of fifty features are used. Table II lists the features used in the traditional time-based analysis being used as a comparison. These features were obtained from the commonly used handheld measuring device.
1) Statistical Properties
The statistical properties of each of the three sections are represented using: the minimum, maximum, mode, mean, median, interquartile range, sum and standard deviation.
2) Abruptness and Periodicity
Abruptness represents significant variance in short periods of time whereas periodicity represents the amount the signal
repeats itself. For example, a sinusoidal wave will repeat itself after every period. These properties were captured for only the isolated ‘plateau’ region and used various filters and transformations. From each of these filters, the sum, maximum magnitude, mean, and median were extracted as features. The first was a standard deviation filter applied on the signal. A second filter was applied to the gradients of the signal. A third, Kalman filter, was also applied to the original signal and the error between the predicted and actual waveform was kept. These filters highlight areas of abrupt or ‘unexpected’ changes in the waveform.
For periodicity, the methods used were autocorrelation and a Fourier Transform. A fixed range of lags were evaluated in the autocorrelation, and from that, the sum, maximum, mean, and median of the absolute values were extracted. Using autocorrelation values of the fixed range of lags, a Fourier transform was applied; this highlights any repeated patterns in the autocorrelation results. For example, if there were high autocorrelation values at every even lag value, the Fourier transform would spike at the relevant ‘frequency’. The sum, maximum, mean, and median of a fixed range of the Fourier transform was then extracted.
3) Relating Isolated Section to Neighbours
To capture information regarding the isolated section in relation to the whole trace, the ratio of the length and area of each region compared to the whole waveform was used as features. Additionally, the start and end points of the isolated region were extracted as a percentage of the total waveform length and are used as features.
C. Machine Learning Algorithm
For the case study, an Ensemble of AdaBoosted Trees was used as the classifier [18], [19]. The method combines multiple simple decision trees to create a high-performance classifier. Alternative methods were tested but performed worse empirically. The training used five-fold cross validation. The inputs would consist of the described features representing the data, and the output would be the diagnosed class.
D. Case Study Results
Table III tabulates the confusion matrix of the results of the proposed method. This can be compared against Table IV that uses traditional time-based features. Although the performance increase is significant, it should be highlighted that the problem space was constrained specifically to highlight traditional features’ shortcomings. Considering this, the overall performance is rather poor, especially with battery and connection faults. Another point is that the features are obtained from the measuring device, which can perform poorly in these cases. This means that a contributing factor to the poor performance may be the feature extraction implementation as opposed to the features themselves.
The classes used are likely a significant factor in this. A decision must be made at how much a deviation from a ‘perfect’ sample is it acceptable to still be considered ‘healthy’. Likewise, once the deviations become too extreme, they often fall into the ‘unknown’ class. These arbitrary thresholds seem to pose significant challenges for the
Traditional Features Extracteda Start Time Latch Time Buffer Time Auxiliary Contact Time End Time Peak Current Plateau Current Data Classes Size
(Percentage) Healthy 82 (34.0%) Battery 26 (10.8%) Connection 34 (14.1%) Readings 57 (23.7%) Unknown 42 (17.4%) Total 241 (100%)
a. These are the features made available by the commonly handheld device, excluding Main Contact Time, which could not be validated.
classifier. Battery problems and connection problems both have significant misclassifications as either ‘Healthy’ or ‘Unknown’.
Another area of high errors is regarding the ‘Unknown’ class, that have many false positives as ‘Battery’ problems. This is due to the fact that they possess high levels of periodicity such as the sample shown in Fig. 5, sample 4c. It may be the case given how similar the symptoms are, that such examples are indistinguishable from ‘Battery’ problems. Indeed, they may in fact be simply severe ‘Battery’ problems that are currently being labelled as ‘Unknown’.
TABLEIII. CONFUSION MATRIX USING NEW FEATURE SET
TABLEIV. CONFUSION MATRIX USING TRADITIONAL FEATURE SET
IV. CONCLUSION
Increasingly, circuit breakers are fitted with permanent sensors that decreases the difficulty of their analysis. However, for the foreseeable future, there will remain many circuit breakers without such sensors. For these, traditional event-based analysis of the trip coil analysis is insufficient to identify all relevant indicators of poor health.
There is room much for improvement in the specific implementation outlined in the classification system tested. However, it also demonstrates the potential direction of future work. It should also be repeated that such a method is not a replacement to the event-based analysis, but complementary to it. Future work should explore combining the approaches. Future work will explore multi-label classifiers to accommodate multiple diagnoses of faults on a single trace.
Another practical application for the outlined method is to filter out samples that are likely to have errors in the
automated feature extraction provided by commonly used handheld measuring devices. This allows for legacy datasets to be used to provide statistical benchmarks regarding perfor-mance for maintenance guidance. Currently, the prevalence of the mistaken readings in such datasets skew results.
REFERENCES
[1] IEEE, “IEEE guide for the selection of monitoring for circuit breakers,” IEEE Std C37.10.1-2000, 2001.
[2] S. Beattie, “Circuit breaker condition assessment by vibration and trip coil analysis,” in IEE Colloquium on Monitors and Condition
Assessment Equipment, 1996, vol. 1996, pp. 9–9.
[3] W. R. Speed, “Circuit breaker operator signature analysis.” In Proc. International Converence of Doble Clients, Sec (pp. 4-4) 2000. [4] M. Kezunovic, Z. Ren, G. Latisko, D. R. Sevcik, J. Lucey, W. Cook,
and E. Koch, “An expert system for automated analysis of circuit breaker operations.”
[5] M. Kezunovic, Z. Ren, G. Latisko, D. R. Sevcik, J. S. Lucey, W. E. Cook, and E. A. Koch, “Automated monitoring and analysis of circuit breaker operation,” IEEE Trans. POWER Deliv., vol. 20, no. 3, 2005. [6] D. R. Sevcik, J. Lucey, W. Cook, E. Koch, M. Kezunovic, Z. Ren, and
G. Latisko, “Automated analysis of circuit breaker operations,” EPRI
Substation Equipment Diagnostics Conference, 2003.
[7] S. Natti and M. Kezunovic, “Assessing circuit breaker performance using condition-based data and Bayesian approach,” Electr. Power
Syst. Res., vol. 81, pp. 1796–1804, 2011.
[8] A. A. Razi-Kazemi, M. Vakilian, K. Niayesh, and M. Lehtonen, “Circuit-breaker automated failure tracking based on coil current signature,” IEEE Trans. Power Deliv., vol. 29, no. 1, pp. 283–290, Feb. 2014.
[9] A. A. Razi-Kazemi, M. Vakilian, K. Niayesh, and M. Lehtonen, “Data mining of online diagnosed waveforms for probabilistic condition assessment of SF6 circuit breakers,” IEEE Trans. Power Deliv., vol.
30, no. 3, pp. 1354–1362, Jun. 2015.
[10] S. M. Strachan, S. D. J. McArthur, B. Stephen, J. R. McDonald, and A. Campbell, “Providing decision support for the condition-based maintenance of circuit breakers through data mining of trip coil current signatures,” IEEE Trans. Power Deliv., vol. 22, no. 1, pp. 178– 186, Jan. 2007.
[11] S. M. Strachan, B. Stephen, and S. D. J. McArthur, “Practical applications of data mining in plant monitoring and diagnostics,” in
2007 IEEE Power Engineering Society General Meeting, 2007, pp. 1–
7.
[12] B. Stephen, S. M. Strachan, S. D. J. McArthur, J. R. McDonald, and K. Hamilton, “Design of trip current monitoring system for circuit breaker condition assessment,” IET Gener. Transm. Distrib., vol. 1, no. 1, p. 89, 2007.
[13] S. Strachan, S. McArthur, J. McDonald, W. Leggat, and A. Campbell, “Trip coil signature analysis and interpretation for distribution circuit breaker condition assessment and diagnosis,” in 18th International
Conference and Exhibition on Electricity Distribution (CIRED 2005),
2005, vol. 2005, pp. v1-111-v1-111.
[14] Kelman, “Profile P2 Operating Manual,” 2003.
[15] R. Watson, “Diagnostic technique facilitates timing and condition monitoring of circuit breakers,” in Engineering Asset Management
Conference, 2000.
[16] IEEE Standards Coordinating Committee 29 on Stationary Batteries., Institute of Electrical and Electronics Engineers., and IEEE Standards Board., IEEE guide for the protection of stationary battery systems. Institute of Electrical and Electronics Engineers, 1998.
[17] M. J. Thompson and D. Wilson, “Auxiliary DC Control Power System Design for Substations,” in 60th Annual Conference for Protective
Relay Engineers, 2007.
[18] Y. Freund and R. E. Schapire, “A desicion-theoretic generalization of on-line learning and an application to boosting,” Springer, Berlin, Heidelberg, 1995, pp. 23–37.
[19] H. Drucker and C. Cortes, “Boosting decision trees,” Adv. Neural Inf.
Process. Syst., pp. 479–485, 1996.
True Class
Predicted Class
Healthy Battery
Connec-tion Readings Unknown
Healthy 69 (84%) 5 (6%) 4 (5%) 2 (2%) 2 (2%) Battery 7 (27%) 13 (50%) 2 (8%) - 4 (15%) Connec-tion 8 (24%) 1 (3%) 20 (59%) 1 (3%) 4 (12%) Readings 3 (5%) - 1 (2%) 52 (91%) 1 (2%) Unknown 5 (12%) 6 (14%) 2 (5%) 2 (5%) 27 (64%) True Class Predicted Class
Healthy Battery
Connec-tion Readings Unknown
Healthy 60 (73%) 4 (5%) 3 (4%) 9 (11%) 6 (7%) Battery 11 (42%) 5 (19%) 2 (8%) 5 (19%) 3 (12%) Connec-tion 18 (53%) - 3 (9%) 8 (24%) 5 (15%) Readings 20 (35%) 4 (7%) 6 (11%) 22 (39%) 5 (9%) Unknown 10 (24%) 3 (7%) 2 (5%) 5 (12%) 22 (52%)
![Figure 3. Annotated example of a trip coil current trace. Adapted from [15].](https://thumb-us.123doks.com/thumbv2/123dok_us/10185004.2921019/4.918.80.450.91.283/figure-annotated-example-trip-coil-current-trace-adapted.webp)


