Agroholdings membership: does that make a difference in
performance?
HEINRICH HOCKMANN
a, RAUSHAN BOKUSHEVA
a, AND IRINA
BEZLEPKINA
baIAMO, Institute of Agricultural Development in Central in Eastern Europe in Halle, Germany
b Business Economics, Wageningen University, The Netherlands
Paper prepared for presentation at the 102th EAAE Seminar ‘Superlarge Farming Companies: Emergence and Possible Impacts’, Moscow, Russia, date as in: May 17-18,
2007
Copyright 2007 by [Heinrich Hockmann, Raushan Bokusheva, and Irina Bezlepkina]. All rights reserved. Readers may make verbatim copies of this document for non-commercial purposes by any means, provided that this copyright notice appears on all such copies.
Agroholdings membership: does that make a difference in performance?
Heinrich Hockmanna∗, Raushan Bokushevaa, and Irina Bezlepkinab
aIAMO, Institute of Agricultural Development in Central in Eastern Europe in Halle, Germany
b Business Economics, Wageningen University, The Netherlands
Paper submitted for presentation at the 102th EAAE Seminar
“Superlarge Farming Companies: Emergence and Possible Impacts”, May 17-18, 2007
Abstract
Comparing different organizational, managerial and economic indicators of the farms in two selected regions the study investigates whether agroholdings perform better and thus can be regarded as a promising organizational model for Russian agriculture. A comparatively poor performance of agroholdings’ members in both regions implies that this organisational form suffers from principal management problems hampering the move of agricultural production towards efficient trajectories. The insights regarding the selection of agroholdings’ members, farm restructuring, marketing activities and performance cannot however be simply transferred to Russian agriculture in general. In both regions analyzed the establishing of agroholdings was strongly promoted by the local government which induces a bias in the reason to integrate.
1 Introduction
In the past decade, Russian agriculture has undergone transformations that have had a remarkable impact on its current development. Despite the emergence of 275 thousand family farms, mainly during the period 1990-1994, the predominant part of agricultural output is produced by corporate agricultural farms, i.e. former collective (kolkhoz) and state (sovkhoz)
farms. In 2004 their share in gross agricultural production (GAP) amounted to 42.8 per cent. and - 62, 58 and 87 per cent in grain, potato and milk production, respectively (Rosstat, 2006). In the late nineties, Russian corporate farms began to merge into large companies (agroholdings) cultivating between 10,000-250,000 hectares. At the beginning, the reasons
for emergence of these superlarge companies were primarily economic (Wandel, 2000). Later on, this organization model has been extensively used as a blueprint by regional authorities to reduce the number of strongly indebted farms. Though the Russian Statistical Agency (Rosstat) does not provide official information on agroholdings, these companies are argued
to be relatively widespread in Russian agriculture at the moment. According to Petrikov (2005a), there should be at least 241 of them in 27 different Russian regions. In general, there is not so much literature investigating the agroholdings development in Russia. A few studies
that exist consider primarily the reasons for their emergence and describe their organizational structures (Baklashenko, 2000; Hockmann et al, 2005; Rylko and Jolly, 2005; Zlobin, 2002), while performance of agroholdings and major differences with other corporate farms remain rather uninvestigated. At present there is no serious economic argument in favour of
agroholdings’ blueprinting. In this paper, based on the data survey of agricultural enterprises
in the Oroel oblast we aim to analyze comparatively performance of farms – members of agroholdings – with that of independent corporate farms in this region. Based on theoretical concepts as well as comparing different organizational, managerial and economic indicators
of the surveyed farms we are investigating whether agroholdings perform better and thus can be regarded as a promising organizational model for Russian agriculture.
The paper is organized as follows. The next section proceeds with an attempt to provide a definition to agroholdings. In section 3, literature review focusing the relation between performance and reasons for vertical integration is carried out. Section 4 presents analytical procedure of the empirical analysis and introduces the data. Section 5 starts with analyzing the performance of agroholdings based on aggregated data and continues with comparative analysis based on individual farm characteristics. Conclusions are drawn in the final section.
2 Agroholdings: An attempt of a definition
After the 1998 financial crisis Russian corporate farms began to merge into large units cultivating between 10,000-250,000 hectares (Rylko and Jolly, 2005). Though there has been no official name for this new organizational form in the literature, in various studies they are referred as new agricultural operators (Rylko and Jolly, 2005), giant enterprises (Hockmann, 2005), integrated agroindustrial formations (Petrikov, 2005a), vertically integrated holdings, or agroholdings (Oganesov, 2004). Perhaps the most common name for these new structures is ‘agroholdings’ which will be also used in this paper. Following the definition by Ušačev
(2002a) which is widely spread in the Russian agricultural literature, an agroholding is ‘the
collectivity of juristic persons which are connected by contract or property relations and where one enterprise takes on the function of a main company (russ. golovnaja kompanija)“1. This definition is rather broad and covers a variety of institutional and organizational arrangements from ownership (purchase of shares), joint production planning and coordination, land lease contracts to the provision of services. The organisational form of
1 Differently from the meaning of "Agroholdings" in Western countries (see Keller, 1993) the Russian
interpretation does not only include the possibility that the holding company practices its own production activities. Additionally, the participating enterprises are not necessarily obliged to be connected by ownership relations but also on the basis of cooperation contracts (Ušačev, 2002a).
vertical relationships can be defined as configuration of four distinct but related dimensions of integration: ownership, task, coordination and knowledge. A theoretical study of Jaspers and van den Ende (2006) provides a theoretical framework targeted at understanding of how vertical structures are organised. In Russia, agroholdings differ (1) by the way and number of the integrated production, processing and services stages, (2) in the degree of the judicial and economic independence of the integrated enterprises, and (3) in the organizational structure. In many holdings the various forms of governance exist simultaneously, that is to say the members are linked to each other by a number of different connections. Often the partners come from all stages of the food chain, i.e. farms and upstream and downstream stages. Banks and other businesses, such as oil or metallurgy companies, are often members as well. In many regions the state is not an insignificant shareholder either.
In some Russian Oblasts agroholdings are basically not present, in others, especially in those in the Southern Russia they controlled about one third of the agricultural land in 2002. For example, their share in agricultural land use was 37% in oblast Oroel and 31% in oblast Belgorod (Kurtoeva, 2003). According to Petrikov (2005b), agroholdings manage more than 73 % of the agricultural land in Belgorod Oblast in recent years. Information from Moscow oblast also indicates that the emergence of agroholdings has accelerated recently in this region as well. According to Petrikov (2005a), there should be at least 241 of them in 27 different Russian regions. The non-uniform terminology can be regarded as one reason for the lack of reliable official data concerning the meaning of the integrated structures in the Russian agriculture and food science (Khramova, 2002). Another reason is that the statistical institutions on federal and regional level in Russia have shown such information only isolated and unsystematically; especially because agroholding does not represent any officially accepted enterprise or judicial form (Khramova, 2002, Rodionova and Dackova, 2005; Petrikov, 2005b). Clearly, the first source of data obtained by means of surveys or collection
of book-keeping data is an advantage for anyone wishing to study this subject. The data clarifying the type of internal organization is of great importance as well.
3 Vertical integration and performance
The growing theoretical literature in strategy and industrial organization economics indicates that there is substantial incentive for firms to vertically integrate and thereby improve their performance. The incentive to integrate depends on the type of production involved, the extent of transaction costs, the amount of specialized assets, the degree of market power at each stage of production, the separability of activities, and the amount of uncertainty covering prices and costs (Daveni and Ravenscraft, 1994). The empirical literature shows that vertical integration effect on profitability is ambiguous (Bhuyan, 2001). Studying the impact of vertical mergers in US food manufacturing – as a type of vertical ownership integration Pinjab finds no support for improved performance and concludes that increasing capital intensity as a strategy to increase profit does not result in improved profitability.
The relation between a membership in agroholdings and performance of an integrated firm is not straightforward, because this is largely determined by the reasons for integration. A stream of literature discussing the integrated structures in Russia suggests that vertically integrated structures were supposed to cope with unfavourable agricultural terms of trade (input prices increased faster than output prices, especially in the period 1990-1994) (see Novikov, 1995; Rodionova, 2002; Miloserdov, 2002). Following the Ministry of agriculture of Russian Federation, agroholdings should have contributed to the restructuring of bankrupt enterprises: ‘farms, which are in financial difficulties and ‘healthy’ enterprises from other sectors with sufficient financial resources or access to credits, should merge’ (see Minselhoz, 2001; Ušačev, 2002a). According to a survey conducted in Rostov and Stavropol regions (see Khramova, 2003), the most frequently named reasons were: (1) the assurance of supply of
agricultural raw materials, (2) the ‘recommendation’ of oblast and/or rayon governance and (3) the securing of access and repayment of credits.
Hockmann et al (2003) find the low concentration in the Russian food sector as a further reason for the emergence of the highly integrated structures there. By comparison with Western Europe, the Russian food industry has had a very fragmented structure of food market. To succeed in the long term in national and international markets, concentration was indispensable. Thus, this type of integration would rather imply an improved performance of integrated companies.
There is a lack of evidence about the impact of the agroholdings membership on the development of agricultural sector in Russia, and even more importantly, about economic sustainability of these organisational structures. Moreover, the extent to which agroholdings provide a suitable model for Russian agriculture depends on whether factors used by them have remuneration which can be comparable with that in other organisational forms.
4 Analytical procedure
Limited empirical evidence signals that agroholdings make significant investments and introduce technological improvements into agricultural production (see Rylko and Jolly, 2005, Petrikov, 2005a) hereby releasing surplus labour. In general, the impact of different technologies on agricultural production can be regarded by employing the following relationship: (1) L A A Y L Y = ,
where Y, A, L denotes output, labour input, and land, respectively. Land-saving technologies are generally associated with a higher output per hectare (Y/L). Accordingly, labour-saving technologies found their expression in the man-land ratio (A/L), because, the more land is cultivated per worker, the higher is the requirement for equipment and
machinery. Thus, in this context, land-man ratio can serve as an indicator of the intensity of the technology adopted.
These facts point at intensification of production in the agroholdings and thus suggest Hypothesis 1: Due to more capital intensive production, agroholding members will exhibit a higher land-man ratio than independent corporate farms.
Further on, since agroholdings are expected to operate with modern equipment and, additionally, have released part of their labour, this suggests
The Hypothesis 2: Membership in an agroholding is supposed to increase the remuneration of resources, especially that of labour, i.e. labour productivity must be greater in an agroholding than in an independent farm (since such factors as capital have to be remunerated, the remuneration of labour should be adjusted to that of other factors ).
We will investigate this hypothesis by looking at the decomposion of labour productivity in land productivity and land-man ratio:
(2) L A A Y L Y = , or equivalently ⎟ ⎠ ⎞ ⎜ ⎝ ⎛ + ⎟ ⎠ ⎞ ⎜ ⎝ ⎛ = ⎟ ⎠ ⎞ ⎜ ⎝ ⎛ L A A Y L Y ln ln ln
where Y, L, and A denotes output, labour input, and land, respectively.
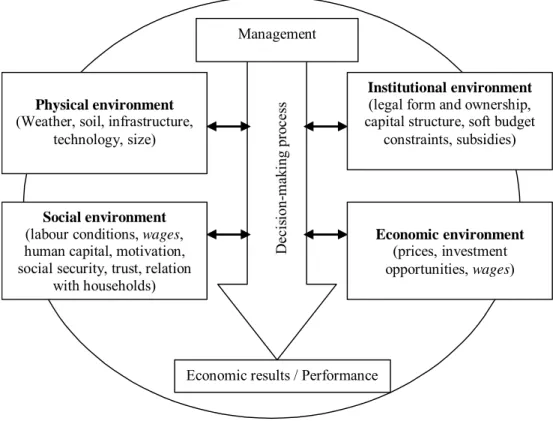
Next to testing these hypotheses, the two groups (agroholdings versus other farms) are compared to find any statistical differences in their performance. In studying similarities and divergences of corporate dairy producers by their performance, managerial and structural characteristics, Bezlepkina et al (2007) identified several variables (see also Figure 1) that characterise each of the four dimensions of farm environment: 1) physical, composed of seasonal weather conditions and the variability of these conditions; physical environment through the technology also defines such parameters as yields, intensity and specialisation, which also have impact on farm performance; 2) economic, determining the relative as well as the absolute level of input and output prices, investment opportunities; 3) social, prescribing
labour conditions and social networks; and 4) institutional, prescribing rules for the use of debt capital, rules for payment of taxes, legal rights and obligations, conditions for the relations between the state, institutions and producers, restructuring processes.
Management
Economic results / Performance
Institutional environment (legal form and ownership, capital structure, soft budget
constraints, subsidies)
Economic environment (prices, investment opportunities, wages)
Social environment (labour conditions, wages,
human capital, motivation, social security, trust, relation
with households) Physical environment (Weather, soil, infrastructure,
technology, size) D ec is ion-m ak ing pro ce ss
Figure 1 Relation between farm performance and environment, see Bezlepkina et al (2007)
In this study we distinguish the following characteristics of agroholdings and other farms to compare their performance and structures: a) size, specialisation, technology, farm location and crop yields (Physical environment); b) legal form and ownership type, farm restructuring and debts (Institutional environment); c) output and input prices, investments (Economic environment) and d) wages, age, education (Social environment). Farm management is approached through the measures of technical efficiency by means of Data Envelopment Analysis (see Coelli (1998) and Appendix 1) and overall measures of economic performance such as profitability, returns per factor input. When comparing two groups, the
effect of farming environment is cleared up from stochastic elements (weather, price fluctuations) by analysing farm characteristics averaged over years.
Many studies analysing the vertically integrated structures acknowledge the data problems. This paper partly overcomes this difficulty by using the survey of farms in Orel oblast, including 11 agroholdings (data from 1999-2003) and bookkeeping data of 268 farms (182 – agroholdings’ members and 86 independent farms) in Belgorod oblast (2001-2003). The data from Belgorod oblast are limited in terms of variables available and therefore are used in testing the first two hypotheses. The rest of the analysis is performed by using the survey data from Orel oblast. The survey was conducted in 2004 and its further description can be found in (Bokusheva et al., 2007) and Appendix 2.
5 Results
5.1 Aggregated data analysis
As a first step in our analysis we compare average values of labour productivity across various groups of farming units by using three sources of data: survey results, bookkeeping data and statistical yearbooks.
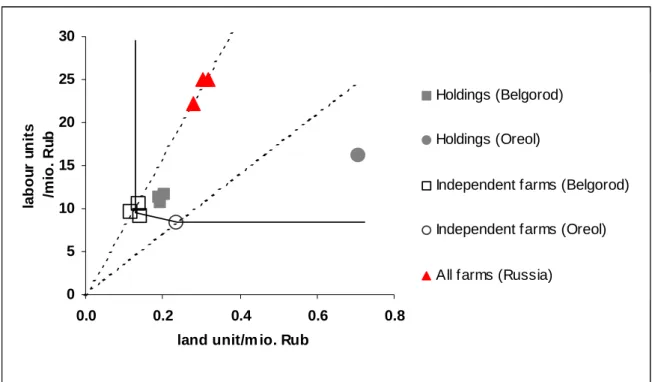
Figure 1: Choice of Technology by Farm Type and Region
0 5 10 15 20 25 30 0.0 0.2 0.4 0.6 0.8
land unit/m io. Rub
la b o u r u n it s /m io . R u b Holdings (Belgorod) Holdings (Oreol)
Independent farms (Belgorod) Independent farms (Oreol) All farms (Russia)
Source: Goskomstat Rossii (2003), Bookkeeping results of holdings, Oblast Belgorod (data for
2001-2003), Data on farms in Oblast Oreol in 2002 (Petrikov, 2005).
Figure 1 presents the inverse indicators of land and labour productivity for 5 different groups of farms: agroholdings in Belgorod and Oroel regions and independent corporate farms in these two regions as well as in Russia in general. Promptly we can recognise that in both regions, agroholdings operate more labour extensive than independent Russian farms. This supports the empirical evidence that agroholdings make significant investments in order to adjust agricultural technology (see Rylko and Jolly, 2005, Petrikov, 2005a). Moreover, there is an indication that investment has primarily labour-saving than land-saving characteristics since only the first mentioned type of investment leads to a tightening of the
land–man ratio due to cultivation of a given amount of land with a lower labour input (Hayami and Ruttan, 1985).
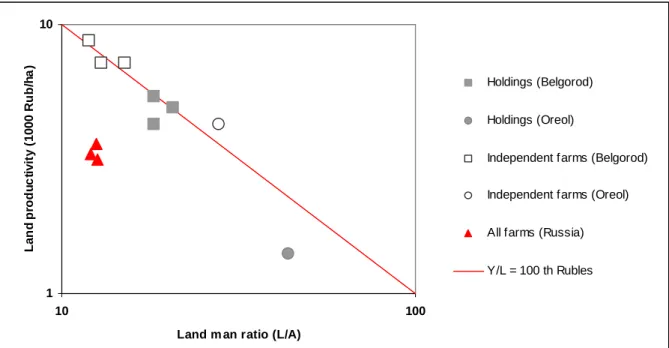
Figure 1 also indicates that the switch of technologies does not necessarily lead to an increase of efficiency: Assuming constant returns to scale, units isoquants (in 1 mio Roubles) can be introduced into Figure 1. Considering the different natural conditions in Belgorod and Oreol the efficient isoquants are defined by the independent farms in the two regions. Agroholdings are located within the regional input requirement set, suggesting that on average they are operating less efficiently than the independent enterprises in the respective regions. Figure 2: Efficiency of Agricultural Production by Farm Type
1 10
10 100
Land m an ratio (L/A)
La n d p rod u c ti v it y ( 1 0 0 0 R u b /h a ) Holdings (Belgorod) Holdings (Oreol)
Independent farms (Belgorod)
Independent farms (Oreol)
All farms (Russia)
Y/L = 100 th Rubles
Source: Goskomstat Rossii (2003), Bookkeeping results of holdings, Oblast Belgorod (data for
2001-2003), Data on farms in Oblast Oreol in 2002 (Petrikov, 2005).
However, with significant investment in labour saving technologies it could be expected that the labour partial productivity would be higher in agroholdings than in other farms. Figure 2 shows that there are three groups of farms which have almost the same labour productivity amounting to 100 thousand Roubles per labour unit. To them belong the corporate farms (agroholdings and independent farms) in Belgorod as well as the independent
corporate farms in Oreol. The figure also provides that the labour productivity in the agroholdings’ members is not in any case larger than in other farms. This finding confirms the result deduced from figure 1 regarding the efficiency of the different groups of farms. Thus, there is an indication for that the "remuneration" argument fails to hold, i.e. that fostering the establishing of agroholdings is insufficient to guarantee an efficient use of the absorbed resources (land and labour).
5.2 Farm individual analysis
The results based on aggregated characteristics (Figures 1 and 2) surprisingly signal that despite investment in modern technologies agroholdings appear to be less efficient than other farms. In the following, employing the results of a survey conducted in 2004 in Oreol oblast, we discuss the development of agroholdings by using the individual farm level data.
Tables 1 to 3 present individual characteristics of 11 agroholdings members in comparison with those of 19 independent farms in Oroel oblast averaged across years 1999-2003, unless stated otherwise. The significance of differences between groups is evaluated by employing t-test of difference between group means.
Table 1 presents some survey results regarding the physical environment. The group of farms that are part of an agroholding is significantly larger which is in line with observations in earlier studies. Agroholdings also exhibit a higher scale efficiency and a larger number of agroholding-members operate at efficient scale (see also Table 3). Farm location is supposed to determine physical environment and because mother companies of agroholdings would rather select farms that operate within a favorable natural environment, the agroholding members would have higher land quality than other farms. Farm location would also predetermine market infrastructure and access to input and output markets, which is expected to be favorable for agroholding members. Table 1 shows that the central companies select those farms that are endued with highly productive land. This is also an indication for that
transport cost and the access to the input and factor markets influence the location decisions of agroholdings. However, the variables which should capture the market infrastructure are of minor importance. Only the access to the equipment market seems to be significantly different for agroholding members and independent farms. These findings are not too surprising, since they indicate that the regional effects appear to be more important than the firm specific effects. In addition, the significant difference between the groups regarding the access to equipment may be endogenous. Since traders know, which farms are the part of an agroholding, they may put more attention to these farms through better information provision and special marketing offers. Some additional indications for this effect are shown in Table 2.
Table 1: Survey results regarding physical environment mean: sample standard deviatio: sample mean: agrohol-dings mean: indepen-dent farms test
statistics ficancesigni-1 average soil productivity index,
points (on the scale of 1 to 100) 47.65 15.50 57.19 40.34 3.64
+
output specialisation, %6) 0.64 0.18 0.74 0.61 2.88
+
Total agricultural land,
ha 8371 6767 14519 4894 4.45
+
Workers in agriculture,
man 233 137 334 177 3.17
+
Livestock, heads 902 771 869 802 0.31 n.s.
Fixed capital, 000Rub
2003 40159 54760 66459 24248 1.72
+
size
Total revenue, 000Rub
2003 22383 19815 23830 19742 0.63 n.s.
qualified
managers2) 2.07 0.58 2.09 2.00 0.44 n.s.
labour:
opportuni- ties to hire skilled workers2) 2.20 0.66 2.36 2.06 1.28 n.s.
material inputs 3) 2.07 0.52 2.00 2.11 -0.24 n.s. inputs equipment 3) 1.87 0.94 2.18 1.61 1.85
+
marke t infra stru ctu re output market 3) 2.10 0.66 2.27 2.00 1.25 n.s.d infr astr tdistance to regional
average distance to grain
market, km 62.77 55.60 41.27 66.00 -1.77
-
roads and transport
infrastructure3) 2.27 0.87 2.27 2.28 -0.02 n.s. crop production 2.40 0.77 2.64 2.17 2.06
+
technology level in 20 03 5) livestock 2.07 1.05 2.00 1.94 0.18 n.s.1) plus-sign stands for significantly higher, minus-sign - significantly lower (in both cases at 5 %
significance level); n.s.- not significant;
2) assessed by the farm head, score 1 - ‘no possibility’ to 3 - ‘good possibilities’;
3) assessed by the farm head, score 1 - ‘very bad’ to 5 - ‘very good’.
5) assessed by the farm head, score 1 - ‘technology is dated’ to 5 - ‘one of the most modern
technologies’;
6) share of the revenue of three main outputs in the total farm revenue.
A higher level of vertical and spatial diversification in agroholdings allows to reduce scale of production diversification in their individual members, thus members to an agroholding would tend to have a higher degree of specialization, which is confirmed by the data. The emergence of agroholdings was fostered to overcome management problems. However, in order to implement new management and new technologies farm restructuring was necessary to make the enterprises fit for the market. This would imply that the holding members have higher investment than other farms and that these investments are targeted for the adoption of new technologies.
The results regarding institutional restructuring, economic and social environment are presented in Table 2. While the re-organisation of total labour input is already evident from Figure 1 and 2, the data in Table 2 shows that institutional restructuring concerns not only the number of workers but also the management. Agroholding members have a lower manager to worker ratio than independent farms. In addition, agroholding farms have a new farm head. Additionally, we can see that managers substituted more often in agroholding than in other farms. Moreover, the head of the agroholding members appear to be more risk-loving than his counterparts in independent corporate farms. On the one hand, this may indicate that the new farm heads possess comparatively higher entrepreneurial skill. On the other hand, the more
risk-loving behaviour of agroholdings members may be explained by a lower level of financial risks within an agroholding company. Besides institutional changes at the management level the data in Table 2 also points at the adjustments regarding production technologies in the agroholding members. The investment volume in the agroholding members was significantly higher that in the independent farms. This apparently led to a higher speed of fixed capital formation. In addition, investments in the agroholding members were introduced primarily rather to modernize the production technology than just maintain the existing capital stock. Consistently, the managers of the agroholdings assess their technology level in 2003 as relatively high. However, this regards only crop production, suggesting that the livestock production is of minor importance in the holding members. The assessment of the technology level was done for 1999 and 2003, respectively. The results provide that in 1999 the farms in both groups had a similar level of technology in crop and livestock production. The technology level decreased till 2003 in the independent farms, however this was observable only in livestock production for the agroholding members. The significant difference regarding technology level in crop production in 2003 results from the fact that the holding members consider their technology to be almost the same as in 1999. This result is inconsistent with the finding that the investment has a mainly capital improving character. In addition, there is evidence that adjustments have taken place regarding not only factor input but output as well. The holding members show a significantly higher specialization than the other group of farms.
Table 2: Survey results regarding institutional restructuring, economic and social environment sample mean standard deviation mean: agrohol-dings mean: indepen-dent farms test statistics signi-ficance1 ) age of the enterprise, years 14.8 10.3 6.5 19.7 -5.34
-
new farm head since19932) 0.53 0.51 0.01 0.01 4.14
+
Share of
managers-co-owners, % 0.43 0.50 0.09 0.51 -3.66
-
share of managers worked in farm before
re-structuring, %
0.48 0.26 0.29 0.56 -2.96
-
managers/employees ratio 0.04 0.03 0.03 0.05 -3.33
-
managers education level3) 0.72 0.28 0.74 0.70 0.50 n.s.institutional
risk attitude (risk loving) 4) 2.3 1.0 2.8 2.0 2.27
+
fixed capital growth rate 1.35 0.82 1.75 1.12 1.71+
investments in fixedproduction capital, Mio RUB
4.66 6.50 7.92 2.49 1.92
+
investments in fixed production capital per 1000 ha of agricultural land, Mio RUB
0.58 0.54 0.49 0.53 -0.27 n.s.
structure of investments "capital improving", share in total value of
investments
0.40 0.35 0.54 0.29 1.83
+
bank credits2) 0.60 0.50 0.27 0.83 -3.51
-
bank credits as well as
regional and federal loans2) 0.73 0.45 0.55 0.83 -1.65
-
leverage ratio 0.07 0.13 0.14 0.03 1.78
+
long-term liabilities, Mio
RUB 1.81 2.60 3.21 1.01 1.98
+
average adjusted price of
wheat5) 1.00 0.36 0.87 1.07 -3.62
-
average adjusted price of
milk5) 1.00 0.16 0.92 1.04 -4.40
-
average adjusted price of
fuel5) 1.00 0.27 0.95 1.02 -1.63 n.s.
economic
average adjusted price of
fertilizer5) 1.00 0.25 1.04 0.98 1.54 n.s.
average age of workers 36.3 4.65 38.8 40.4 -0.84 n.s. average age of the
manager 46.4 7.8 43.5 47.8 -1.44 n.s.
annual wages, Rub 15590 5410 14950 15490 -0.28 n.s.
1) plus-sign stands for significantly higher, minus-sign - significantly lower (in both cases at 5 %
significance level); n.s.- not significant;
2) dummy variable;
3) share of managers with higher education;
4) assessed, score 1 – ‘risk averse’ to 5 - ‘risk loving’;
5) In this case test was conducted employing the data over the whole period. To adjust the data for the
impact of inflation for each farm the price was adjusted by the annual sample average.
6) assessed, score 1 – ‘no problems’ to 5 - ‘very many problems’.
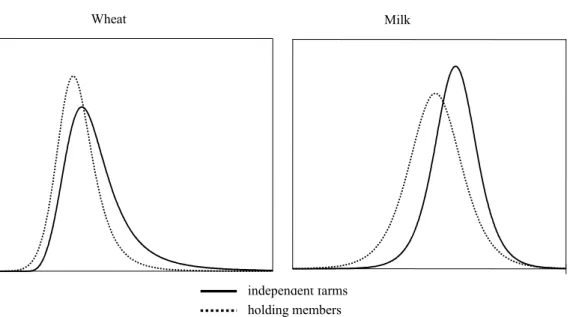
As a part of economic environment, the structure of financial obligations is reported in Table 2. Long-term liabilities are significantly higher in the agroholding members than in independent agricultural enterprises. However, the agroholding members access the importance of the conventional creditors lower than the independent enterprises. This suggests that the holding members have additional opportunities to raise fund for investment. This also supports the statement that the mother companies provide the corresponding financial means. The analysis of economic performance based on monetary indicators as revenue and profit only, may lead to a biased assessment, if individual stages of a vertically organized company regarded as independent economic units. The survey data confirm that the agroholding members get significantly lower output prices and higher input prces. For dairy farms operating in the Moscow Region, Bezlepkina et al (2007) find a clear tendency of better performing farms paying substantially higher wages and receiving higher output prices, presumably due to higher quality. The results are opposite in this study. Figure 3 presents the distributions of output prices for wheat and milk in both groups of farms. There could be two explanations for this empirical result: 1) Output prices in the agroholdings are lower, because they are adjusted by a risk premium, i.e. since farmers’ price risks reduced within an agroholding, they do pay for that; 2) Agroholding members are restricted in their choice of the marketing channels and thus cannot draw the best obtainable prices. As can be also seen from
Table 2, the bank loans are less important for the agroholding members than for independent farms. This suggests that agroholding members possess other sources of finance, as those of the mother company of the agroholding. One might expect that the agroholding members are obliged to repay a part of these credits by the delivery of their products to agroholding-owned marketing agencies. The prices received by the farms then have the character of transfer instead of market prices.
Figure 3: Distribution of output prices
holding members independent farms
Wheat Milk
Note: The price distributions were derived for the 1999-2003 period. In each farm prices were adjusted by the annual average in order to adjust the data for the impact of inflation.
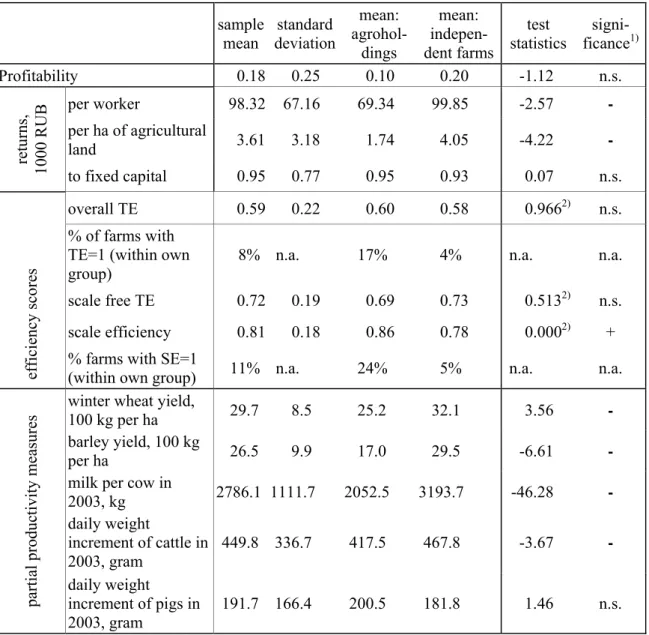
Table 3: Survey results regarding performance sample mean standard deviation mean: agrohol-dings mean: indepen-dent farms test statistics signi-ficance1) Profitability 0.18 0.25 0.10 0.20 -1.12 n.s. per worker 98.32 67.16 69.34 99.85 -2.57 - per ha of agricultural land 3.61 3.18 1.74 4.05 -4.22 - returns, 1000 RUB to fixed capital 0.95 0.77 0.95 0.93 0.07 n.s. overall TE 0.59 0.22 0.60 0.58 0.9662) n.s. % of farms with TE=1 (within own group)
8% n.a. 17% 4% n.a. n.a.
scale free TE 0.72 0.19 0.69 0.73 0.5132) n.s.
scale efficiency 0.81 0.18 0.86 0.78 0.0002) +
efficiency sco
res
% farms with SE=1
(within own group) 11% n.a. 24% 5% n.a. n.a.
winter wheat yield,
100 kg per ha 29.7 8.5 25.2 32.1 3.56 -
barley yield, 100 kg
per ha 26.5 9.9 17.0 29.5 -6.61 -
milk per cow in
2003, kg 2786.1 1111.7 2052.5 3193.7 -46.28 - daily weight increment of cattle in 2003, gram 449.8 336.7 417.5 467.8 -3.67 - partial produc tivity measures daily weight increment of pigs in 2003, gram 191.7 166.4 200.5 181.8 1.46 n.s.
1) plus-sign stands for significantly higher, minus-sign - significantly lower (in both cases at 5 %
significance level); n.s.- not significant;
2) p-value for Kruskal-Wallis non-parametric test
The statistical significance of differences in overall TE, scale free TE and scale efficiency is assessed using a non-parametric Kruskal-Wallis test. A non-parametric test is required here because the technical efficiencies are effectively censored between zero and one. The information presented in Table 3 is also consistent with the conjectures resulting from Figures 1 and 2. Agroholding members neither show a higher profitability, nor do they allow for a higher remuneration of factors. The efficiency scores between the groups of farms do also not show any statistically significant differences. Scale efficiency is higher in
agroholdings signalling that they are closer to optimal scale, which is also observed in the higher number of agroholding members operating at efficient scale (farms with scale efficiency equals 1).
In conclusion, the favorable location, improved technological adjustments and new management introduced by agroholdings suggest that they presumably possess serious advantages compared to other agricultural enterprises in Russia. Surprisingly, according to our results, these advantages presumably have not enabled them to reach a higher economic performance.
5. Discussion and Conclusions
The lack of performance in agroholding members suggests that principal management problems are present in agroholdings that hamper making further step towards higher efficiency and productivity. These developments show that technological and managerial innovations introduced by agroholdings not necessarily move agricultural production on an
efficient trajectory. This finding is consistent with statements of holding managers that can be found in the literature, but also with assessment of politicians. Despite a tendency towards integration, some recent developments support the view that agroholdings are not first best solutions in either case. The first attempts of disposing the agricultural enterprises by agroholdings (e.g. GAZPROM, TATNEFT, RAZGULIAY-UKRROS, Interfax, various issues) signal that gas and oil companies are not interested in agriculture as part of their business. According to the Governor of Belgorod oblast, only eight of the fifteen agroholdings operating in oblast have fulfilled the expectation regarding the adoption of technological and organisational innovations. The other seven companies failed either because of insufficient investment or because of the managerial failures.
Finding no evidence for improved performance of agricultural producers that are agroholding members does not suggest that agroholding will fail in any case. Membership to a holding can take different forms from ownership to contractual arrangements and different types of relationships will have different performances as well. Literature suggests various reasons for economies of integration and provides the opposing conclusions as the result of different underlying assumptions. Leiblein et al (2002) conclude that decisions to integrate per se do not significantly influence technological performance directly, rather the performance is driven by factors underlying governance choice. In this sense our data set is biased, because in both regions the establishing of agroholdings was strongly supported by the local government. Further investigations on the impact of a membership to an agroholding on performance should control for factors leading to integration.
References
Baklashenko, G., 2000. Agropromyshlennye holdingi – osnova hozyajstvennoj hierarhii ekonomiki perehodnogo perioda (Agroindustrial holdings – basis of economic hierarchy in the economy of transition period). APK: Ekonomika i Upravlenie 11 (November).
Bezlepkina, I., R. Huirne, A. Oude Lansink, and A. Oskam, 2007. Analysing variation in Russian dairy farms, 1990-2001. Quarterly Journal of International Agriculture 46 (1), p. XX-XX.
Bhuyan, S., 2001. Impact of vertical metgers on food industry profitability: An empirical evaluation. American Agricultural Economics Association
(http://agecon.lib.umn.edu/cgi-bin/pdf_view.pl?paperid=2778&ftype=.pdf).
Bokusheva, R., V. Valentinov and V. Anpilogova, 2007: The Investment behaviour of Russian farms. Post-Communist Economies (forthcoming).
Coelli, T., D. S. P. Rao, and G. E. Battese, 1998. An Introduction to Efficiency and Productivity Analysis. Kluwer Academic Publisher, Dordrecht, 275 p.
Daveni, R. A. and D. J. Ravenscraft, 1994. Economies Of Integration Versus Bureaucracy Costs - Does Vertical Integration Improve Performance. Academy Of Management Journal 37 (5), p. 1167-1206.
Fare, R., S. Grosskopf, and C. A. K. Lovell, 1994. Production Frontiers. University Press, Cambridge, 296 p.
Goskomstat, 2004. Rossiiskyi statisticheskyi ezhegodnik [Russian statistical year book, in Russian]. Goskomstat, State Statistical Agency, Moscow p.
Goskomstat, 2005. Rossiiskyi statisticheskyi ezhegodnik [Russian statistical year book, in Russian]. Goskomstat, State Statistical Agency, Moscow p.
Hayami, Y.and R. W Ruttan, 1985. Agricultural Development. An International Perspective, Baltimore. 2nd ed.
Hockmann, H., 2005. Giant enterprises in Russian agriculture: a promising model for Russia? In IAMO-2005. Halle, Germany, p. 37-42.
Hockmann, H., J. Wandel, and A. Nedoborovskyy, 2005. Agroholdings in Russia: Breaking the vicious circle? 94th EAAE Seminar "From household to firms with independent legal status: The spectrum of institutional units in the development of European Agriculture", Imperial College, Wye Campus, UK, April 9-10.
Hockmann, H.; Wandel, J.; Shaikin, V., 2003. Integrated Structures in the Russian Agro-Food Sector, in: Faculty of Economics, Split (ed.): Enterprises in Transition: Proceedings. Fifth International Conference on Enterprise in Transition, Split-Tučepi, May 22 -24, S. 1234 - 1254.
Jaspers, F. and J. van den Ende, 2006. The organizational form of vertical relationships: Dimensions of integration. Industrial Marketing Management 35 (7), p. 819-828. Keller, T., 1993. Unternehmensführung mit Holdingkonzepten, 2. Aufl., Köln.
Khramova, I.G., 2002. Vertikal’naja integracija v prodovol’stvennom komplekse Rossii (Vertikale Integration im Ernährungssektor Rrusslands), in: Institut ekonomiki perechodnogo perioda (Hrsg.): Problemy agroprodovol’stvennogo sektora (Probleme des Agrar- und Ernährungssektors), Naučnye trudy, No. 47R, Moskau, S. 112 – 141. Khramova, I.G., 2003. Vertikal’naja integracija v prodovol’stvennom komplekse Rossii
[dejatel’nost’ agrocholdingov] (Vertikale Integration im Ernährungssektor Rrusslands [die Tätigkeit von Agroholdings]), Institut ekonomiki perechodnogo perioda. Publikacija Naučnye trudi, Nr. 47, Moskva.
Koester, U., 2005. A revival of large farms in Eastern Europe – how important are institutions?, in: Agricultural Economics, Bd. 32, Nr. s1, S. 103 -114.
Kurtoeva, L. M., 2003. Funkcionirovanie agrocholdingov v sfere APK Rossijskoj Federacii v 2001 godu [Finctioning of agroholdings in agro-industrial complex of Russian
Federation in 2001, in Russian]. Informacionnyj bjulleten Ministerstva sel’skogo chozjajstva Rossijskoj Federacii 3-4, p. 53 - 56.
Leiblein, M. J., J. J. Reuer, and F. Dalsace, 2002. Do make or buy decisions matter? The influence of organisational governance on technological performance. Strategic Management Journal 23, p. 817-833.
Mazloev, V.Z., Kumechov, K.K., 2001. Agropromyšlennye ob‘‘edinenija choldingovogo tipa (Holdingartige agro-industrielle Vereinigungen), in: Ekonomika sel’skochozjajstvennych i pererabatyvajuščich predprijatij, 7/2001, S. 12 – 14 und 8/2001, S. 11-12.
Miloserdov, V.V., 2002. Mnogoukladnaja ekonomika APK: sostojanie i perspektivy (Die durch vielfältige Unternehmensformen gekennzeichnete Wirtschaft des AIK: Zustand und Perspektiven), in: APK, 2/2002, S. 10 – 20.
Ministerstvo sel’skogo chozjajstva Rossijskoj Federacii, 2001. Posobie po voprosam funkcionirovanija finansovo-promyšlennych grupp i drugich agropromyšlennych
formirovanij (Handbuch zu Fragen der Funktionsweise Finanz-Industrieller Gruppen und anderer agro-industrieller Formationen), Moskva.
Oganesov, R., 2004. Agroholdingi v sel'skom khoziaistve Rossii [Agroholdings in Russian agriculture] (in Russian). Ekonomika sel'skokhoziaistvennykh i pererabatyvaiushchikh predpriiatii 10, p. 52-53.
Petrikov, A., 2005a. Tendenzii razvitiya integrirovannych agropromyshlennyh formirovanij (Trends in the development of agroindustrial formations). APK: Ekonomika i Upravlenie. Vol.1 (January). Moscow.
Petrikov, A., 2005b. Tendencii razvitija integrirovannych agropromyšlennych formirovanij, in: APK, Nr. 1/2005, S. 26 – 32.
Rodionova, O.A. (2002): Agropromyšlennaja integracija: tendencii, mechanizmy realizacii (Agro-industrielle Integration: Tendenzen, Verfahren der Realisierung), Moskau.
Rodionova, O.A.; Dackova, E.V., 2005. Institucional’nye preobrazovanija i razvitie integracionnych processov v APK, in: Ekonomika sel’skochozjajstvennych i pererabatyvajuščich predprijatij, 1/2005, S. 39 – 42.
Rosstat, 2006. Rossiiskii statisticheskii ezhegodnik – 2005. [Russian statistical yearbook] (in Russian). Rosstat, Moscow p.
Rylko, D.N. (2002): New Agricultural Operators, Input Markets and Vertical Sector Coordination, in: IET (ed.): Rynki faktorov proizvodstva v APK Rossii: perspektivy analiza. Materialy naučnoj konferencii 6-7 ijulja 2001 g., Golicino – II, Moskva, S. 50 - 74.
Rylko, D.N.; Jolly, R.W., 2005. Russia’s New Agricultural Operators: Their Emergence, Growth and Impact, in: Comparative Economic Studies, Vol. 47, No. 1, S. 115 – 126. Serova, E.; Khramova, I.; Nichols, J., 2001. OGO: Vertikal’naja integracija v
agroprodovol’stvennom sektore (OGO: Vertikale Integration im Agrar- und Ernährungssektor), Internet: http://www.iet.ru/afe/projects/ogo.pdf.
Ušačev, I.G., 2002. Razvitie integracionnych processov v APK Belgorodskoj oblasti (Die Entwicklung der Integrationsprozesse im AIK des Oblasts Belgorod), in: Ekonomika sel’skochozjajstvennych i pererabatyvajuščich predprijatij, Nr. 2; S. 6 – 10.
VNIIECh (Vserossijskij naučno-issledovatel’skij institut ekonomiki sel’skogo chozjajstvo RASChN) (Hrsg.), 2002. Agropromyšlennye formirovanija choldingogo tipa (Holdingartige agro-industrielle Formationen), Moskau.
Wandel, J., 2000. Vertical Integration in the Russian Agro-food Sector, in: Wehrheim, P., Serova, E., Frohberg, K., von Braun, J. (Hrsg.): Russia's Food Economy Towards Truly Functioning Markets, Dordrecht, S. 359-382..
Wandel, J., 2005. Russlands Agrarpolitik unter Putin: Eine Bewertung vor dem Hintergrund des Problems der konstitutionellen Unwissenheit, Studien zur Ordnungsökonomik Nr. 30, Stuttgart.
Zlobin, E., 2002. Agroholdingi - nadeshnyj variant vyhoda APK iz krizisa (Agroholdings: a save option for solving crisis situation in APK). APK: Ekonomika i Upravlenie 12 (December).
Appendix A: Farm survey description
The study is based on data obtained in the framework of a farm survaey of 90 agricultural enterprises from different regions in Russia including 30 farms from Orel. The data contains results of structured interviews with farm managers conducted in 2004, as well as farm accounting data from 1999 to 2003. In this paper, we utilise the data which is related to:
- basic characteristics of the farm: farm age, year of restructuring, farm location;
- enterprise organisation: farm organisational form, membership in agricultural holding company, etc.;
- managerial characteristics: farm director and management age, education, on-farm experience and attitude toward risk;
- production-related characteristics: size of land operated, number of livestock, number of workers, specialisation, other production aspects;
- farm finance: liquidity, leverage ratio, credit access, investment activities and volume, as well as investment financing sources and use;
- business environment: input and output market infrastructure, opportunity to employ well-educated and experienced managers and skilled workers, provision of risk sharing instruments and training services;
- risk sources and management: farmers’ assessment of various sources of risk (production, price, financial risk, etc.) and their responses to them.
In this study we focus on the farms from the Oroel region whose part of agroholdings is large enough for a comparison with other corporate farms. Of the total number of surveyed farms in Oroel, 11 are the members of different agroholdings. 10 of them are private companies and one is a production cooperative. The remaining 19 farms are represeted by 8 private companies, 9 cooperatives and 2 state-owned enterprises.
The additional data on the farms - members of agroholdings contains the year of joining an agroholding, the managerial and production adjustments introduced at the farms since that time, information about the share of the agroholding company in the farm equity and vice versa, as well as information about the sectors where other members of the agroholding are from.
Farms were not selected randomly. In view of most farms’ unwillingness to provide their internal data, most of the sample farms were selected on the basis of the established contacts of the regional extension office. However, farm selection was done considering two main
aspects: the sample comprises farms of different organisational forms and financial performance; farms with very strong specialisation (potato or vegetable production farms, poultry, as well as breeding farms) were not included in the sample.
The investigated farms are primarily crop-producing farms with varying livestock holdings. On average, the share of revenue from crop production is 64 per cent.
Appendix B: Efficiency analysis
The Data Envelopment Analysis (DEA) technique allows for both input and output orientation. In this study an input oriented model with the objective to produce the observed outputs with as little inputs as possible is used (Fare et al, 1994). Schematically, the
production technology L transforming factors of production (inputs x1 and x2) into a single
output (y) is presented in Figure 1.
x2 S L(y) •A •B S’ 0 x1
Figure : Input orientation with inputs x1 and x2
L(y) denotes the subset of all input vectors (with a frontier of SS’) which yield at least y. In this case, the efficiency of production units in the interior of the frontier, can be
measured by the distance to the frontier. For example, if a firm produces at point A, then its efficiency can be measured with the ratio of OB/OA.
DEA uses a piece-wise linear convex hull approach for frontier estimation. This can be achieved with mathematical programming (MP). Assuming there are data on K inputs and M outputs for each of N farms and variable returns to scale (VRS), pure technical efficiency (PTE) can be computed from the following linear programming (LP) model:
min λn (1) subject to y ≤
∑
N z y , m=1…M= ,
,
,
where λn stands for input-oriented technical efficiency, zn are intensity variables. The value of λn attained is the pure technical efficiency score for the n-th firm. It will satisfy: λn ≤ 1, wi
For the purposes of the analysis of technical efficiency we measure the farm’s production output as annual farm revenues from agricultural production. The output function is a function
n 1 n nm m n
∑
, k=1…K = ≥ N n n k n n k n x z x 1 , , λ∑
(VRS) = ≥ N n n z 1 0∑
= = N n n z 1 1th a value of 1 indicating a point on the frontier and hence a technically efficient firm. The linear programming problem must be solved N times, once for each firm in the sample. Overall technical efficiency is decomposed into its two components: (a) scale efficiency and (b) pure technical efficiency (Fare et al., 1994). These calculations imply some standard changes in model (1), which can be found in (Fare et al, 1994; Coelli, 1998). The resulting decomposition of the overall technical efficiency measure is then looks as follows:
overall TE = scale free TE x scale efficiency.
of the area of sown land, labour defined as the annual average number of employees involved in production, the value of fixed production capital, materials costs and time dummies. All monetary data were measured in 1,000 roubles and adjusted to the year 2003 by the regional price indices for agricultural inputs and output as they are provided by (Goskomstat, 2004 and 2005).