No. 09, Arthur’s Place, Colombo 4
Sri Lanka
INSURANCE
SECTOR UPDATE
RAM Ratings Lanka Wholly owned by RAM Holdings Berhad
T +94 112 553089 +94 112 503551
F +94 112 553090
W www.ram.com.lk
Bright Prospects Despite
Regulatory Changes
Analytical Contact:
Khailash Weeralingam
ACMA, BSc. (Hons)Assistant Manager
(94) 11 2553089
[email protected]
Prashani Illangasekera
MSc. (Fin), BAAssistant Manager
(94) 11 2503551
[email protected]
Company Contact:
Adrian Perera
MBA, FCMA (UK), FCCA, FCMA, MCPM, AIB
Chief Executive Officer
(94) 11 2596099
[email protected]
2
RAM Ratings (Lanka) Ltd
Summary
The Sri Lankan insurance sector has been gradually recovering from the economic slump in 2008/09. Premiums in the general segment, which had contracted in 2009, staged a strong rebound in the first half of 2010. Similarly, the life-insurance industry had picked up pace, recording a double-digit growth in premiums over the same period as opposed to the relative standstill a year earlier. Notably, the growth has been supported by the general improvement in macroeconomic conditions. Going forward, RAM Ratings Lanka envisages the industry to keep up this positive trend, supported by more robust economic growth and greater penetration in the northern and eastern regions of the country.
The insurance sector accounted for a relatively small portion of the domestic financial industry, making up only 3.2% of the entire system’s financial assets as at end-December 2009. Moreover, the insurance penetration rate is also lower than those of other Asian countries, with total premiums per capita coming up to a mere USD30.10 as of end-December 2009 (end-December 2008: USD29.40). We observe that several new players entered the insurance arena last year. At the same time, the more established players have shifted from price-based competition to focus more on service quality.
With the industry poised for growth, the Insurance Board of Sri Lanka (“IBSL” or “the regulator”) is in the process of enforcing a new regulatory framework. Mainly, composite insurance companies will be required to split their existing general and life businesses into separate legal entities. Listing on the local stock exchange will also be made mandatory, with the incumbents and new entrants given a respective 5 years and 3 years to comply. Meanwhile, the rules on solvency margins have been revamped, with a view to broadening the classification of assets recognised as admissible.
Through these initiatives, the regulator intends to bring the local insurance sector more in line with international norms; they would also support a more vibrant investment market. RAM Ratings Lanka envisages the changes in classification to improve the existing players’ solvency margins, as many of them presently exclude these investments. Meanwhile, the IBSL has also permitted foreign-currency investments. These moves will provide insurers more avenues for investment. Over the medium term, the regulator intends to implement risk-based capital supervision - currently practiced by banks. While these changes are viewed positively, we note that the new regulations will expose insurers to operational and foreign-exchange risks.
Meanwhile, the industry’s general insurance claims have remained relatively stable, hovering at around 62% for the general segment. Additionally, the combined ratio for this segment has been kept above 100%, signifying that general insurance companies have been incurring underwriting losses. Consequently, they have been relying on investment returns for profits. Nonetheless, RAM Ratings Lanka notes that most general insurance companies in other South Asian markets are also reporting underwriting losses. Going forward, claims in the general segment are expected to increase due to the heavy floods in 2010 and early this year. At the same time, we note that its impact on insurers’ bottom lines may be offset by an expansion in premiums, supported by the more conducive economic climate.
3
RAM Ratings (Lanka) Ltd
Conversely, the life segment has experienced an increase in claims among RAM Ratings’ rated companies as well as listed companies. This has been mainly due to policy lapses brought on by the harsh economic landscape. Unlike the general segment, most life insurers are currently earning underwriting profits as the life market has yet to mature and claims will only arise over the long-term. Given the low penetration rate in the life insurance market, we believe that there is still room for growth. We expect claims in this segment to ease over the medium term, as the sector expands against the backdrop of the improving economic conditions while replenishing maturing contracts.
In terms of financial performance, insurance companies have been shifting their investments to the booming equity market to maintain their investment income as interest rates taper. Traditionally, investment income has mainly stemmed from fixed-income securities, buoyed by the previously high interest rates. As such, insurance companies have been able to maintain their financial performance. With regulations permitting a wider range of investments, investment appraisal and monitoring will play a greater role within each company. In the medium term, overheads may experience upward pressure as insurance companies seek to expand their branch networks into the northern and eastern provinces of Sri Lanka.
Regulations
Changes in regulatory framework
The IBSL is in the process of revamping the current regulatory framework. In this regard, the regulator has already issued a directive requiring composite insurers to split their life and general businesses into separate legal entities; companies have been given 4 years to comply with this requirement. RAM Ratings Lanka notes that the larger and more well-established players are composite insurers; the separation of their businesses is seen as a challenge, exposing each player to operational risk during the transition period. At the same time, we derive some comfort from the relatively long period given by the IBSL to adhere to the regulations. In addition to segregation, the incumbents are expected to list each business line on the local stock exchange in the next 5 years.
Wider variety of investments permitted
Meanwhile, foreign-currency investments (limited to 20% of insurers’ technical reserves or long-term funds) have also been allowed, giving local companies the opportunity to tap diverse investment opportunities abroad. On top of that, the regulator is has issued fresh solvency regulations in 2011, thus widening the range of investments acceptable as admissible assets and refining the definition of investments. These initiatives are viewed positively as they broaden investment avenues for insurers.
Only local reinsurer to come under purview of IBSL
The National Insurance Trust Fund (“NITF”) will also come under the purview of the IBSL. The NITF is at present the only reinsurer in the country and comes under the purview of the ministry of finance local insurance players must cede 20% of their reinsurance premiums to the NITF. However, we note that the NITF is at liberty to decline reinsurance premiums if the reinsured amount exceeds its capacity. In addition, it operates the health insurance scheme for civil servants (known as Agrahara) and runs a general-insurance business. Government departments are required to obtain insurance coverage, only from either the NITF or Sri Lanka Insurance Cooperation, the other state-owned insurer.
4
RAM Ratings (Lanka) Ltd
Competitive Position
Competitive position - key rating factor
From a credit perspective, a major factor in arriving at an insurer’s claims-paying ability rating is the company’s competitive position. Larger players are able to diversify their risks over greater numbers and a bigger geographical area. In this regard, broader and more efficient distribution channels support healthy diversification of their premium bases. At the same time, we note that some players have benefited from their association with larger conglomerates and financial institutions.
Smaller players exerting pressure on larger ones’ market shares
While the insurance sector is dominated by several large players, competition is intense as the small companies erode their market shares. At present, there are 19 insurance companies, 12 of which are composite players, i.e. engaged in both general and life insurance. Of the rest, 5 specialise in general insurance while 2 deal solely in life insurance. The top 5 companies account for the lion’s share of the industry’s premiums, making up 84.63% of its total gross written premiums (“GWPs”) as at end-December 2009. At the same time, the small players have been chipping away at the larger players’ (the top 5) market shares, expanding their own from 12.94% as at end-December 2008 to 14.63% a year later (refer to Chart 1). Going forward, we expect the smaller insurers to continue exerting pressure on their larger peers’ market shares due to their strategy of lower prices.
Chart 1: Market shares of the 5 largest insurance companies
27.63% 24.46% 25.68% 23.45% 23.72% 34.46% 35.50% 33.15% 33.60% 29.00% 10.86% 10.73% 10.90% 11.01% 12.46% 8.54% 9.43% 9.59% 9.78% 10.29% 9.85% 9.59% 9.41% 9.22% 9.90% 8.66% 10.29% 11.26% 12.94% 14.63%
December 2005 December 2006 December 2007 December 2008 December 2009
C o m p o si te p rem iu m m a rk et s h a re
Sri Lanka Insurance Corporation Ceylinco Insurance PLC Aviva NDB Insurance PLC
Union Assurance PLC Janashakthi Insurance PLC Others
5
RAM Ratings (Lanka) Ltd
Larger players focus on service quality
We expect the overall industry’s premiums to experience downward pressure. Nonetheless, we observe that the more established players are focusing on service quality to attract and retain clients. This could well be because products, especially in the general segment, are relatively homogeneous. Meanwhile, the larger insurers have also been placing greater emphasis on the bottom of the economic pyramid through micro-insurance.
Affected by slump in 2009...
The domestic insurance industry has been showing signs of recovery after the decline experienced in 2009. The industry’s overall composite premiums receded 1.57% to LKR 57.25 billion as at end-December 2009 (end-December 2008: LKR 58.17 billion), mainly due to a LKR 1.07 billion reduction in premiums in the general segment, to LKR 33.48 billion. The contraction reflects the slump in the both the motor and marine sub-segments, which posted respective contractions of LKR 888.59 million and LKR 384.10 million. These sub-segments had been negatively affected by the deceleration of both the domestic economy and international trade. Meanwhile, the life insurance segment remained relatively unchanged, recording a growth of 0.65% to LKR 23.77 billion as at end-December 2009 (end-December 2008: LKR 23.61 billion) (refer to Chart 2).
...but recovered in 2010
Nonetheless, the entire industry staged a rebound in 2010, in line with the economic recovery. The general segment recorded a 7.5% year-on-year (“y-o-y”) growth in the 1H 2010, as opposed to a 3.1% y-o-y contraction in 1H 2009. At the same time, premiums in the life segment ascended 16.0% y-o-y. Prospectively, we expect the industry to continue its positive trend, supported by stronger economic growth and greater penetration in the northern and eastern regions. Besides, the penetration rate for the life segment is still relatively low, with only 26.4% of the labour force insured as at end-December 2009. As such, this segment still has much growth potential.
Chart 2: Industry premium growth vs GDP growth
2005 2006 2007 2008 2009 1H 2010 General 31.54% 15.71% 20.15% 10.90% -3.09% 7.50% Life 18.35% 15.46% 21.19% 13.91% 0.65% 16.00% GDP Growth 6.20% 7.70% 6.80% 6.00% 3.50% 7.80% -5.00% 0.00% 5.00% 10.00% 15.00% 20.00% 25.00% 30.00% 35.00% Pr e m iu m / G D P G ro w th
6
RAM Ratings (Lanka) Ltd
Insurance sector expected to augment branch network over medium term
Insurance companies are also diversifying their distribution channels, with companies attached to banks and larger conglomerates leveraging on their respective groups’ existing branch networks. Nonetheless, insurance brokers remain a key source of premiums for insurance companies, contributing 25.98% of the industry’s general insurance premiums. Apart from brokers, companies are also focusing on other distribution channels, including the Internet. Few new branches were added to the overall industry’s reach, with the total standing at 926 as at end-December 2009 (end-December 2008: 921, end-December 2007: 681). With the north and east opening up after the end of the 3-decade-long civil war, however, insurance companies have been quick to establish a presence.
Underwriting quality and risk exposure
Financial performance reflects underwriting standardsUnderwriting quality plays a key role in the financial stability of an insurer; inappropriately priced policies may lead to losses when claims are made, thereby suppressing a company’s performance. On this score, the claims ratio is used as a general measure of underwriting effectiveness. In the Sri Lankan context, the general segment is segregated into 4 categories: fire, marine, motor and miscellaneous. Claims in each segment vary according to their respective levels of risk. Moreover, in a detarrifed market underwriting standards become a key issue, especially with regard to the general segment.
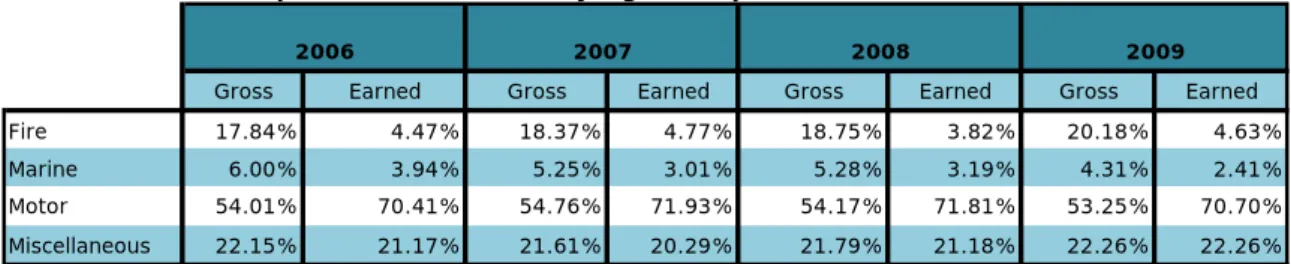
Motor sub-segment dominates general insurance industry
The general insurance industry’s gross written premiums are dominated by the motor sub-segment taking up 53.25% of its gross written premiums as of end-2009 (refer to Table 1). The miscellaneous sub-segment was the second-largest category, making up 22.26% of the industry’s written premiums as at the same date; this class mainly comprises medical insurance. Although the fire sub-segment accounted for 20.18% of the industry’s gross premiums in 2009, it only constituted 4.63% of the earned premiums.
Table 1: Annual composition of the industry’s general premiums
Gross Earned Gross Earned Gross Earned Gross Earned
Fire 17.84% 4.47% 18.37% 4.77% 18.75% 3.82% 20.18% 4.63%
Marine 6.00% 3.94% 5.25% 3.01% 5.28% 3.19% 4.31% 2.41%
Motor 54.01% 70.41% 54.76% 71.93% 54.17% 71.81% 53.25% 70.70%
Miscellaneous 22.15% 21.17% 21.61% 20.29% 21.79% 21.18% 22.26% 22.26%
2006 2007 2008 2009
Source: IBSL annual report
Fire sub-segment heavily reinsured
The lower earned premiums in the fire sub-segment are due to the higher amount of premiums ceded to reinsurers, thereby transferring excess risk. Fire insurance policies include the protection of high-value buildings and property against natural calamities, which insurance companies may not have the financial capacity to bear. Accordingly, the bulk of these policies are reinsured to limit the impact on local insurance companies. On the other hand, reinsurance for the motor sub-segment is negligible as the premiums here are lower in value and the impact of claims is relatively limited. Consequently, the motor sub-segment accounted for 70.70% of earned premiums in 2009. The miscellaneous sub-segment, meanwhile, maintained its second position, making up 22.26% of the industry’s earned
7
RAM Ratings (Lanka) Ltd
premiums for the same period. Health insurance contracts, which account for the bulk of the miscellaneous sub-segment, are typically not reinsured.
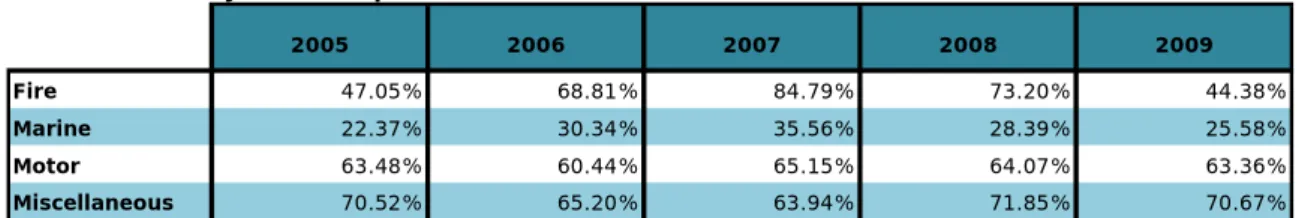
Relatively stable claims in general segment
Claims from the motor sub-segment have remained relatively unchanged at between 60% and 65% in the past 5 years (refer to Table 2). Claims in the fire sub-segment, which generally covers against natural calamities too, have been fluctuating through the years. The claims ratio for this sub-segment came up to 44.38% as at end-2009 - the lowest in the last 5 years. Because of the heavy floods experienced in 2010, however, we expect the claims in this segment to spike. The impact on each insurer will depend on the level of its reinsurance. Notably, claims in the miscellaneous sub-segment are the highest among the 4 sub-classes, mainly due to medical insurance contracts that are mostly loss-making. Despite the losses, we observe that insurers generally provide health insurance coverage to retain clients in the other product segments.
Table 2: Industry claims experience
2005 2006 2007 2008 2009
Fire 47.05% 68.81% 84.79% 73.20% 44.38%
Marine 22.37% 30.34% 35.56% 28.39% 25.58%
Motor 63.48% 60.44% 65.15% 64.07% 63.36%
Miscellaneous 70.52% 65.20% 63.94% 71.85% 70.67%
Source: IBSL annual report
Better premium pricing may check claims ratio
Meanwhile, we note that the overall general insurance claims of the 6 largest insurers (in terms of GWPs) have been relatively stable in the past 3 years (refer to Chart 3). At the same time, we also observe that insurers commanding higher premiums generally have lower claims ratios. We opine that these players are able to adopt a premium pricing strategy because of their service quality and the convenience afforded to their customers. Ultimately, it provides these players more room to absorb risks. That said, it is worth noting that the claims ratio may not adequately the capture additional costs incurred in providing benefits on policies.
8
RAM Ratings (Lanka) Ltd
Chart 3: Claims ratios of the 6 largest insurers in the general segment
30.00% 40.00% 50.00% 60.00% 70.00% 80.00% 90.00%
FY Dec 2005 FY Dec 2006 FY Dec 2007 FY Dec 2008 FY Dec 2009 FY Dec 2010
Ceylinco Insurance PLC Sri Lanka Insurance Corporation* Janashakthi Insurance PLC
Union Assurance PLC Aviva NDB Insurance PLC HNB Assurance PLC
Source: Published annual reports, RAM Ratings Lanka *End-September 2009
Life industry’s portfolio yet to mature
On the other hand, the claims ratios of the 7 largest players in the life segment are varied due to the different maturity profiles of their respective life portfolios; the older, more established companies have higher claims ratios than their more recently incorporated peers. However, all players have reported increased claims in the last 2 years, mainly a result of policy lapses amid the harsh economic environment. Prospectively, we expect demand for life insurance products to rise in tandem with the economic recovery.
Chart 4: Life claims ratios of the top 7 life insurers
0.00% 10.00% 20.00% 30.00% 40.00% 50.00% 60.00% 70.00% 80.00%
FY Dec 2005 FY Dec 2006 FY Dec 2007 FY Dec 2008 FY Dec 2009 FY Dec 2010 Ceylinco Insurance PLC Sri Lanka Insurance Corporation*
Aviva NDB Insurance PLC Union Assurance PLC
Janashakthi Insurance PLC HNB Assurance PLC
Asian Alliance Insurance PLC
Source: Published annual reports, RAM Ratings Lanka *End-September 2009
9
RAM Ratings (Lanka) Ltd
Investment Portfolio
Investment income - important profit element
Insurers’ earnings are supplemented by investment income, which is especially important for most general insurers, which tend to incur underwriting losses. Moreover, as claims on life insurance are long-tailed, a proper investment-management framework is essential, especially since there are few long-term investment avenues to match liability tenures. With insurance companies now permitted to invest overseas and their increasing exposure to the volatile equity market, investment management will play a key role in containing the associated risks.
Equity investments to rise further
The industry’s investment mix has stayed relatively unchanged, with government securities accounting for most of the investments. Notably, regulations dictate that all insurance companies must hold 20% of their technical reserves and 30% of their long-term funds as government debt papers; most players are well above these requirements. In line with the booming stock market and the environment of declining interest rates, most insurance companies have been increasing their equity investments, which took up 17% of the industry’s total investments as at end-December 2009 (end-December 2008: 14%). Equity investments are expected to comprise a larger share of total investments going forward as the stock market remains buoyant. The shifting of investments into equities is also due to the lower returns from fixed-income securities. Nonetheless, we note that the growth of investments in equity will be limited by solvency requirements (discussed further under
Capitalisation & Reserving).
Chart 5: Breakdown of insurance industry’s investments
Loans 5% Government securities 54% Listed equity 14% Commercial paper 2% Debentures 8% Unit trusts 2% Property 3% Cash & Deposits 12% end-December 2008 Loans 4% Government securities 58% Listed equity 17% Commercial paper 1% Debentures 5% Unit trusts 1% Property 3% Cash & Deposits 11% end-December 2009
Source: IBSL annual report
Room for improvement in investment guidelines
With limited domestic investment options, the decision to allow insurance companies to invest 20% of their long-term funds and technical reserves overseas can be viewed favourably. This will allow local insurers to lock in long-tenured investments that are not available on home shores, thus better matching their liabilities with their assets. However, this will also entail additional risks for their balance sheets, for example foreign-exchange risk. At present, most insurance companies’ investment guidelines do not capture such risks, as such there remains room for improvement.
10
RAM Ratings (Lanka) Ltd
Capitalisation & Reserving
Regulator proposes increase in minimum capital
The existing minimum capital requirement currently stands at LKR 100 million for each line of insurance business. Although the IBSL has proposed to increase the minimum capital requirement to LKR 250 million (for each segment), this has yet to be enacted. In addition, the regulator measures capital adequacy through the solvency margin, which must be greater than 1 for each line of business.
Revamp of directions pertaining to admissible assets and solvency margins
The regulations pertaining to the classification of admissible assets have also been revamped recently. The regulations widen the scope of investment products permitted as admissible assets, and place greater emphasis on credit ratings. This is expected to encourage insurance companies to diversify their investment avenues. For example, deposits in investment-grade finance companies are now accepted as admissible assets. Besides the classification of admissible assets, amendments will also be made on the solvency margin.
Chart 6: Current and proposed classes and limits for admissible assets
General* Life*
Government Securities 100% 100%
Gold Actual amount
-Shares of a company listed on a licensed SE 35% 20%
Corporate debts1
30% 30%
Bank deposits2
50% 50%
Freehold or leasehold land 15% 15%
Freehold or leasehold building 15% 15%
Outstanding policy loans3
- Actual amount
Unit trusts 35% 25%
Outstanding mortage loans on immovable properties (from policyholders)3
20% Actual amount
Amounts due from re-insurers or ceding companies Actual amount Actual amount
Premium outstanding Actual amount
11
RAM Ratings (Lanka) Ltd
Contd..
General* Life*
Sri Lankan Government securities (not exceeding 5 years) 100% 100%
Sri Lanka Government securities (exceeding 5 years) 40% 75%
Foreign Government securities (investment grade only) 20% 20%
Ordinary shares listed in a licensed stock exchange 30% 40%
Corporate debts issued or guaranteeded by an investment grade LSB o 60% 50%
Listed corproate debt 10% 10%
Corporate debt issued by and investment grade company 10% 10%
Asset backed securities guaranteeded by an investment grade LSB or L 10% 10% Leasehold land and building4
15% 15%
Deposits in investment grade LCB or LSB 40% 40%
Deposits in investment grade finance company 10% 10%
Cash in hand (all banks) 10% 10%
Freehold land and property occupied by insurer 10% 15%
Freehold land and property held for investment 10% 15%
Unit trusts / mutual funds 25% 25%
Gold5
20% 20%
Investments in related companies 7.5% 7.5%
Outstanding policy loans - Actual amount
Outstanding mortgage loans on immovable properties of policyholders - 10%
Reinsurance receivable6
Actual amount Actual amount Premium outstanding7 Actual amount -Amended Overall investment cannot exceed 60% (general insurance) / 50% (life insurance) Overall investment cannot exceed 40%
Source: IBSL annual report * % of Total Admissable Assets
1Must be listed or backed by a guarantee issued by a licensed commercial bank or licensed specialised bank or rated investment grade
2Face value of deposit plus accrued interest
3Should not exceed the outstanding capital or net realisable value of the loan 4Shall only be admissible for a period of 2 years from the date of coming into effect 5Should be placed in a vault of a bank accepted by the regulator
6Net of receivable for more than 6 months 7Outstanding for not more than 60 days
Life reserving determined by actuary
Meanwhile, reserving in the life segment is determined by an actuary; actuarial valuation remains optional for the general segment. RAM Ratings Lanka acknowledges that the adequacy and appropriateness of reserve levels cannot be ascertained without direct knowledge of the business of each insurer. A low level of reserves, especially for outstanding claims, may reflect short delays in settling claims, or may be caused by inadequate reserving in the face of protracted disputes. Similarly, a high level of reserves may indicate conservative reserving in the face of such delays, or may be caused by excessive reserving in a bid to understate profits and reduce tax liability.
12
RAM Ratings (Lanka) Ltd
Profitability
General insurance segment suffering underwriting losses
The profitability of a company’s core insurance business is measured through the combined ratio, which is the sum of the claims and expense ratios. Combined ratios greater than 100% signify a loss-making position for the core business, and profits are supported by investment income. A lower combined ratio is viewed favourably as it gives the company a buffer against claims and overheads. The combined ratios of the 5 largest insurers were all above 80% in 2009 (refer to Chart 7). However, we note that the combined ratios of composite insurers can be skewed by their business focus. Composite insurers predominantly focused in general insurance will have higher overall combined ratios as all of them have combined ratios that exceed 100% in this business segment (refer to Chart 8); the opposite is true for companies that primarily deal with life insurance.
Chart 7: Composite combined ratios of the 5 largest insurers
0.00% 20.00% 40.00% 60.00% 80.00% 100.00% 120.00% 140.00%
December 2005 December 2006 December 2007 December 2008 December 2009 December 2010
Ceylinco SLIC* Janashakthi Union Assurance Aviva NDB
Source: Published annual reports, RAM Ratings Lanka *End-September 2009
Ceylinco Insurance PLC = Ceylinco; Sri Lanka Insurance Corporation = SLIC; Aviva NDB Insurance PLC = Aviva NDB; Union Assurance PLC = Union Assurance; Janashakthi Insurance PLC = Janashakthi
Investment income maintained through equity investments
Previously, insurance companies’ investment portfolios had been dominated by fixed-income securities owing to elevated interest rates. However, income from investments has been maintained despite the current scenario of lower interest rates, mainly through investments in equity (refer to Table 3).
13
RAM Ratings (Lanka) Ltd
Table 3: Listed insurers’ investment income ratios
2008 2009 2010 Ceylinco 19.38% 27.29% 25.37% Aviva NDB 36.90% 65.64% 57.93% Union Assurance 27.75% 35.08% 39.17% Janashakthi 21.09% 19.90% 24.50% HNB Assurance 23.73% 28.30% 28.02% AAI 20.97% 34.38% 53.26%
Source: Annual reports, RAM Ratings Lanka
Chart 8: Combined ratios of the top 5 insurers in the general segment
80.00% 90.00% 100.00% 110.00% 120.00% 130.00% 140.00%
December 2005 December 2006 December 2007 December 2008 December 2009 December 2010
Ceylinco SLIC* Janashakthi Union Assurance Aviva NDB
Source: Published annual reports, RAM Ratings Lanka *End-September 2009
Overheads to be pressured in medium term
Overheads continue to suppress the industry’s financial performance. The overall expenses ratio of the 5 largest insurers remained relatively in line in fiscal 2010 (refer to Chart 9). Given that composite insurers are to split their businesses, overheads are expected to exert further pressure on each segment as shared services will have to be replicated in both business lines. Overheads are also anticipated to be weighed down by expanding branch networks in the medium term, as companies broaden their reach into the northern and eastern provinces.
14
RAM Ratings (Lanka) Ltd
Chart 9: Overall expense ratios of the industry's top 5 players
0.00% 10.00% 20.00% 30.00% 40.00% 50.00% 60.00% 70.00%
December 2005 December 2006 December 2007 December 2008 December 2009 December 2010 Ceylinco SLIC* Janashakthi Union Assurance Aviva NDB
Source: Published annual reports, RAM Ratings Lanka *End-September 2009
15
RAM Ratings (Lanka) Ltd
RAM Ratings receives compensation for its rating services, normally paid by the issuers of such securities or the rated entity, and sometimes third parties participating in marketing the securities, insurers, guarantors, other obligors, underwriters, etc. The receipt of this compensation has no influence on RAM Ratings’ credit opinions or other analytical processes. In all instances, RAM Ratings is committed to preserving the objectivity, integrity and independence of its ratings. Rating fees are communicated to clients prior to the issuance of rating opinions. While RAM Ratings reserves the right to disseminate the ratings, it receives no payment for doing so, except for subscriptions to its publications.
Published by RAM Ratings (Lanka) Ltd
Reproduction or transmission in any form is prohibited except by permission from RAM Ratings Lanka.
© Copyright 2011 by RAM Ratings Lanka
RAM Ratings (Lanka) Ltd No. 9, Arthur’s Place
Colombo 4 Sri Lanka
Tel: +94 112 553089 Fax: +94 112 553090 E-mail: [email protected] Website: www.ram.com.lk