The influence of delta
formation mechanism on
geotechnical property
sequence of the late
Pleistocene
–
Holocene
sediments in the Mekong River
Delta
Truong Minh Hoanga,*, Nguyen van Lapb, Ta Thi Kim Oanhb, Takemura Jiroc aDepartment of Engineering Geology, Ho Chi Minh University of Science, 227 Nguyen Van Cu Str., Dist. 5, Ho Chi Minh City, Vietnam
bVietnam Academy of Science and Technology, HCMC Institute of Resources Geography, 1 Mac Dinh Chi Str., Dist. 1, Ho Chi Minh City, Vietnam
c
Department of Civil Engineering, Tokyo Institute of Technology, 2-12-1 O-okayama, Meguro-ku, Tokyo 152–8552, Japan
* Corresponding author.
E-mail address:tmhoang@hcmus.edu.vn(T.M. Hoang).
Abstract
The aim of the study was to characterize a variety of microstructure development-levels and geotechnical property sequences of the late Pleistocene–Holocene deposits in the Mekong River delta (MRD), and the paper furthermore discusses the influences of delta formation mechanisms on them. The survey associated the geotechnical engineering and the sedimentary geology of the late Pleistocene–Holocene deposits at five sites and also undifferentiated Pleistocene sediments. A cross-section which was rebuilt in the delta progradation-direction and between the Mekong and Bassac rivers represents the stratigraphy. Each sedimentary unit was formed under a different delta formation mechanism and revealed a typical geotechnical property sequence. The
5 May 2016 Revised: 15 August 2016 Accepted: 16 September 2016 Heliyon 2 (2016) e00165 http://dx.doi.org/10.1016/j.heliyon.2016.e00165
mechanical behaviors of the sediment succession in the tide-dominated delta with significant fluvial-activity and material source tend to be more cohesionless soils and strengths than those in the tide- and wave-dominated delta and even the coast. The particular tendency of the mechanical behavior of the deposit succession can be reasonably estimated from the delta formation mechanism. The characteristics of the clay minerals from the Mekong River produced the argillaceous soil which does not have extremely high plasticity. The microstructure development-levels are low to very high indicating how to choose hydraulic conductivity value, k, for estimating overconsolidation ratio, OCR, by the piezocone penetration tests (CPTU). The OCR of sediments in the delta types strangely change with depth but none less than 1. The post-depositional processes significantly influenced the microstructure development, particularly the dehydrating and oxidizing processes.
Keyword: Geology
1. Introduction
The MRD, the largest delta in Vietnam, is located in Southern Vietnam. The mechanical properties in the MRD change strangely. The sedimentary environ-ments significantly affected the formation of the materials, macro- and micro-structures, and orientation of geotechnical properties; the particular sedimentary conditions in the late Pleistocene–Holocene deposits can be reasonably estimated by the CPTU. The sedimentary facies associations sometimes display two somewhat different parts but they still carry the facies association’s main characteristics. However, these differences significantly influence the geotechnical properties (Truong et al., 2011). The MRD Holocene delta evolution and depositional model (Ta et al., 2005) includes (1) The tide-dominated delta in the upper delta plain (Fig. 1) is characterized by a coarsening-upward succession from open to inner bay, prodelta mud, and delta front and subtidal flat muddy sand, which is covered by the fining-upward succession of the muddy subtidal to intertide-flat facies association. (2) The tide- and wave-dominated delta is characterized by coarser sediments and displays a typical coarsening-upward succession from prodelta to delta front and to foreshore facies associations. The facies association successions in the lower delta plain consist of coarsening-upward from the delta front slope to subtidal flat, fining-upward sub- to tidal-flat, and coarsening-upward succession including foreshore-dune or fining-upward intertid-al flat or sintertid-alt marsh. The OCR decrease with depth at many places, mostly less than 1 from 12 to 40 m in the soil investigation results; and the low sample quality was cause (Man, 2003). The microstructure development-level of Cantho clay is very high (Takemura et al., 2007).
Researches on the post-glacial sediments have been carried out at many places in the world. The micro- and macro-structures of natural soils cause them to differ
from reconstituted soils in a number of important ways. The term “structure” implies a combination of “fabric” (arrangement of particles) and interparticle “bonding”(Mitchell, 1976).Burland (1990)proposed a method of describing the structure-level of natural clay in the delta by using the sedimentation compression line (SCL) and the intrinsic compression line (ICL). The structures of post-glacial sediments in delta depend on both the depositional conditions and post-depositional processes. The ageing has a very important role for developing the micro-fabric of clay increasing the resistance to the compression and this resistance does not depend on the volume reduction due to creep. He also suggested the ratio of the intrinsic swelling index, C*s, to the undisturbed swelling index, Cs, C
* s/Cs could be a sensitive indicator of fabric and interparticle bonding in the natural soils. Given the importance of delta formation mechanisms on the properties of individual facies association and facies association succession, each sedimentary facies association succession would perhaps be expected to possess a typical geotechnical property sequence. However, with respect to the MRD, no research has been conducted to confirm this. Therefore, a study of the influence of delta
[(Fig._1)TD$FIG]
Fig. 1.Map of the sedimentary environments of the MRD (Ta et al., 2005), an investigative plan layout including the CLM1, VLM1 (Truong et al., 2011), BT1, BT2, BT3 (Ta et al., 2002b), and CTM1 and TAS1 (Takemura et al., 2007) sites.
formation mechanism on microstructure development and geotechnical property sequence of the MRD late Pleistocene–Holocene deposits was conducted.
2. Materials and methods
A plan layout of five investigation sites was arranged 20 to 46 km apart on average from the upper to lower delta plains (Fig. 1). The CLM1 core with continuous samples was 41 m in length. Both the CPTU and SPT tests at five sites had total of 164 m and 196 m in length, respectively. Allin situtests and sampling were carried out from the surface to the end of the late Pleistocene–Holocene sediments and a part of the undifferentiated Pleistocene sediments. The results of sedimentary geology at the BT1, BT2, and BT3 core sites in Bentre province, MRD ofTa et al., 2001; Ta et al., 2002a; Ta et al., 2005 were used. And the results of the geotechnical engineering and sedimentary geology at the VLM1 core site in Vinhlong province, MRD ofTruong et al. (2011)were also used. A list of the site information including boreholes andin situtests is shown inTable 1.
2.1.
In situ
tests, boring and sampling
The Caolanh site designated CLM1 is in Caolanh province, MRD in the upper delta plain (Fig. 1). The CLM1 site investigated both the sedimentary geology and geotechnical engineering. All test sites occurred within 10 m from each of the original core sites. The symbols of the boreholes are also symbols for all the investigation sites (Fig. 1). The BT1 borehole is at the border between the upper and lower delta plains; the BT2 borehole in the lower delta plain; and the BT3 borehole in the lower delta plain and coast (Fig. 1). A hydraulic type thin-walled tube sampler with a fixed piston was used to obtain soil samples. A stainless steel sampling tube with 2 mm thickness, 85 mm inside diameter and 710 mm length was pushed into the ground by water pressure. The soil samples were maintained in the stainless-steel tube sampler and enveloped by the wet soft materials and stored in the wooden boxes. The ground water levels at: the CLM1 site was z = +1.6 m above the average present sea level (a.p.s.l); the BT1 site was z = +2.5 m; the BT2 was z = +1.75 m; the BT3 was z = 0.0 m (Fig. 4,Fig. 5,Fig. 6,Fig. 7andFig. 8).
2.2. Lab tests
2.2.1. Geotechnical engineering tests
The basic geotechnical properties such as the grain size distribution, the natural water content wn, the plastic limit wp, the liquid limit wL, the unit weightγsat, and the specific gravity Gs (Head, 1985a) were obtained. Furthermore, the vertical effective stress σ0vo was estimated from γsat. Unconfined compressive (UC) tests were conducted for both the undisturbed clay and the remolded clay to obtain the sensitivity, St. To evaluate the one-dimensional consolidation properties,
Table 1. List of the site information, boreholes, andin situtests in this study and reference data.
Site information In situWorks Sediment data
In situtesting Sampling borehole
No. Site Location CPTU SPT In this study Reference
Symbol Latitude Longitude Altitude (m) Symbol Depth (m) Symbol Depth (m) Symbol Depth (m)
1 Caolanh 10027’39.50”N 105038’20.00”E 2.9 CPTU1-CL -35 SPT-CL -37 CLM1 -38.1 Have
CLM1
2 *Vinhlong 10014’02.00”N 105059’08.00”E 1 CPTU1-VL -47.8 SPT-VL -60 VLM1 -46.05 Have
VLM1
3 Bentre-1 10017’01.00”N 106021’34.00”E 3 CPTU1-BT1 -13.5 SPT-BT1 -27 BT1 -10 No Have
(Ta et al., 2002b) BT1
4 Bentre-2 10008’18.06”N 106028’07.20”E 2 CPTU1-BT2 -35 SPT-BT2 -30 BT2 -69 No Have
(Ta et al., 2002b) BT2
5 Bentre-3 10001’05.00”N 106037’44.00”E 2 CPTU1-BT3 -22 SPT-BT3 -28 BT3 -20 No Have
(Ta et al., 2002b) BT3 ** Cantho 10004’23.14”N 105051’09.14”E 1.4 CTM1 -24.6 No No CTM1 ** Tanan 10032’01.74”N 106020’44.12”E 2 TAS1 -7.5 No No TAS1 *
: Data fromTruong et al. (2011). **
Data fromTakemura et al. (2007). Article
No~e00165 http://dx.doi.org/10.1016/j.heliyon.2016.e00165 2405-8440/ © 2016 The Authors. Published by Elsevier Ltd. This is an open access article under the CC BY-NC-ND license (http://creativecommons.org/licenses/by-nc-nd/4.0/).
incremental loading oedometer (IL) tests (Head, 1985b) were mainly conducted using the undisturbed and reconstituted samples at the Engineering Geology Lab of Ho Chi Minh City University of Science, Vietnam (HCMCUS). The constant rate of strain consolidation tests (CRS) (Japan Geotechnical Society (JGS), 2000) were also conducted on typical soil samples, which were obtained from each facies association at the Geomechanical Lab of Tokyo Institute of Technology (TIT). The yield stressesσ0yIL andσ0yCRS were estimated from the IL and CRS results, and the yield stress ratio OCR (σ0y /σ0vo) was calculated.
2.2.2. Clay minerals,
14C ages, and chemical analysis tests
The CLM1 core was divided into several samples, each of which was 100 mm high. The samples were individually inspected and photographed, and a detailed investigation plan was conducted for the specific soil samples. The detailed soil profiles were determined. Various analyses on the sedimentary structures and properties were conducted. Radiocarbon dating of the organic material in some soil samples was performed by the Beta Analytic Radiocarbon Dating Lab, Japan and HCMC Center for Nuclear Techniques, Vietnam. Clay mineral analyses based on X-ray diffraction methods were performed using the D8 ADANCE automatic system at the Analysis Lab Center, Vietnam Petroleum Institute (ALC-VPI). From the typical cohesive soil samples of each sedimentary facies association, the types of exchangeable irons were extracted using 0.1 N H2SO4; and Al, Ca, and Mg were extracted using 1 N KCl. These extracted solutions were used to determine the contents of these exchangeable ions, and the total carbon content was determined (Page et al., 1982) at HCMCUS. The total contents of ions such as Fe, Al, Na, K, Ca, Mg, and Si were determined using UV–Vis and ICP at the Department of Sciences and Technology of HCMC Center of Analytical Services. The total content includes both exchangeable and unexchangeable ions, i.e., all the types of ions of one element which existed in the soil. The contents of these exchangeable ions and total ions were also measured for the argillaceous soils of the VLM1 core.
2.2.3. Image analysis
The cohesive soil samples were selected, and then they were dyed for placing securely and observing easily density and size of space pores (Tucker, 1989). After dyeing, the cohesive soil samples were carefully cut and made thin soil sections (TSS). The TSS were cut perpendicularly (symbol,⊥) and parallel (symbol, =) to the sedimentary layers on the cohesive soil samples. The blue color on the TSS observed under the polar nicol is space pores in the cohesive soil. The bold levels and distribution of the blue color under the polar nicol indicate density and size of the space pores. The space pore, fabric, and bond in the cohesive soil samples were considered and photographed through the polar nicol (PN) and crossed nicol (XN) of the microscope for interpreting microstructure development-levels
(Hibbard, 1995). Six soil samples of the VLM1 core and one soil sample of the CLM1 core were selected for the TSS. Scanning electron micrographs (SEM) were also taken perpendicularly to the sediment layers by Bruker Nano EVO/ MA10 machine. Six soil samples of the VLM1 core and two soil samples of the CLM1 core were selected for the SEM that they were carried out at the ALC-VPI.
3. Results
3.1. Depositional facies association of the CLM1 core
The CLM1 core can be divided into seven facies associations. The characteristics of the depositional facies associations inFig. 4a are described below in ascending order.
(1) Unit 1 (z = −36.6 to −32.1 m: below the a.p.s.l)/tidal flat/marsh facies association
The sediments include firm to stiff, darkish gray silty clay to sandy silt. Brown very fine sand silt seams with 8 mm in maximum thickness and gray mud seams which rhythmically alternated (Fig. 2a). The parallel and lenticular beddings and discontinuous very fine sand silt laminae are common (Fig. 2a). Organic materials are found. These characteristics indicate the sediments were deposited under light dynamic hydrological conditions, which might have been caused by the presence of a fluvial activity. It is dated at 11,350 ± 6014C yr BP at−34.6 m (Table 2). (2) Unit 2 (z =−32.1 to−26.1 m)/sub- to intertidal flat facies association Materials are gray to darkish gray clayey silt and silty clay, the structure has seams of parallel, lenticular, discontinuous sand to sandy silt. Peaty seams, organic materials, and bioturbation are common (Fig. 2b). The deposits are characterized by the intercalated sandy silt and mud seams, which they resemble tidal rhythmites. The sand content in the sandy silt seams was 40% (Fig. 3c). The contents of clay minerals are such as illite content, I: 58.5–64.9%, kaolinite content, K: 13.6–18.3%, chlorite content, C: 12.6–12.8%, smectite content, S: 3–6.2%, content of mixture of illite and smectite, I-S: 4.4–5.7% (Table 3a).
(3) Unit 3 (z =−26.1 to−21.9 m)/prodelta/bay facies association
The sediments include brownish, darkish gray clay, silt, and silty sand. The results in Fig. 3c and Fig. 4a show that the coarsening-upward trend is a characteristic of this facies association. The sedimentary structures are lenticular, flaser, discontinuous parallel laminae and mica flakes, and bioturbations are scattered throughout (Fig. 2c, d). In the upper part (−24.6 to−21.9 m), there are more parallel sand laminae with larger thickness than the lower part (−26.1 to −24.6 m). The contents of clay minerals are such as I: 62.9–69%, K: 9.6–16.5%,
C: 12–15.3%, S: 0–3.7%, I-S: 2.6–8.7% (Table 3a). This facies association is considered relatively homogeneous. It is dated at 6,500 ± 30014C yr BP at−22.2 m (Table 2).
(4) Unit 4 (z =−21.9 to−13.1 m)/delta front facies association
[(Fig._2)TD$FIG]
Fig. 2. Selected photographs of sedimentary structures from the CLM1 core: a) (at depth−34.0 m below the a.p.s.l) brown seams of very fine sandy silt with 8 mm in thickness, and gray mud seams, which are rhythmically alternated, b) (-27.35 m) Peaty seams, organic material, and bioturbation, c) (-25.2 m) layers of lenticular, discontinuous sand to sandy silt and bioturbation, d) (-22.9 m) lenticular laminae and mica flakes, e) (-15.33 m) flaser, continuous, parallel laminae, mica flakes, humus matter, and burrow, f) (-14.53 m) flaser, wavy, discontinuous parallel laminae, g) (-7.3 m) discontinuous parallel laminae, lenticular bedding, shell, burrow, and organic material, h) (-7.25 m) shells, i) (-4.8 m) discontinuous parallel laminae, lenticular bedding, and organic material, j) (-1.9 m) organic materials and peaty seam, k) (-1.02 m) clayey silty pebbles, which are dry whitish gray and 5 cm in diameter, and organic materials, l) (+0.63 m) mixing of silt, clay, and very fine sand, reddish, yellowish, and brownish gray, iron oxides.
The materials are greenish gray sand with an intercalation of brownish-gray to gray clay and silt laminae 1–5 mm in thickness. The clay and silt laminae are parallel, flaser, wavy and continuous or discontinuous (Figs. 2e, f). Unit 4 has a coarsening trend and the sand content is approximately 90% (Fig. 3c). The shells, mica flakes, humus matter, and burrow are scattered throughout Unit 4 (Fig. 2e). These sedimentary structures indicate Unit 4 was created in a strong hydrodynamic condition which it was mainly influenced by the tidal currents and flooding through fluvial activity. The clay minerals are such as I: 65.5%, K: 16.9%, C: 10.4%, S: 4.3%, I-S: 2.9%. It has smaller chlorite content than the others except Unit 7 (Table 3a).
(5) Unit 5 (z =−13.1 to−3.6 m)/intertidal flat facies association
Unit 5 contains darkish brown-gray mud with a fining-upward trend and an insertion of thin very fine sand seams. The thin sand seams and grain-size decrease Table 2. List of14C ages from the CLM1 core.
Altitude (m) Materials Delta13C (permil) Conventional 14 C age (yr BP) -7.3 Organic -26.3 1530 ± 40 -12.02 Organic -25.5 1960 ± 40 -21.9* Organic 6500 ± 300 -34.6 Organic -24.8 11350 ± 60
BETA-:14C dating in Beta Analytic.
*HCMC Center for Nuclear Techniques, Vietnam.
[(Fig._3)TD$FIG]
Fig. 3.Summary of the lab geotechnical test results on the CLM1 core.
from the lower part to the upper part of Unit 5 (Figs. 2g, i). The structures are parallel laminae, discontinuous parallel laminae, and lenticular bedding (Figs. 2g, i). The shell, burrow, and organic material are plentiful (Figs. 2g, h). It is dated at 1,960 ± 4014C yr BP at z = −12.02 m and 1,550 ± 40 14C yr BP at −7.3 m (Table 2). The clay minerals are such as I: 57.1–66.3%, K: 15.1–19.9%, C: 13.1–14.7%, S: 0–5%, I-S: 1.4–9.8%. It has more kaolinite and chlorite contents Table 3a. Results of the clay mineral content analysis of argillaceous sediments from the CLM1 core. Altitude (m) Unit Sedimentary Illite (%) Kaolinite (%) Chlorite (%) Smectite (%) Mixture of Illite and Smectite (%)
1.09 7 Natural levee 72.1 12.1 8.1 3.9 3.9 0.5 7 70.5 13.7 10.8 1.4 3.7 -1.7 6 Flood plain 66.5 13.7 12.5 0 7.3 -4.01 5 Intertidal flat 61.2 19.9 14 3.6 1.4 -8.95 5 66.3 15.7 14.7 0 3.2 -12.12 5 63 15.1 13.1 5 3.8 -12.22 5 57.1 15.9 13.1 4.1 9.8 -13.33 4 Delta front 65.5 16.9 10.4 4.3 2.9 -23.3 3 Prodelta /bay 67.1 14 12 3 3.8 -23.5 3 62.9 16.5 14.4 3.7 2.6 -24.7 3 64.6 14.5 15.3 0 5.6 -25.2 3 69 9.6 12.7 0 8.7 -27.35 2 Sub- to inter -tidal flat 58.5 18.3 12.6 6.2 4.4 -27.75 2 64.9 13.6 12.8 3 5.7
[(Fig._4)TD$FIG]
than the overlaying Unit 6 and 7 (Table 3a). The material and structure are relatively homogeneous.
(6) Unit 6 (z =−3.6 to−0.5 m)/flood plain facies association
Unit 6 contains darkish gray, brownish gray clayey silt to silty clay mud, and plentifully organic matter with peaty seam. It contains clayey silty pebbles that they are dry, whitish gray, and 5 cm in diameter (Figs. 2j, k). The clay minerals are such as I: 66.5%, K: 13.7%, C: 12.5%, S: 0%, I-S: 7.3%. It has more chlorite content than Unit 7 but fewer than Unit 5 (Table 3a).
(7) Unit 7 (z =−0.5 to 2.9 m)/natural-levee facies association
Unit 7 is a mixture of silt, clay, and very fine sand with reddish, yellowish, and brownish gray (Fig. 2l). Unit 7 is characterized by laterization and stiffness. The minerals are such as I: 70.5–72.1%, K: 12.1–13.7%, C: 8.1–10.8%, S: 1.4–3.9%, I-S: 3.7–3.9%. It has the highest illite content, but lower kaolinite and chlorite contents than the underlying facies associations (Table 3a).
3.2. Clay minerals
The contents of the clay mineral types of all the sedimentary facies association of the CLM1 and VLM1 cores are general in descending order from the illite, kaolinite, chlorite, and to smectite (Table 3b). A possible cause could be due to the material source from the Mekong River system. The distributions of these clay minerals in the MRD late Pleistocene–Holocene sediments in this study are similar to those in the metamorphic and granitic parent rocks and the surface soils (Zhifei et al., 2004). This occurred because of physical erosion and chemical weathering in the Tibetan Plateau, Vientiane, and MRD along the Mekong River system to the Southwest slope of the East Sea in the interglacial, glacial, and post-glacial stages. This result can also be a characteristic of the Mekong River system. The contents of illilte of the CLM1 core are larger than those of the VLM1 core, but the smectite
Table 3b. Summary of clay mineral content analysis of argillaceous sediments of the CLM1 and VLM1 (Truong et al., 2011) cores.
Illite Kaolinite Chlorite Smectite Mixture of Illite and Smectite
(%)
max−min max−min max−min max−min max−min
*rarely *rarely *rarely *rarely *rarely
72.1−54.2 21.8−12.1 18.6−10.4 13.0−0.0 9.8−1.3
*44.7 *9.6 *8.1 *26.4
contents generally increase in the VLM1 core. The natural levee facies association has the largest illite content among all the facies associations, more than 70% (Table 3a). This may be due to the specific gravity of the illite (Gs = 2.8) being greater than those of the others, so the illite settled on the area around the banks and did not go far. Consequently, the illite content in the natural levee facies association is high and there are differences in the mineral contents between the CLM1 and VLM1 cores.
3.3. Results of the geotechnical engineering tests
3.3.1. In situ tests
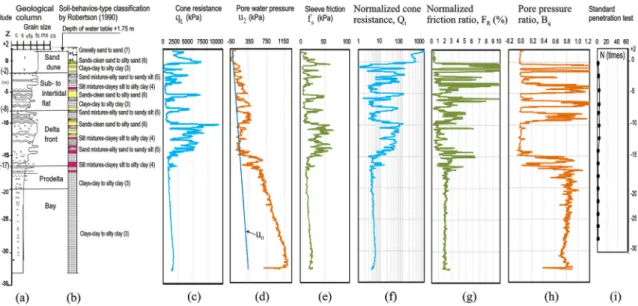
A soil profile can be estimated by the soil-behavior-type classifications charts using the CPTU results. The following normalized values (Robertson, 1990;
Robertson, 1991; andRobertson, 2010) were used for the classification: Normalized cone resistance:
Qt¼
qtσvo
σ0
vo
(1)
Normalized friction ratio:
FR ¼
fs qtσvo
x100% (2)
Normalized pore pressure ratio:
Bq¼
u2u0 qtσvo
(3)
whereσvo,σ’voand u0are the total vertical stress, the effective vertical stress and the static water pressure, respectively, and qt, fs, and u2are the cone resistance, the sleeve friction and the pore water pressure measured behind the cone tip, respectively.
The soil-behavior types by the Qt-Bqrelationship were almost the same as those by the Qt-FR relationship on the classifications charts. The geological columns, soil-behavior types by the Qt-FR relationship, and values of qt, fs, u2, Qt, FR, and Bq, and N by the SPT on the each sedimentary facies association at the investigative sites and the VLM1 site (Truong et al., 2011) are presented inFig. 4,Fig. 5,Fig. 6,
Fig. 7andFig. 8.
3.3.2. Lab tests
Fig. 9shows the e-logσ0vcurves they were obtained from the IL and CRS tests for the undisturbed samples collected on the each facies association of the CLM1 core, and the intrinsic compression curves can be obtained from the samples that were
reconstituted with a water content of 1–1.5 wL. The qualities of the cohesive-soil specimens of the CLM1 and VLM1 cores were evaluated by using Δe/e0 (Andresen and Kolstad, 1979).Δe is the change of the void ratio which is caused
[(Fig._5)TD$FIG]
Fig. 5.VLM1 site displays: Geological column, CPTU and SPT results (Truong et al., 2011).
[(Fig._6)TD$FIG]
Fig. 6.BT1 site displays: Geological column (Ta et al., 2002b), CPTU and SPT results.
by recompression to the in situvertical effective stress σ’vo, and e0is the initial void ratio. TheΔe/e0ratio is plotted against OCR inFig. 10. The sample qualities of the both are relatively good and tend to decrease according to depth; the specimens are as low as −25 m in depth (Fig. 10). Cause can be the sampler inserted by the water pump used and the hammering used for penetrating the sampler. The soil samples below z =−31 m at the CLM1 site were gotten by the
[(Fig._7)TD$FIG]
Fig. 7.BT2 site displays: Geological column (Ta et al., 2002b), CPTU and SPT results.
[(Fig._8)TD$FIG]
[(Fig._9)TD$FIG]
Fig. 9. Compression curves of the e-logσ0v relations which were obtained form the IL and CRS
tests on undisturbed and reconstituted cohesive soil specimens of the CLM1 core of: a) The below facies associations, b) The flood plain and natural-levee facies associations.
standard penetration-tube of the SPT tests, so the mechanical properties could not be conducted on undisturbed samples at these depths.
The lab geotechnical results of each facies association of the CLM1 core were summarized inFig. 3: Describing materials, grain size distribution, saturated unit weight,γsat, specific gravity, Gs, natural water content, wn, plastic limit, wp, liquid limit, wL, liquidity index, LI, compression strength for undisturbed sample, qu, sensitivities, qu/qur, by UC tests are shown inFigs. 3b–h. And theσ
0
yILandσ
0
yCRS from the IL and CRS results are shown inFig. 3I. The plasticity chart is plotted based on the plasticity index, PI, and wLfor soil-classification (Fig. 11).
The void indices Ivoof thein situvoid ratio e0were estimated using equation(4) (Burland, 1990), where e100 and e1000 are the void ratios of the intrinsic compression curve at σ0v = 100 kPa and 1000 kPa, respectively. The relation between the Ivoand theσ
0
voon the Caolanh cohesive soils is shown inFig. 12. The Ivo are also compared with the data of the Vinhlong (Truong et al., 2011) and Cantho and Tanan cohesive soils (Takemura et al., 2007).
Ivo¼
e0e100
e100e1000 (4)
The OCR in cohesive soils was estimated from the CPTU results at the sites by the simple formula (5) with k values in a range of 0.2 to 0.5 (Lunne et al., 1997). And higher values of k are recommended in aged heavily overconsolidated clays (Powell and Quarterman, 1988). The OCR by the CPTU test and the CRS test are nearly equal and they are more than by the IL test at the same depth (Fig. 13). The CRS test compression curves e-logσ0vis sharper, and identifiesσ0vymore easily and precisely (Fig. 9). A small change of k value will give a relatively large change of OCR. In addition, the OCR values of the MRD sediments strangely change. Therefore, how to choose the k values is also discussed.
Yield stress ratio:
OCR¼k: qtσvo σ0
vo
(5)
3.4. Geotechnical properties of sedimentary facies association
3.4.1. Marsh/tidal flat facies association (CLM1 site)
The materials are firm to stiff, silty clay with low plasticity, CL, and very fine sand (Fig. 11). The CPTU1-CL results (−36.6 to−32.1 m) indicate the soil-behavior-type is commonly clays and silt mixtures (Fig. 4b). The soil-behavior-types are similar to the sedimentary structures and materials, namely on the sample at z = −34.9 m (Figs. 2a andFigs. 4a, b).
[(Fig._10)TD$FIG]
Fig. 10.Changes of the void ratio, which was caused by recompression on the effective overburden stress from the oedometer tests on the Caolanh and Vinhlong cohesive specimens.
[(Fig._11)TD$FIG]
Fig. 11.Plasticity chart of deposits of the CLM1 core (this study), VLM1 (Truong et al., 2011), and TAS1 and CTM1 (Takemura et al., 2007) cores.
3.4.2. Sub- to inter-tidal flat facies association (CLM1 site)
The materials consist of clay, clayey and sandy silt with low to medium plasticity, CL, ML, MI (Fig. 11). The CPTU1-CL results, the strengths are high, qt: 1200–4000 kPa, N: 7-8; the soil-behavior types are clays with intercalations of sand mixtures and organic soil peats (Figs. 4b, c and i). The soil behavior types coincide with the sedimentary structure and material (Figs. 4a, b).
3.4.3. Open bay facies association (BT2 site)
The CPTU1-BT2 results showed that the soil-behavior-type is only clays (Fig. 7b). These geotechnical results seem to coincide with the bay facies association on the BT2 core (Ta et al., 2001) (Fig. 7). The geotechnical and sedimentary results at the VLM1 and BT2 sites indicate that the bay facies association was formed in the low energy environment; and it is characterized by a high homogeneity level and the strengths increase linearly with depth (Fig. 7).
3.4.4. Prodelta/bay and prodelta facies associations (CLM1, BT2,
and BT3 sites)
At the CLM1 site, the materials are low- to medium-plasticity clays, CL-I, and medium-plasticity silt, MI (Fig. 3b andFig. 11). At the BT2 and BT3 sites, the CPTU results on the prodelta facies associations show the increases of qt, u2, and fs
[(Fig._12)TD$FIG]
Fig. 12. Relationship between the void indices Ivo and the effective overburden stress σ 0 voon the
Caolanh, with data of the Vinhlong (Truong et al., 2011), Cantho and Tanan cohesive soils (Takemura et al., 2007).
tend to be linear with depth (Fig. 7c–e andFig. 8 c–e). The mechanical behaviors are general clays and silt mixtures, and an interference of sand mixtures in the upper part and increasing highly upward. The interference of sand mixtures in the upper part of the prodelta/bay facies association at the CLM1 site is more than those of the VLM1 and BT2 sites. These mechanical behaviors correspond to the sedimentary structures and materials of the prodelta/bay and prodelta facies associations (Fig. 7
andFig. 8). The prodelta/bay and prodelta facies associations were generally formed in the low energy environment, and the energy-levels gradually increased from the
[(Fig._13)TD$FIG]
Fig. 13. Values of OCR with depth from IL, CRS and CPTU tests for the cohesive soils at the CLM1, VLM1 (Truong et al., 2011), BT1, BT2, and BT3 sites.
lower to upper parts of the facies association. Their homogeneous levels gradually decrease from the lower to upper parts.
3.4.5. Delta front facies association (CLM1, BT1, BT2, and BT3
sites)
At the CLM1 site, the CPTU1-CL results, the behavior types are commonly cohesionless soils; Qt, FR and Bq varied slightly; the qt and fs show saw-tooth graphs with large variations while N values increase regularly from 11 to 16 (Figs. 4b–i). The sediment structure and material correspond with the mechanical behaviors, namely on the sample at z =−16.23 m and−15.43 m (Figs. 2e, f and
Fig. 4).
At the BT1, BT2, and BT3 sites, the CPTU results indicate the soil-behavior-types tend to be cohesionless soils with an insertion of cohesive soil seams (Fig. 6b and
Fig. 2b). And the insertion decreases from the bottom to top of the delta front facies association. For this reason, the qtand fstend to increase from the bottom to top (Fig. 6,Fig. 7,Fig. 8). The Qt, FR, and Bqshow the saw-tooth graphs with large variations (Fig. 6,Fig. 7,Fig. 8). The delta front facies association was formed in a high energy environment that it is heterogeneous.
3.4.6. Intertidal flat facies association (CLM1 site)
The materials are mostly medium plasticity clay, CI, and high plasticity silt, MH (Fig. 3b andFig. 11). The qt, u2, and fs are all linear with depth and very small magnitudes; Qt, FR and Bq have saw-tooth graphs with small amplitudes (Figs. 4c–h). The soil-behavior-types are clays with intercalating sand mixtures, silt mixtures, and organic soils-peats; the soil-behavior-types correspond with the sediment results, namely on the sample at z =−8.2 m and−5.7 m (Figs. 2g, i, and
Fig. 4).
3.4.7. Sub- to inter-tidal flat facies association (BT1, BT2, and
BT3 sites)
The CPTU results at the three sites indicate the geotechnical properties are similar to the sedimentary structure and materials of the sub- to inter-tidal flat facies association (Ta et al., 2002a) (Fig. 6,Fig. 7,Fig. 8). In general, the soil-behavior-type is commonly clays with an insertion of the sand mixtures and sands-clean sand to silty sand (Fig. 2b and Fig. 6b). The rather regular alternations of the cohesionless and cohesive soil seams resemble tidal rhythms. These features characterize the sub- to inter-tidal flat facies association. The sub- to inter-tidal flat facies association was formatted in a high energy environment. Its homogeneous level is low.
3.4.8. Flood plain facies association (CLM1, BT1 sites)
The CPTU results at the two sites indicate the soil-behavior-types are commonly clays (Fig. 4a, b andFig. 6a, b). We can see on the sample at z =−2.8 m and−1.92 m of the CLM1 core corresponding to the soil-behavior-type by the CPTU1-CL (Figs. 2j, k andFigs. 4a, b). The materials are commonly high plasticity clay, CH (Figs. 3b and Fig. 11). In general, the soil-behavior-type is cohesive soil corresponding with the sedimentary structure and materials of the flood plain facies association (Fig. 4 and Fig. 6). The facies association was formatted in a low energy environment; its homogeneity is high.
3.4.9. Sand dune facies association (BT2 and BT3 sites)
The CPTU results show the soil-behavior-types are sand mixtures, sands-clean. The qtand fs show saw-tooth graphs with small variations and large magnitudes (Fig. 7 and Fig. 8). The soil-behavior-types and the changes in the qt and fs correspond to the alternate seams of sandy mud and well sorted fine sand in the sediment results (Ta et al., 2002b) (Fig. 7 andFig. 8).
3.4.10. Natural levee facies association (CLM1 site)
The CPTU1-CL results, the soil-behavior-types are clays, silt mixtures, and fine sand which correspond to sedimentary results (Figs. 3a–c and Figs. 4a–b). The natural levee sediment existed along the sides of rivers with large elevations and often above the ground water table (Fig. 1 andFig. 4a); they contacted with the sun’s energy and air. Simultaneously, the Fe(OH)3was dehydrated during the 6 months of the dry season in the tropical area, and the Fe2O3was produced in the sediment as in Eqs. (6) and (7). The iron hydroxyls appeared during the depositional process. And the iron-hydroxyl was carried from underlying sediments into the natural-levee sediment by an oscillation of the ground-water table and capillary water. The Fe2O3 is strong cement and made the soils be in reddish, yellowish, and brownish color (Fig. 2l). It is called the laterization. Hence,
σ0yILandσ
0
yCRS, qt, fs, qu, and N are notably large (Fig. 3i,Fig. 4c–e and i). The Fe2O3 is durable and cannot be extracted by 0.1 N H2SO4, so the contents of exchangeable trivalent iron in the natural-levee sediment are lower than those in the others. And the bivalent iron content is notably low and even equal to zero but the total contents of Fe and Al are the highest (Table 4a). The dehydrating process also produced free sulfate, so the natural-levee sediment has the lowest pH values, 4.5 (Table 4a). The exchangeable ion contents and the total contents of Ca2+ and Mg2+ are small (Table 4a).
Fe(OH)2+ 1/2H2O + 1/2O2→2Fe(OH)3(6) 2Fe(OH)3→
t0
Fe2O3 + 3H2O ↑(7)
4. Discussion
4.1. Formation mechanism of sediment and development-level of
microstructure
The microstructure development-level of the argillaceous soil in each facies association is interpreted by a combination of the formation mechanism, consolidated properties,14C age, and analysis on the TSS and SEM images. They can be divided into three main broad cases, namely the surface sediment facies associations, the shallow sediment facies associations, and the deep sediment facies associations and presented as follows.
4.1.1. Surface sediment facies associations
Case 1 includes natural levee, flood plain, intertidal flat, and sub- to intertidal flat facies associations contacting the solar energy and air.
For the natural levee facies association at the CLM1 site, the OCR values are notably large, from 6.1 to 2.2 (Fig. 13a andTable 5). The Ivvalues lie well below the corresponding ICL, around and so less than zero despite the notably small values ofσ0vo: 30 to 40 kPa (Fig. 12). The e-logσ0vcures on the undisturbed soil specimens (at z = 0.98 and 0.93 m) quite lie under those of the reconstituted soil specimens (Fig. 9b); that is a remarkable characteristic. These slopes of the parts after the yield stress point on the e-logσ0vcures of the natural levee sediment are smaller than those of the others; and the e-log σ0v cures on the natural levee sediment lie below those of the flood plain sediment (Fig. 9). The trivalent iron oxides enclosed and bonded the soil minerals and quartz fragments as an iron-cement (Figs. 14a,b andFig. 15a). As a result, values of swell sensitivities, C*s/Cs, are large, from 0.48 to 0.6 (Table 6); they indicate the bond in the natural levee sediments is steady. The density and size of space pores in the natural levee sediment are small (Fig. 14b). The initial void ratio, e0, is very small, 0.838 (Table 7). Consequently, the consolidation of the natural levee sediment was a special consolidation process that was not caused by the gravitational compaction. This consolidation process resulted in the unusual geotechnical properties. We can say that the microstructure development-level of the natural levee sediment is high to very high, so k values should be 0.5 to 0.35 for calculating OCR by CPTU in Eq.(5)(Table 7). The OCR, strength, and reddish, yellowish, and brownish color of the natural levee sediment gradually decrease with depth because of the sediments forwarding to the ground water level, so k values used should decrease gradually with depth.
A formation-mechanism of the flood plain sediment is fairly similar to the natural levee sediment but it was farther than the natural levee sediment from the rivers
Table 4a. Exchangeable-ion content in the argillaceous sediments from the CLM1 and VLM1 cores.
Information of the cores and the facies associations Exchangeable ions Total percentage of dispersive carbon pH Facies association Altitude Fe2+ Fe3+ Fe2+/ (Fe2++Fe3+) Al3+ Ca2+ Mg2+ TOC
(m) equivalent milligram/100g (%) equivalent milligram/100g (%) Caolanh core Natural levee 0.28 0.00 54.10 0.00 1.55 1.65 1.82 4.7 -0.41 2.30 77.30 2.89 4.3 -0.48 8.01 217.55 3.55 0.20 1.30 2.2 6.31 4.8 Flood plan -0.78 401.95 488.17 45.16 0.72 4.10 5.91 9.41 6.1 -1.50 102.02 747.82 12.00 1.43 5.37 5.94 11.15 5.7 -4.50 449.80 956.26 31.99 0.53 12.03 7.3 Inter-tidal flat -4.81 1438.26 233.81 86.02 1.11 1.78 3.2 10.05 6.9 -5.70 1141.28 294.15 79.51 1.18 4.52 3.86 12.33 7.6 -8.10 1346.71 605.19 68.99 0.10 2.78 2.12 10.32 7.2 -8.20 583.64 984.71 37.21 1.03 6.87 4.03 11.96 6.7 -13.02 266.62 398.11 40.11 0.21 2.3 2.47 11.65 6.2 Delta front -14.03 20.88 745.65 2.72 0.40 2.19 4.06 12.58 7.4 -15.23 46.68 285.27 14.06 0.25 1.14 3.26 1.38 7.3 -15.33 167.42 501.10 25.04 0.30 1.22 2.77 2.39 7.5 Prodelta -23.70 280.43 169.85 62.28 0.42 0.82 3.78 2.35 7.2 -24.20 455.43 143.70 76.01 0.20 5.19 1.78 6.36 7.7 -25.50 511.75 122.44 80.69 0.00 1.46 2.43 3.81 7.5 -26.10 139.25 270.36 34.00 0.20 0.98 1.95 6.69 6.8 Vinhlong core Flood plain -0.80 62.00 18.40 77.11 1.51 1.89 6.11 13.90 6.4 (Continued) Article No~e00165 http://dx.doi.org/10.1016/j.heliyon.2016.e00165 2405-8440/ © 2016 The Authors. Published by Elsevier Ltd. This is an open access article under the CC BY-NC-ND license (http://creativecommons.org/licenses/by-nc-nd/4.0/).
Table 4a. (Continued)
Information of the cores and the facies associations Exchangeable ions Total percentage of dispersive carbon pH Facies association Altitude Fe2+ Fe3+ Fe2+/ (Fe2++Fe3+) Al3+ Ca2+ Mg2+ TOC
(m) equivalent milligram/100g (%) equivalent milligram/100g (%) Caolanh core
-1.31 1206 57.50 95.45 0.50 1.48 4.13 9.40 6.7
Sub- to intertidal flat -3.40 2.00 195.00 1.02 0.85 0.96 2.45 8.00 6.3
Delta front -11.50 343.43 650.38 34.56 0.05 1.89 3.21 7.94 7.5 Prodelta -21.01 471.41 392.48 54.57 0.05 1.89 3.86 7.04 7.9 Marsh -37.30 448.37 609.20 42.40 0.05 2.31 2.97 7.98 7.5 Article No~e00165 http://dx.doi.org/10.1016/j.heliyon.2016.e00165 2405-8440/ © 2016 The Authors. Published by Elsevier Ltd. This is an open access article under the CC BY-NC-ND license (http://creativecommons.org/licenses/by-nc-nd/4.0/).
(Fig. 1). For this reason, the grain sizes, Si and illite contents of the flood plain sediment are smaller than those of the natural levee sediment (Table 3a and
Table 4b). The flood plain sediment was close to the ground water table. The carbon with very small size dispersed in suspension during the sedimentary process. The carbon joined to form cements between particles and made the flood plain sediment have darkish gray color (Fig. 2j).
For the intertidal flat and sub- to intertidal flat sediments during the depositing process, when the tide went up, materials settled down. And when, the tide went down, this sediment seam directly contacted with sunshine and air. Simultaneous-ly, the light oxidizing and dehydrating processes would occur in the sediment seam. The formation cycle continually happened every day and created the sub- to inter-tidal or intertidal sediments. A formation-mechanism of the intertidal flat sediment resembles the sub- to intertidal flat sediment, but the intertidal flat sediment was inner of bank and with a low energy. As a result, the homogeneous level of the intertidal flat sediment at the CLM1 site is higher than the sub- to inter-tidal flat sediments at the VLM1, BT1, BT2, and BT3 sites (Fig. 4,Fig. 5,Fig. 6,
Fig. 7andFig. 8). And the OCR values of the intertidal sediment do not vary so much as those of the sub- to inter-tidal flat sediment (Fig. 13).
Values of C*s/Cs on the flood plain, intertidal flat, and sub- to intertidal flat sediments in the CLM1 and VLM1 cores are from 0.44 to 0.8 (Table 6). Hence, their microstructure development-levels can be medium to high. There are Table 4b. Total ion content in the argillaceous sediments from the CLM1 and VLM1 cores.
Caolanh core Total ion and element contents in the argillaceous sediments
Facies association Altitude Total [Fe] Al3+ Ca2+ Mg2+ Na+ K+ [Si]
(m) (%) Natural levee 0.29 5.93 4.58 0.19 0.46 0.47 1.79 29.82 0.28 5.26 4.39 0.18 0.48 0.33 1.96 28.00 Flood plain -0.78 4.92 3.39 0.14 0.41 0.39 1.25 24.41 Vinhlong core Flood plain -0.80 2.95 1.79 0.33 0.47 24.10 -1.30 3.01 1.81 0.27 0.49 24.07 -1.50 2.06 1.77 0.29 0.52 28.20
Sub- to intertidal flat -5.10 4.13 0.29 0.56 27.70 Delta front -11.50 4.85 4.29 0.25 0.55 0.40 1.91 28.00 Marsh -33.40 4.81 4.87 0.28 0.59 0.84 2.78 26.61 -37.30 5.10 4.93 0.30 0.64 0.55 2.26 27.40
Table 5. Values of k and OCR by the CPTU at the CLM1, VLM1, BT1, BT2, and BT3 sites.
Facies/ Information of sites
Upper delta Lower delta Values of k for calculating OCR by CPTU
CLM1 VLM1 BT1 BT2 BT3
CPTU1-CL CPTU1-VL CPTU1-BT1 CPTU1-BT2 CPTU1-BT3 Upper delta Lower delta Late Pleistocene – Holocene sediments
Surface sediments Natural levee 6.1 - 2.2 0.5 to 0.35
Beach ridge/marsh 0.25 to 0.2
Flood plain 2.7 - 1.4 1.45 - 1.46 4.3 - 1.3 0.35 to 0.2
Sub- to intertidal flat/intertidal flat 2.1 - 1 1.95 - 1.58 1.8 - 1.1 2.1 - 1 3.1 - 1 0.35 to 0.2 0.25 to 0.2
Shallow Delta front 1.7 - 1 1.9 - 1 1.9 - 1 1.6 - 1 2.1 - 1.1 0.3 to 0.2 0.2
Deep sediments Prodelta 2.3 - 1 1.63 - 1.28 1.4 - 1 2.6 - 1.3 0.4 to 0.3 0.3
Bay 1.44 - 1.17 1.8 - 1.1 0.4 to 0.3 0.3
Estuary/
sub-to intertidal flat
2.1 - 1.1 1.87 - 1.14 0.45 to 0.4 Marsh/tidal 2.7 - 5.2 1.98 - 1.39 0.4 to 0.45 Estuary channel 5.7 - 1.77 0.45 to 0.5 Article No~e00165 http://dx.doi.org/10.1016/j.heliyon.2016.e00165 2405-8440/ © 2016 The Authors. Published by Elsevier Ltd. This is an open access article under the CC BY-NC-ND license (http://creativecommons.org/licenses/by-nc-nd/4.0/).
[(Fig._14)TD$FIG]
Fig. 14.Selected images on the TSS of the CLM1 core: a & b) Natural levee sediment, iron and calcium cements, large angular quartz fragments (Q) 0.35 mm in length, iron oxide. The VLM1 core: c & d) Delta front sediment, Q with even sizes and organic materials, general greenish gray and black joining in bond. e & f) Delta front sediment, contiguous part between sandy and clayey seams. g & h) Prodelta sediment, plain clay seams. i, j & k) Marsh sediment, parallel clay seams and hydromica sticks, opaque iron oxide and calcites. l & m) Marsh sediment, plentiful calcite and iron compounds and diatoms. n, o) Estuary channel sediment, iron cements, plentiful pyrite and calcite, small sizes and density of space pores.
[(Fig._15)TD$FIG]
Fig. 15. Selected SEM images of the CLM1 core: a) Natural levee sediment (+0.28 m), chaotical clays, aggregated clays, small sizes and density of space pores. b) Flood plain sediment (-4.81 m), chaotical clay, aggregated clays. The VLM1 core: c) Delta front sediment (-11.1 m), flocculation clay and large space pore. d) Prodelta sediment (-21.01 m), parallel clay seams. e, f, & g) Prodelta sediment (-21.01 m), petri dish and tubular diatoms, pyrites in space pore of the petri dish diatom. h) Bay sediment (-22.05 m), plentiful large pyrites. i, j & k) Marsh sediment (-30.45 m), plain clays seams, plentiful pyrites. l, m & n) Marsh sediment (-37.3 m), parallel clays, very plentiful tubular diatoms on the exposed surface. o) Estuary channel sediment (-45.75 m), parallel clays, small sizes of space pore.
Table 6. Swell sensitivities, C*s/Cs, yield stress ratio, OCR, virgin compression index, Cc, from IL tests, and Atterberg limits of the argillaceous sediments of
the CLM1 and VLM1 cores.
Facies associa-tion
Altitude, m
wl wp wn Undisturbed soil Disturbed soil C*s/Cs
OCR Virgin compression In-dex Swell Index, Cs Compression In-dex C* c Swell Index, C* s C*s:at OCR=10 Cs: at 215-13 kPa % Cc 860 to 215 kPa 215 to 13 kPa 1000 to 100 kPa
slope of ISL at OCR=10
Caolanh site Natural levee 0.88 46.30 26.17 29.32 3.5 0.18 0.03 0.05 0.31 0.03 0.60 0.3 71.00 52.26 49.65 3.5 0.48 0.09 0.12 0.50 0.06 0.52 0.2 65.40 38.31 51.80 2.2 0.44 0.05 0.10 0.46 0.05 0.48 0.08 46.00 24.75 29.43 1.5 0.16 0.03 0.05 0.41 0.03 0.60 Flood plain -1.78 56.70 27.46 59.11 1.0 0.58 0.05 0.10 0.475 0.07 0.69 Intertidal flat -7.45 44.50 24.13 43.14 1.2 0.55 0.05 0.07 0.33 0.06 0.80 -7.55 41.80 23.65 44.96 1.2 0.64 0.03 0.09 0.35 0.04 0.44 Vinhlong site Flood/ marsh -1.41 46.50 26.86 47.49 1.1 0.38 0.03 0.07 0.30 0.04 0.56 Delta front -6.39 33.00 20.19 45.50 1.0 0.33 0.04 0.06 0.19 0.04 0.64 -7.92 63.00 28.57 62.24 1.0 0.76 0.07 0.10 0.50 0.09 0.82 -9.57 48.11 21.07 59.34 1.1 0.73 0.07 0.12 0.27 0.02 0.19 -9.60 49.11 20.73 58.79 1.1 0.64 0.06 0.10 0.30 0.03 0.28 -14.5 58.80 26.69 55.79 1.1 0.82 0.08 0.13 0.34 0.04 0.29 Bay -22.14 72.00 24.72 46.81 1.2 0.60 0.07 0.09 0.40 0.08 0.90 Marsh -28.05 50.60 24.66 42.93 1.2 0.60 0.06 0.09 0.33 0.07 0.76 -30.76 40.12 21.10 38.21 1.3 0.58 0.04 0.06 0.28 0.04 0.69 (Continued) Article No~e00165 http://dx.doi.org/10.1016/j.heliyon.2016.e00165 2405-8440/ © 2016 The Authors. Published by Elsevier Ltd. This is an open access article under the CC BY-NC-ND license (http://creativecommons.org/licenses/by-nc-nd/4.0/).
Table 6. (Continued)
Facies associa-tion
Altitude, m
wl wp wn Undisturbed soil Disturbed soil C*s/Cs
OCR Virgin compression In-dex Swell Index, Cs Compression In-dex C*c Swell Index, C*s C*s:at OCR=10 Cs: at 215-13 kPa % Cc 860 to 215 kPa 215 to 13 kPa 1000 to 100 kPa
slope of ISL at OCR=10
-30.83 39.80 20.71 37.23 1.3 0.53 0.04 0.07 0.29 0.05 0.79 -38.90 44.20 30.28 49.30 1.1 0.83 0.05 0.07 0.33 0.06 0.76 Estuary channel -41.52 71.90 29.20 52.40 1.7 1.13 0.14 0.16 0.45 0.11 0.67 Article No~e00165 http://dx.doi.org/10.1016/j.heliyon.2016.e00165 2405-8440/ © 2016 The Authors. Published by Elsevier Ltd. This is an open access article under the CC BY-NC-ND license (http://creativecommons.org/licenses/by-nc-nd/4.0/).
sediment, consolidated properties,14C age, and analysis on TSS and SEM images inFig. 10andFig. 11. Values of k were suggested for calculating OCR from CPTU test.
Facies as-sociation
Images on the thin soil section (TSS) Scanning electron micrograph (SEM) 14C age (yr BP) Initial void ratio, e0 Development-level of micro-structure: bonding, ag-ing, and recrystallizing k suggested for calculating OCR, CPTU
Fig. Note Fig. Note Upper
delta plain * Lower delta plain ** Natural levee 16. .a .b
Iron and calcium cements significantly joined in bond. Large angular quartz fragments (Q) obtained 0.35 mm length and distributed chaotically and plentifully; Q were completely enclosed by iron oxide. Density of space pores is very small through blue color.
17. .a
Clay-minerals arranged chaotically. Clay particles aggregated and generally bond well. Sizes and density of space pores are very small.
less than 3,000 0.838 High to very high 0.5 to 0.35 Flood plain, Flood plain/ marsh
.b Clay-minerals arranged chaotically. Clay particles massed.
around 3,425 less 2,500 1.1-1.62 Medium to high *: 0.35 to 0.2 **: 0.25-0.2 Delta-front .c .d .e .f
Q with silty- to sandy-sizes and organic materials are plentiful. The organic materials with black color joined in the bond between soil particles. Density and sizes of space pore increased greatly.
.c Salt flocculation or called flocculent structures. Sizes and density of space pore are very large.
4,000 to 7,000 less 4,000 1.2-1.9 Low to medium *: 0.3 to 0.2 **: 0.2 Prodelta .g .h
Clayey and silty seams arrange parallel. Density and sizes of space pore decreased which can see through light blue color under PN. The organic materials are plentiful in greenish gray and black color.
.d .e .f .g
Clayey seams arranged parallel. Pyrites recrystallized in space pore of the petri dish diatom. Petri dish and tubular diatoms are plentiful. Matrix around the diatoms is not well compacted.
5,000 to 8,880 5,000 to 2,500 1.43 Medium to high *: 0.4 to 0.3 **: 0.3
Bay .h Pyrites strongly recrystallized whose sizes are large. 5,658
to 8,880 less 5,658 1.1-1.33 Medium to high *: 0.4 to 0.3 **: 0.3 Marsh/tidal flat .i .j .k .l .m
Clayey seams and hydromica sticks arranged parallel which can see clearly. The matrix between the sand grains contains opaque iron oxide and calcites. Density and sizes of space pore decreased. Calcite, iron compound and diatom are plentiful.
.i .j .k .l .m .n
Clay arranged parallel. Pyrites recrystallized very strongly. Diatoms are very plentiful. Density and sizes of space pore decreased. Matrix around the tubular diatoms is quite compacted.
8,880 to 13,258 1.17 and 1.423 High to very high 0.45 to 0.4 Estuary channel .n .o
Iron cements, recrystallization of pyrite and calcite strong developed. Density and sizes of space pore significantly decreased. They compacted well.
.o Clays with large sizes arranged parallel. Density and sizes of space pore decreased. And they compacted well. more than 9,910 1.03 Very high 0.5 to 0.45 Article No~e00165 http://dx.doi.org/10.1016/j.heliyon.2016.e00165 2405-8440/ © 2016 The Authors. Published by Elsevier Ltd. This is an open access article under the CC BY-NC-ND license (http://creativecommons.org/licenses/by-nc-nd/4.0/).
differences about the material supply, tidal influence, and characteristics of the clay minerals, age between the upper delta plain and lower delta plain. So, k values for the flood plain, intertidal flat, and sub- to intertidal flat sediments should be: 0.35–0.2 at the CLM1 and VLM1 sites in the upper delta plain, and 0.25 to 0.2 at the BT1, BT2, and BT3 sites in the lower delta plain (Table 7).
4.1.2. Shallow sediment facies associations
Case 2, the delta front facies association with alternation of clay and sand seams was created in the marine environment with high energy. We can realize that a salt flocculation structure with the particle-orientation in a parallelism on the SEM image of the delta front clay at z =−11.1 m (Fig. 15c). The sizes and density of space pore are large (Figs. 14c, e, f, andFig. 15c). The e0values are from 1.2 to 1.9 (Table 7). The plentiful organic material (Figs. 14c, d) in the marine environment made the delta front sediment in the greenish gray (Figs. 2e and f). In truth, according to Braja (1998) the clay that is in the salt flocculation structure is somewhat overconsolidated. Therefore, the OCR on the delta front sediments are somewhat greater than 1 (Fig. 13). The Ivovalues on the delta front cohesive soils at the VLM1 and CTM1 (Takemura et al., 2007) sites largely varied and laid well above the SCL (Burland, 1990) (Fig. 12). Conversely, for the homogenous cohesion soils in the other facies associations, the Ivovalues are close to or below the SCL for the most of the plots (Fig. 12). These results show the microstructure development-level during the post-depositional processes depends on the sedimentary structures and materials. The Cs*/Cs of the delta front cohesive soil on the VLM1 core also vary largely, from 0.19 to 0.82 (Table 6). The cohesive soil specimens of the delta front sediment of the VLM1 core that have a number of thin sand seams are called heterogeneous specimens (Fig. 16b), their Cs*/Csare large, from 0.64 to 0.82 (Table 7). This is due to the sand in the thin seams becomes mixed with clay when the reconstituted sample is prepared, resulting in well-sorted material that may not represent intrinsic properties of the sample. For the homogeneous specimens of the delta front sediment (Figs. 16a, c, and d), the Cs
* / Cs are small, from 0.19 to 0.29, and the smallest in comparison with the others (Table 6); these values just indicate the true level of bond in the delta front cohesive soil. This should be careful in the application of Cs*/Csfor measuring the bonding-level of the cohesive soil of the delta front sediment. The combination of the analyses allows us to infer that the microstructure development-levels of the delta front sediments are low to medium (Table 7). Hence, k values for the delta front sediment in: the lower delta plain with age less than 4 ka BP should be 0.2; and the upper delta plain with age more than 4 ka BP should be 0.3 to 0.2 for calculating OCR by CPTU test in Eq.5(Table 7). The delta front soil samples may be easily disturbed by sampling, transporting, and preparing for tests; especially, the soil samples may be broken at the sand seams. If the delta front soil samples are
saved for a long time, water in the sandy seams may easily go out of the soil sample by the temperature and pressure difference between the below and above conditions of the ground. The delta front facies association appeared in all the investigative sites, from−4 to−21.9 m (Fig. 4,Fig. 5,Fig. 6,Fig. 7andFig. 8). They made the OCR values be different from the true values and commonly less than 1 as report ofMan (2003).
4.1.3. Deep sediment facies associations
Case 3 includes prodelta, bay, estuarine marine, sub- to intertidal flat, marsh, marsh/tidal flat, and estuary channel facies associations. They were at greater depth and formed at the earlier stage than those of case 2, so an ageing strongly occurred. The calcareous incipience and concretions (3 cm in diameter) plentifully presented (Fig. 4a,Fig. 5a, andFig. 7a). The clay minerals and the cohesive soil seams were arranged again that they became more parallel and closer together by the overburden pressure in the post-depositional processes (Figs. 14g, k, andFig. 15d). Simultaneously, the pyrites significantly recrystallized, especially inside the void pores of the petri dish diatom (Fig. 15e). A recrystallization tends to increase from the prodelta to estuary channel sediments (Figs. 14g-o and Fig. 15d-o). This recrystallization of the pyrites is similar to that of the Osaka Bay clay reported by
Tanaka and Locat (1999). The Cs*/Cs in case 3 are so large, from 0.67 to 0.9 (Table 6); the values indicated the bonds in them are so steady. These Cs*/Csvary very small which they indicate the sediments in case 3 except the estuarine marine sediment are rather homogenous. The Cs*/Csof the estuary channel sediment with plentiful organic materials (from−44 to−41.35 m) decrease; namely the Cs
* /Csof the specimen at z =−41.52 m is 0.67 (Table 6). The bonding- and compacting-levels in case 3 increased from the prodelta to the estuary channel sediments (Figs. 14g–o and Figs. 15d–o). The results show that the microstructure development-levels in case 3 are from medium to so high (Table 7). Values of k
[(Fig._16)TD$FIG]
Fig. 16. Observed cross section of test specimens for the IL and CRS tests.
for calculating OCR in Eq.5 for case 3 are such as: For the prodelta and bay sediments in the upper delta plain as at the CLM1 and VLM1 sites should be 0.4–0.3; and in the lower delta plain as at the BT2 and BT3 sites should be 0.3 (Fig. 1,Fig. 4,Fig. 5,Fig. 6,Fig. 7,Fig. 8, andTable 7). The marsh and tidal flat sediments have been at the great depth and age (from 8.88 to 13.258 ka BP); and the recrystallizations of pyrites and hydromicas are very strong, as at the CLM1, VLM1, and BT2 sites (Fig. 4,Fig. 5,Fig. 6,Fig. 7,Fig. 8andFig. 14k). And the bond, the Cs*/Csof the marsh sediment are large (Table 6). These results allow us to infer the microstructure-developments in the marsh and tidal flat sediments are from high to very high; hence, k values should be 0.4 to 0.45 (Table 7). The estuary channel sediment at the VLM1 site has been existing at the greatest depth and age; the pyrites and calcites abundantly recrystallized (Fig. 14n); and the iron cements with reddish brown to dark color distribute throughout in the sediment (Figs. 14n, o). Hence, k values should be 0.5 to 0.45 (Table 7).
The ground continuously increased and the OCR are none less than 1 (Fig. 4,
Fig. 5,Fig. 6,Fig. 7,Fig. 8andFig. 13). And the overconsolidation is due to the cementation, recrystallization, and ageing. Therefore, we should use terms the yield stress ratio for the overconsolidation ratio, and the yield stress for the preconsolidation pressure for the MRD late Pleistocene–Holocene sediments.
4.2. Relationship between the delta formation mechanism and
geotechnical property sequence
We consider the sedimentological column and the geotechnical property sequence at each investigative site and compare them with the different locations.
The marsh/tidal flat facies association of the CLM1 core was more influenced by the fluvial activities than the marsh facies association of the VLM1 core. So the marsh/tidal flat facies association of the CLM1 core had more seams of sand mixture inserting in the layer of clays and silt mixtures (Fig. 4b); and the homogeneous-level is lower than the marsh facies association of the VLM1 core. The ages of the marsh/tidal flat facies association of the CLM1 core (around 11,350 yr BP) are greater than those of the VLM1 core (9,910 to 9,090 yr BP). The differences about the structure, sand seams, and ages cause the strengths and OCR values of the marsh/tidal facies of the CLM1 core higher than those of the marsh facies association of the VLM1 core (Figs. 13a, b). Namely, qtvalues range from 1,250 to 7,050 kPa, and N values range from 11 to 15 at the CLM1 site, whereas at the VLM1 site, qt ranges from 1,200 to 2,400 kPa, and N ranges from 1 to 3 (Figs. 4c, i;Fig. 5c, i). The CLM1 site in the tide-dominated delta was closer to the plentiful material-supply source and fluvial activity. And the grain-size at the riverhead is normally coarser than that at the end of the Mekong River. As a result, the geotechnical property sequences on the deep and shallow sediment facies
associations at the CLM1 site tend to be more cohesionless soils and strengths than those of the VLM1, BT1, and BT2 sites (Fig. 4,Fig. 5,Fig. 6,Fig. 7). In particular, the delta front facies association at the CLM1 site is almost cohesionless soils and the highest strength in comparison with all the facies associations. The materials of the intertidal flat, flood plain, and natural level facies associations of the CLM1 core are commonly fine and an insertion of the thin fine sand seams because at the period the CLM1 site was at a shallow depth and influenced by the fluvial-activity with a low energy. The fining facies associations with an insertion of the thin fine sand seams characterize the tide-dominated delta which their mechanical behaviors are displayed popularly cohesive soils with an insertion of the cohesionless soils (Fig. 4).
At the VLM1 site, the mechanical behaviors of clays and the strengths increasing linearly with depth characterize the fining sediment succession of the marsh facies association (Fig. 5) . The coarsening-upward succession from the bay to prodelta to delta front facies associations at the VLM1 site characterizes the sediment in the tide-dominated delta; and this characteristic is displayed by the mechanical behaviors of cohesive to cohesionless soils with trend to increase highly upward (Fig. 5). The fining-upward succession of the sub- to inter-tidal flat facies associations at the VLM1 and BT1 sites in the tide-dominated delta is characterized by its mechanical behaviors of cohesionless to cohesive soils with trend to increase greatly upward (Fig. 5 andFig. 6). The fining succession of the flood plain and flood plain/marsh facies associations at the VLM1 and BT1 sites is characterized by the mechanical behavior of cohesive soils (Fig. 5andFig. 6). The BT2 and BT3 sites in the tide- and wave-dominated delta, the coarsening-upward succession from the prodelta to delta front facies associations is characterized by the mechanical behaviors of cohesionless soils which tend to increase greatly upward (Fig. 7 and Fig. 8). The mechanical behavior of an alternation of cohesionless soil seam and cohesive soil seam characterizes the sub-to intertidal flat facies association at the BT2 and BT3 sites (Ta et al., 2005) (Fig. 7
andFig. 8). The coarsening-upward foreshore-dune succession in the surface facies association at the BT2 and BT3 sites (Ta et al., 2005) is characterized by the mechanical behaviors of cohesionless soils which tend to increase considerably upward (Fig. 7andFig. 8). The sedimentary characteristics of the BT2 and BT3 sites are displayed their mechanical behaviors tend to be more cohesionless soils and strengths than those of the BT1 and VLM1 sites in the tide-dominated delta (Fig. 5,Fig. 6,Fig. 7,Fig. 8). Especially, the BT3 site was in the tide- and wave-dominated delta but it was significantly wave-dominated by wave; as a result, the geotechnical property sequence tends to be almost cohesionless soils from the prodelta to sand dune facies association (Fig. 8).
The mechanical behaviors of cohesionless soil and strengths increase from the bay facies association at the VLM1 and BT2 sites to the prodelta/bay facies association at the CLM1 site (Fig. 4,Fig. 5andFig. 7). The prodelta/bay facies association of the CLM1 core is generally less homogeneous than the bay facies association of the VLM1 and BT2 cores because the CLM1 site was influenced by the significant fluvial activity and material-supply source more than those of the VLM1 and BT2 sites (Fig. 1). Those changes express the typical coarsening-upward succession from the open to inner bay that it exists in the bay facies association in the VLM1 and BT2 cores to the prodelta/bay facies association in the CLM1 core.
As presented in item 3.2, the contents of illite, kaolinite, and chlorite minerals are large; especially, the illite contents are the largest (Table 3b). The thicknesses of these minerals are large; but specific surface and reciprocal of average surface densities of charges are very small (Braja, 1998). Conversely, the smectite contents are very low from 0.0 to 13% (Table 3b); however, the thickness of this mineral is small and specific surface and reciprocal of average surface densities of charges are so large (Braja, 1998). So, the illite, kaolinite, and chlorite minerals dominated in the microstructure and mechanical behavior; these minerals cannot keep well water on their surface; hence the screen-water covering the mineral particles is not so large. As a result, in general, the consolidation of the argillaceous soil of the MRD late Pleistocene–Holocene sediments is not so slow; the microstructure develop-ment is high; and the plasticity is not extremely high and lower than the Tanan clay (Fig. 11) because the Tanan sediments originated from the Saigon river system. The illilte contents of the CLM1 core are larger than those of the VLM1 core (Truong et al., 2011) but the smectite contents of the VLM1 core are larger than. The illite content of the natural levee facies association is the largest in comparison with the others (Table 3a). In addition, the sand contents of the CLM1 core tend to be larger than those of the VLM1 core (Fig. 3c). Hence, the plasticity of the cohesive soils of the VLM1 core is generally slightly greater than those of the CLM1 core (Fig. 11).
5. Conclusions
The microstructure development-levels of the surface and deep sediment facies associations are very high to high; k values should be greater than 0.3, and 0.5 for the sediments having strong dehydrating and oxidizing or aging and recrystallizing processes. The microstructure development-levels of the shallow sediment facies associations are medium to low; k values should be 0.2–0.3. And k values in the upper delta plain should be greater than those in the low delta plain in the same facies association.
The contents of clay minerals are in descending order from the illite, kaolinite, chlorite, to smectite by the characteristic of material source from the Mekong
River. The illilte contents tend to decrease in the delta progradation-direction while the smectite contents tend to increase. The characteristics of the clay minerals produced the high microstructure development, and plasticity without extremely high one and slightly increasing with reduction of illilte content.
The sediment is in the tide- and wave-dominated delta whose mechanical behavior sequence tends to be more cohesionless soils and strengths than those in the tide-dominated delta from the prodelta to sand dune facies associations. And the coastal sediment significantly dominated by wave its mechanical behavior sequence tends to be almost cohesionless soils and high strength. Especially, the sediment in the tide-dominated delta with significant fluvial-activity and material-supply has the mechanical behavior sequence of more cohesionless soils and strength than those in the delta types. And the typical coarsening-upward succession from the open to inner bay is displayed the increase of the mechanical behaviors of cohesionless soils and strength in the bay facies association in the tide-dominated delta to the prodelta/bay facies association in the tide-dominated delta with significant fluvial-activity and material-supply.
Declarations
Author contribution statement
Truong Minh Hoang, Nguyen van Lap, Ta Thi Kim Oanh, Takemura Jiro: Conceived and designed the experiments; Performed the experiments; Analyzed and interpreted the data; Contributed reagents, materials, analysis tools or data; Wrote the paper.
Funding statement
This work was supported by the Japanese Society for the Promotion of Science. This work was also supported by Vietnam National University Ho Chi Minh City under grant number C2014-18-03 for the Caolanh site, and partly by the NAFOSTEDED Vietnam project 105.01-2012.25 for the works about the sedimentary geology in the Bentre province.
Competing interest statement
The authors declare no conflict of interest.
Additional information
No additional information is available for this paper.
Acknowledgments
The authors would like to thank the Port and Airport Research Institute at Yokosuka, Japan, the Civil Engineering Department-TIT for creating favorable conditions to conduct the tests and collect the documents. We are grateful to the TEDI South for collaboration in conducting the tests. We thank the two reviewers who have kindly given their time and expertise to comment on the paper. We also express our gratitude to Dr. Claudia Lupp and Editor’s comments and encouragement.
References
Andresen, A., Kolstad, P., 1979. The NGI 54 samplers for undisturbed sampling of clays and representative sampling of coarser materials. Proc. Intn. Sympo. on Soil Sampling, Singapore, 13–21.
Braja, M.D., 1998. Principles of geotechnical engineering, Fourth Edition International Thomson Publishing 712.
Burland, J.B., 1990. On the compressibility and shear strength of natural clays. Geotechnique 40 (3), 329–378.
Head, K.H., 1985a. Soil classification and compaction tests, 1 Pentech press, London.
Head, K.H., 1985b. Permeability, Shear Strength and Compressibility Tests, 2 Pentech press, London, pp. 581–729.
Hibbard, M.J., 1995. Petrography to Petrogenesis. Prentice-Hall Inc. A Division of Simon & Schuster, Inc., Englewood Cliffs, New Jersey 07632, pp. 587.
Japan Geotechnical Society (JGS), 2000. Test method for one-dimentional consolidation properties of soils using constant rate of strain loading. JGS 0412, Laboratory Soil Testing Methods, JGS, 389–414.
Lunne, T., Robertson, P.K., Powell, J.J.M., 1997. Cone Penetration Testing in Geotechnical Practice. Spon Press, Taylor and Fracis Group, London and New York, pp. 312.
Man, B.T., 2003. Initial estimation consolidation characteristics of soft Mekong Delta clay for engineering practice. Proc. Intn. Workshop of Hanoi Geoengineering 2003 & 2004, 37–49.
Mitchell, J.K., 1976. Fundamentals of soil behavior. University of California, Berkeley, pp. 422.