Cornell University ILR School Cornell University ILR School
DigitalCommons@ILR
DigitalCommons@ILR
Federal Publications Key Workplace Documents
3-31-2011
The Hispanic Labor Force in the Recovery
The Hispanic Labor Force in the Recovery
United States Department of LaborFollow this and additional works at: https://digitalcommons.ilr.cornell.edu/key_workplace
Thank you for downloading an article from DigitalCommons@ILR. Thank you for downloading an article from DigitalCommons@ILR.
Support this valuable resource today! Support this valuable resource today!
This Article is brought to you for free and open access by the Key Workplace Documents at DigitalCommons@ILR. It has been accepted for inclusion in Federal Publications by an authorized administrator of DigitalCommons@ILR. For more information, please contact [email protected].
If you have a disability and are having trouble accessing information on this website or need materials in an alternate format, contact [email protected] for assistance.
The Hispanic Labor Force in the Recovery
The Hispanic Labor Force in the Recovery
AbstractAbstract
[Excerpted] At nearly 23 million, people of Hispanic or Latino ethnicity represented 15 percent of the United States’ labor force in 2010. By 2018, Hispanics are expected to comprise 18 percent of the labor force.
In 2010, 59 percent of Hispanics aged 16 and over were employed and just under 1 in 5 of those
employed were working part-time. Forty-one (41) percent of all employed Hispanics in 2010 were women, compared to 46 percent among employed whites. Women represent a smaller share of the Hispanic labor force both because of the high labor force participation of Hispanic men and the lower labor force participation rate of Hispanic women compared to whites.
Keywords Keywords
Hispanics, ethnicity, labor market, economic recovery, data
Comments Comments
Suggested Citation Suggested Citation
Department of Labor. (2011). The Hispanic labor force in the recovery [Electronic version]. Washington, DC: Author.
The Hispanic
Labor Force
in the Recovery
U.S. Department of Labor
THE HISPANIC LABOR FORCE AT A GLANCE • PAGE 1
THE HISPANIC LABOR FORCE AT A GLANCE
At nearly 23 million, people of Hispanic or Latino ethnicity represented 15 percent of the United States’ labor force in 2010. By 2018, Hispanics are expected to comprise 18 percent of the labor force.
In 2010, 59 percent of Hispanics aged 16 and over were employed and just under 1 in 5 of those employed were working part-time. Forty-one (41) percent of all employed Hispanics in 2010 were women, compared to 46 percent among employed whites.1 Women represent a smaller share of the Hispanic labor force both because of the high
labor force participation of Hispanic men and the lower labor force participation rate of Hispanic women compared to whites.
Employed Hispanics are much less likely to have a college degree than are either whites or blacks.2 Approximately one
in six employed Hispanics aged 25 and over have completed a bachelor’s degree, less than half the proportion among employed whites. This gap in the share of employed Hispan-ics and whites who are college graduates has widened over the past decade. Between 2000 and 2010, the gap between employed whites with a col-lege education and employed Hispanics with a college educa-tion grew from 17.6 percent-age points to 19.2 percentpercent-age points.
Hispanics are more likely than either whites or blacks to be employed in the private sector, with more than 8 in 10 employed Hispanics working in the private sector, not including the unincorporated self-employed. Conversely, Hispanics are less likely to work for government than are either whites or blacks. Self-employment is a growing alternative to private sector employment among Hispanics.
In 2010, 6.3 percent of Hispanics were self-employed. According to the most recent Census Bureau Survey of Business Owners (2007), Hispanic-owned businesses are the fastest growing small business sector, expanding at nearly twice the rate of the national average between 2002 and 2007.
1 Hispanics who select white when identifying race are included in white category as well as the Hispanic category. 2 Hispanics who select black when identifying race are included in black category as well as the Hispanic category.
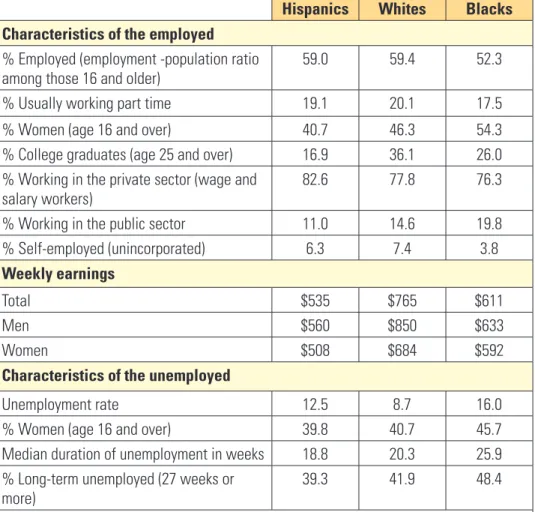
Table 1. Unemployment, employment, and earnings characteristics by race and Hispanic ethnicity, 2010 annual averages
Hispanics Whites Blacks
Characteristics of the employed
% Employed (employment -population ratio among those 16 and older)
59.0 59.4 52.3 % Usually working part time 19.1 20.1 17.5 % Women (age 16 and over) 40.7 46.3 54.3 % College graduates (age 25 and over) 16.9 36.1 26.0 % Working in the private sector (wage and
salary workers) 82.6 77.8 76.3 % Working in the public sector 11.0 14.6 19.8 % Self-employed (unincorporated) 6.3 7.4 3.8
Weekly earnings
Total $535 $765 $611 Men $560 $850 $633 Women $508 $684 $592
Characteristics of the unemployed
Unemployment rate 12.5 8.7 16.0 % Women (age 16 and over) 39.8 40.7 45.7 Median duration of unemployment in weeks 18.8 20.3 25.9 % Long-term unemployed (27 weeks or
more) 39.3 41.9 48.4
Source: Bureau of Labor Statistics, Current Population Survey
Note: Persons whose ethnicity is identified as Hispanic or Latino may be of any race. Those identified as White or Black includes those Hispanics who selected White or Black when queried about their race.
THE HISPANIC LABOR FORCE AT A GLANCE • PAGE 2
Half of Hispanics working full-time earned $535 or more per week in 2010. This median weekly wage was only 70 percent of that earned by whites. This gap in earning has been largely stable over the recession and recovery period. The unemployment rate averaged 12.5 percent among Hispanics in 2010. The most recent unemployment report in February 2011 shows that the economic situation is improving for all Americans, including Hispanics, who have seen their unemployment rate decline to 11.6 percent. In addition, unemployed Hispanics experience a shorter duration of unemployment and are less likely to join the ranks of the long-term unemployed than are either their white or black counterparts. However, the higher rate of unemployment among all Hispanics means that a greater share of Hispanics will experience long-term unemployment than will whites.
PERIODS OF HIGH UNEMPLOYMENT
Unemployment rate peaked for this business cycle at 10.1 percent in October 2009. Among Hispanics, the unem-ployment rate reached a high of 13.2 percent the following year in November 2010, while it peaked for whites at 9.4 percent in October 2009 and at 16.5 percent among blacks in April 2010 (see Chart 1). These racial differences, with Hispanics having higher unemployment rates than whites, but lower than blacks, are long-standing. For example, in the year in which the recession started, 2007, the unemployment rate for Hispanics was 5.6 percent, compared to 4.1 percent for whites and 8.3 percent for blacks.
While the unemployment rate peaked for Hispanics a year af-ter it peaked among whites, the unemployment rate remained elevated for all groups from the fall of 2009 through much of 2010. As illustrated in Chart 1, Hispanics faced an unem-ployment rate of 13.1 percent in October 2009 when the rate peaked among whites. The gap in the unemployment rates of Hispanics and whites was largely steady between October 2009 and November 2010 at approximately 3.7 percent-age points. Since reaching its high point in November 2010, the overall Hispanic unem-ployment rate has fallen by 1.6 percentage points.
Chart 2 shows annual unemployment averages for Hispanic men, women, and youth (ages 16-19).3 While the
un-employment rate among Hispanic men continues to be slightly higher than that of Hispanic women, the gap is nar-rower in 2010 compared to 2009. This narrowing occurred as unemployment among adult Hispanic men was little changed, while it rose among adult Hispanic women. There are several factors that could have contributed to the increase in unemployment among Hispanic women, including their disproportionate participation in industries that have continued to experience job losses, such as state and local government. For example, 55.1 percent of Hispanic government workers were women in 2010. Moreover, there are industries—like manufacturing—where Hispanic women lost jobs in 2010, while Hispanic men gained jobs.
3 Monthly seasonally adjusted data are not available for Hispanic men, women, and youth. As such, annual averages provide a more accurate picture of changes in unemployment for these groups over time.
Chart 1: Unemployment Rate for African-American, Hispanics and Whites: Jan 2007-Feb 2011
THE HISPANIC LABOR FORCE AT A GLANCE • PAGE 3
As Chart 2 also illustrates, Hispan-ic youth (ages 16-19) have much higher unemployment rates than do adults. The unemploy-ment rate for Hispanic youth reached a high of 32.2 percent in 2010 and as of February 2011 had fallen to 30.6 per-cent4. Not only has the
unem-ployment rate remained high, but a large number of Hispanic teens are no longer in the labor force—either working or look-ing for work. In 2007, Hispanic teens participated in the labor force at a rate of 37.1 percent. By 2010, that rate had declined substantially to 30.9 percent. Some of this decline in labor force participation among teens
reflects an increase in the percent of teens in school. Among 16-19 year old Hispanics 74.0 percent were students in 2010 compared to 69.5 percent in 2007, the year the recession started.
Falling labor force participation is occurring among all but the oldest Hispanics; however the declines are greatest for those who are young. Among those ages 20 to 24, labor force participation fell to 71.1 percent in 2010 from 74.8 percent in 2007. While this decline is smaller than that experienced by teenagers, there was an even larger increase in the proportion of this age group remaining in school—28.1 percent of 20 to 24 year old Hispanics were students in 2010 compared to 22.1 percent in 2007. Declines in labor force participation were much less for those ages 25 to 54, and the rate actually rose for those age 55 and over. Among all Hispanics 67.5 percent were in the labor force in 2010 compared to 68.8 percent in 2007.
One factor that may explain why Hispanic labor force outcomes lag behind those of their white counterparts is educational attainment. As is true for all racial and ethnic groups, the link between greater educa-tion attainment and improved employment outcomes remains strong.
Unemployment rates are lowest among those with a bachelor’s degree or higher. For instance, the 2010 unemployment rate among Hispanics with at least a bachelor’s degree was 6.0 per-cent, (compared to 4.3 percent for whites). Unemployment
4 These are not seasonally adjusted rates as unemployment rates by age are not available seasonally adjusted for Hispanics. However comparing February 2011 to February 2010 also indicates an improvement in the unemployment rate among Hispanic youth
Bachelor’s degree or higher
6.0%
Less than a
High School diploma High School graduates Associate degreeSome college or 18 16 14 12 10 8 6 4 2 0 Unemployment Rate 13.2% 11.5% 9.7%
Chart 2: Unemployment Rate among Hispanics Adult Men, Adult Women, and Youth (Annual data 2007 through 2010)
Source: Bureau of Labor Statistics, Current Population Survey
Source: Bureau of Labor Statistics, Current Population Survey
Chart 3: Unemployment Rate for Hispanics, by Educational Attainment, 2010 Annual Average
THE HISPANIC LABOR FORCE AT A GLANCE • PAGE 4
rates are higher for those with fewer years of schooling. In 2010, 11.5 percent of Hispanics in the labor force with only a high school degree were unemployed (compared to 9.5 percent of whites with only a high school degree) and 13.2 percent of Hispanics in the labor force with less than a high school degree (compared to 13.9 percent among whites with less than a high school degree) were unemployed.
Unemployment varies across the United States and the unemployment rate of Hispanics, like that of other Ameri-cans, differs depending on the state in which they live. Hispanics facing the highest unemployment rates are in Rhode Island (21.8 percent), Nevada (18.6 percent), Connecticut (17.7 percent), Massachusetts (16.1 percent) and Washington (15.8 percent), while those facing the lowest rates are in Vermont (3.8 percent), Virginia (6.9 percent), Alaska (6.9 percent), South Dakota (7.2 percent) and Nebraska (7.5 percent).
The supplemental map at the end of this report highlights the states where the largest numbers of unemployed His-panic workers reside. As one would expect, states with the largest HisHis-panic populations had very large numbers of unemployed Hispanic workers. Overall in 2010, California (945,000), Texas (410,000), Florida (270,000), New York (174,000), Arizona (124,000), and Illinois (112,000) had the most unemployed Hispanics. The unemployment rates in these states were: California (14.7 percent), Texas (9.4 percent), Florida (13.6 percent), New York (11.8 percent), Arizona (13.4 percent) and Illinois (12.7 percent).
EMPLOYMENT DATA
As Chart 4 illustrates, 2010 employment rates for white and Hispanic men and women remain below pre-recession levels. Overall, white and Hispanic men are employed at higher rates than are white and Hispanic women; however employment rates have fallen much more sharply among men than among women since the 2007 recession began. Hispanic employment declined most significantly in construction, manufacturing, financial activities, and in profes-sional and business services during the recession of 2007-2009. Together, these industries accounted for nearly 1.1 million jobs lost among Hispanic workers. Job losses continued through 2010 in construction and financial services industries, while Hispanic employment in professional and business services experienced a strong recovery.
Hispanics account for almost one in every four workers in the construction industry. As Table 2 shows, employ-ment in the construction indus-try is projected by the Bureau of Labor Statistics to grow a modest 1.7 percent annually by 2018, with much of this growth replacing jobs lost during the recession. Jobs in the profes-sional, scientific and technical service industry are expected to grow the fastest with 2.6 mil-lion additional jobs projected for 2018 compared to 2008. In 2010, only 7.1 percent of jobs in this industry went to Hispanic workers, making them under-represented in this high-growth industry. Hispanics are underrepre-sented in STEM occupations—account-ing for seven percent or less of jobs—in
math and science related occupations, such as computer and mathematical occupations (5.5 percent), architecture and engineering occupations (6.8 percent), and life, physical, and social science occupations (6.0 percent).
Chart 4: Employment Population ratio by sex for Whites and Hispanics, 16 and older (Annual data 2007 through 2010)
THE HISPANIC LABOR FORCE AT A GLANCE • PAGE 5
Table 2: Industries with largest expected employment growth, BLS Employment Projections 2008-2018
Industry Annual average rate of change 2008-20181 Hispanics as a percent of total employed by industry in 20102
Professional, scientific, and technical services 3.0% 7.1% Education services 2.4% 9.5% Health and social services 2.3% 10.9% Construction 1.7% 24.4%
Source: Bureau of Labor Statistics. Released December 11, 2009
1Employment Projections presented here are based on Current Employment Statistics data. The projections are found at http://www.bls.gov/news.release/
archives/ecopro_12102009.pdf
2These data are from the Current Population Survey.
OCCUPATIONAL SAFETY AND HEALTH
Overall work-related fatalities declined in 2009, the most recent year for which data is available. According to pre-liminary estimates from the Bureau of Labor Statistics, in 2009 Hispanic workers experienced the highest rate of work-related fatal injuries at 3.7 incidents per 100,000 full time equivalent workers, compared to 3.4 for whites and 3.0 for blacks. Hispanic workers experienced 17 percent fewer work related fatal injuries in 2009 compared to 2008. Certain industries, including construction have historically accounted for a significant share of fatal work injuries, though reported fatalities in this industry have also significantly declined. The number of fatal injuries in the private construction industry fell by 16 percent in 2009, following a similar decline of 19 percent in 2008.
The decline in fatal work injuries among Hispanic workers in 2009 was largest for foreign-born Hispanic workers, whose fatal work injury counts decreased by 22 percent. In comparison, the decline among native-born Hispanics was 9 percent. Fatal work injuries incurred by workers who were born outside of the United States accounted for 16 percent of the U.S. total in 2009. Of the foreign-born workers who were fatally-injured in the U.S. in 2009, the largest share (40 percent) was Mexican-born.
LOOKING FORWARD
The economic recovery to date has improved employment prospects for all Americans. However, more needs to be done to get Hispanics back to work. The Department of Labor is working alongside other agencies in the Obama Administration to address the challenging labor market conditions facing Hispanic workers, including:
➢ Transitioning more Hispanic youth to employment through programs targeting individuals affected by high poverty and high unemployment, as well as through programs directed to the youth. Programs such as the De-partment of Labor’s (DOL) Job Corps and Youth-Build programs provide job training and educational opportu-nities for low-income or at-risk youth ages 16 to 24. There are 2,366 Hispanics enrolled in YouthBuild and 8,022 Hispanics enrolled in Job Corps5, representing more than 18 percent of participants in each program. More than
58 percent of Hispanic youth separating from Job Corps in program year 2009 received their GED6 – more than
two percent higher than the national high school graduation rate.
➢ Providing training opportunities to involve Hispanics in the clean energy economy is important. In 2010, DOL awarded the following Recovery Act grants designed to advance training and employment in these industries. • “Pathways Out of Poverty” grants provided $150 million to support programs that help disadvantaged
populations find ways out of poverty and into economic self-sufficiency through employment in energy efficiency and renewable energy industries.
5 Job Corps’ Executive Information System Population Report from March 22, 2011. 6 Ibid
THE HISPANIC LABOR FORCE AT A GLANCE • PAGE 6
• “Energy Training Partnership” grants provided $100 million for job training in energy efficiency and clean energy industries, as authorized by the Recovery Act. The grants support job training programs to help dislocated workers and other target populations, including communities of color, find jobs in expanding green industries and related occupations.
➢ Increasing college attendance and graduation rates among Hispanics and encouraging more Hispanics to pursue careers in science, engineering and technology. The President’s initiative of “Skills for America’s Future” seeks to: increase the number of college graduates; increase training in science, technology and engineering, and math-ematics; and improve industry partnerships with community colleges or training programs by matching class-room curricula with employer needs.
➢ In January 2011, the Department of Labor announced the availability of approximately $500 million for the first round of Trade Adjustment Assistance Community College and Career Training Grants. The program will en-able eligible institutions of higher education, including but not limited to community colleges, to expand their capacity to provide quality education and training services to Trade Adjustment Assistance program participants and other individuals. The overarching goals of these grants are to increase attainment of degrees, certificates, and other industry-recognized credentials and better prepare workers, for high-wage, high-skill employment. ➢ DOL offers other training and employment programs that provide opportunities for Hispanics. The Wagner-Peyser program, for example, provides a full range of employment and training services to jobseekers includ-ing career guidance, testinclud-ing, job development, and job referral. DOL regulations require states to ensure that Wagner-Peyser services are offered to migrant and seasonal farmworkers (MSFWs) on a basis that is equivalent and proportional to the services offered to non-MSFWs. Fifteen (15) percent of individuals served by Wagner-Peyser are Hispanic. The National Farmworker Jobs Program (NFJP), a job training and employment assistance program for MSFWs, provides job training services to eligible farmworkers to help them prepare for jobs that provide stable, year-round employment and better wages. Fifty-one (51) percent of participants in the NFJP are Hispanic.
➢ Among the most vulnerable workers in America are those who work in high-risk industries, particularly con-struction. Because of language barriers, literacy and other limitations, these workers, many of whom are of His-panic origin, are often hard to reach through traditional communications methods. The Occupational Safety and Health Administration (OSHA) and Wage and Hour Division (WHD), two of DOL’s worker protection agencies, are working to address this problem and reduce incidences of workplace injuries and fatalities and violations of wage and hour laws. They have increased outreach efforts to enhance workers’ knowledge of their workplace rights and improve their ability to exercise their rights, including education about how to file complaints with the Department. In addition, OSHA has reminded employers to comply with requirements that they must pres-ent information about workers’ rights, safety and health training materials, information and instructions in a language that their workers can understand. The Secretary has also reiterated OSHA and WHD’s long-standing partnership with the Mexican Consulates by signing a formal declaration with the Mexican Embassy. Most re-cently, the Secretary signed a declaration with the government of El Salvador to ensure the labor rights of work-ers from these countries employed in the U.S. are protected.
➢ The Department’s Wage and Hour Division is enhancing its enforcement of the misclassification of workers which may result in the failure of employers to pay appropriate payroll taxes, workers’ compensation, other em-ployment benefits, or proper minimum wage or overtime. As a result of misclassification, employees are denied the protections and benefits of this Nation’s most important employment laws—protections to which they are legally entitled. Misclassification more frequently occurs in industries that employ a large number of vulnerable workers, many of whom are of Hispanic or Latino origin. The President requested funding in FY2012 for DOL to lead a multi-agency initiative to strengthen and coordinate Federal and State efforts to enforce statutory pro-tections, and identify and deter employee misclassification. This initiative will help provide employees with their rightful pay and benefits.
THE HISPANIC LABOR FORCE AT A GLANCE • PAGE 7