Durham Research Online
Deposited in DRO:
12 September 2017
Version of attached le:
Accepted Version
Peer-review status of attached le:
Peer-reviewed
Citation for published item:
Perks, M.T. and Warburton, J. and Bracken, L.J. and Reaney, S.M. and Emery, S.B. and Hirst, S. (2017) 'Use of spatially distributed time-integrated sediment sampling networks and distributed ne sediment modelling to inform catchment management.', Journal of environmental management., 202 . pp. 469-478.
Further information on publisher's website:
https://doi.org/10.1016/j.jenvman.2017.01.045 Publisher's copyright statement:
c
2017 This manuscript version is made available under the CC-BY-NC-ND 4.0 license
http://creativecommons.org/licenses/by-nc-nd/4.0/
Use policy
The full-text may be used and/or reproduced, and given to third parties in any format or medium, without prior permission or charge, for personal research or study, educational, or not-for-prot purposes provided that:
• a full bibliographic reference is made to the original source
• alinkis made to the metadata record in DRO
• the full-text is not changed in any way
The full-text must not be sold in any format or medium without the formal permission of the copyright holders. Please consult thefull DRO policyfor further details.
Durham University Library, Stockton Road, Durham DH1 3LY, United Kingdom Tel : +44 (0)191 334 3042 | Fax : +44 (0)191 334 2971
1
Use of spatially distributed time-integrated sediment sampling networks and distributed fine sediment modeling to inform catchment management
Perks M.Ta*, Warburton Jb, Bracken L. Jb, Reaney S.Mb, Emery S.Bc, Hirst Sd
a School of Geography Politics and Sociology, Newcastle University, Newcastle upon Tyne NE1 7RU, United Kingdom.
b Department of Geography, Durham University, Durham DH1 3LE, United Kingdom.
c School of Geography, Earth and Environmental Sciences, University of Birmingham, Edgbaston, Birmingham B15 2TT, United Kingdom.
d North York Moors National Park Authority, The Old Vicarage, Helmsley, North Yorkshire, YO62 5BP, United Kingdom.
* Corresponding author - [email protected]
Submitted to the Journal of Environmental Management (SI: Enlarging spatial and temporal scales for biophysical diagnosis and sustainable river management).
Abstract
Under the EU Water Framework Directive, suspended sediment is omitted from environmental quality standards and compliance targets. This omission is partly explained by difficulties in assessing the complex dose-response of ecological communities. But equally, it is hindered by a lack of spatially distributed estimates of suspended sediment variability across catchments. In this paper, we demonstrate the inability of traditional, discrete sampling campaigns for assessing exposure to fine sediment. Sampling frequencies based on Environmental Quality Standard protocols, whilst reflecting typical manual sampling constraints, are unable to determine the magnitude of sediment exposure with an acceptable level of precision. Deviations from actual concentrations range between -35 and +20% based on the interquartile range of simulations. As an alternative, we assess the value of low-cost, suspended sediment sampling networks for quantifying suspended sediment transfer (SST). In this study of the 362 km2 upland Esk catchment we observe that spatial patterns of sediment flux are consistent over the two year monitoring period across a network of 17 monitoring sites. This enables the key contributing sub-catchments of Butter Beck (SST: 1141 t km2 yr-1) and Glaisdale Beck (SST: 841 t km2 yr-1) to be identified. The time-integrated samplers offer a feasible alternative to traditional infrequent and discrete sampling approaches for assessing spatio-temporal changes in contamination. In conjunction with a spatially distributed diffuse pollution model (SCIMAP), time-integrated sediment sampling is an effective means of
2
identifying critical sediment source areas in the catchment, which can better inform sediment management strategies for pollution prevention and control.
1 Introduction
Fine sediment (< 2mm) is an essential, naturally occurring component of freshwater ecosystems, critical for habitat heterogeneity and ecosystem functioning (Owens et al., 2005). However when elevated levels persist, sediment sensitive species are affected and ecological degradation can occur (Collins et al., 2011). The negative impacts of fine sediment, as a diffuse pollutant, are widely acknowledged (cf. Bilotta and Brazier, 2008), and it is the sixth most common cause of water bodies failing to achieve good ecological status in England (Environment Agency, 2015). There is an implicit assumption within the EU Water Framework Directive (European Community, 2000) that fine sediment will be monitored by authorities in order to both effectively characterise the conveyance of adsorbed compounds and to establish
whether sediment conditions contribute to ‘good ecological status’ (Collins and Anthony, 2008). However fine sediment itself is not one of the 33 priority physio-chemical substances and as such is not subject to Environmental Quality Standards and compliance targets (Crane and Babut, 2007). Indeed, following the repeal of the EU Freshwater Fish Directive (European Union, 2006) in 2013, which set a suspended sediment standard of 25 mg L-1, there is still no accepted critical threshold of exposure. Such ambiguity has led to calls for fine sediment to have a more explicit profile in diffuse pollution policy (Collins and McGonigle, 2008). Although the omission of legally-binding suspended sediment standard(s) can, to an extent, be explained by complexities in the dose-response relationship between the composition and quantity of sediment, and the sensitivity of receiving ecological communities (e.g. Collins et al., 2011; Moss, 2008); this is exacerbated by the inability of authorities to obtain meaningful spatially distributed estimates of the variability in suspended sediment fluxes and its physical properties (Brils, 2008). These factors make it impractical for any theoretically sound, legally-binding, suspended sediment thresholds to be implemented given the operational protocols currently available to competent authorities.
Because current guidelines do not require an integrated assessment of fine sediment transport and its properties, routine sediment sampling strategies adopted by authorities involve sampling of accumulated sediment deposited on the channel bed. However, not only does this sampled material represent a historical pollution state, the presence of turbulent conditions, bioturbation, or low sedimentation rates, can result in the misrepresentation of the prevalent physical properties of fine sediment in the river system (Crane, 2003; Schubert et al., 2012). An alternative, and the most commonly adopted approach is sampling the typically fine, suspended particulate material directly from the water column (Greenwood et al., 2007; Madrid
3
and Zayas, 2007). However, due to resource constraints and the complex temporal distribution of naturally transported fine sediment, these approaches are typically biased towards lower flows and concentrations (Carere et al., 2012; Johnes, 2007). These strategies rarely capture the state of the system when erosive processes, and connectivity across the catchment are most active (Ockenden et al., 2016; Perks et al., 2015), failing to reflect the nature of sediment-associated pollutant transport at appropriately high temporal and spatial scales (Eriksson et al., 2007; Horsburgh et al., 2010). As such, these monitoring campaigns are not robust or rigorous enough to provide realistic estimates of fluxes, or average pollutant concentrations (Etchells et al., 2005; Gray, 1999; Irvine et al., 2002). Investment in automated sampling systems can generate better estimates through flow-proportional, probability and stratified sampling methods (e.g. Braskerud, 2001; Thomas and Lewis, 1995), whilst surrogate technologies may generate meaningful high-resolution datasets (Collins et al., 2011; Owen et al., 2012). However, the application of such technology across catchments is currently unfeasible, or restricted, due to authorities seeking to reduce the cost of non-essential monitoring where possible (Skarbøvik et al., 2012). Whilst this is cause for concern, it does present an important opportunity to develop and test low-cost tools and technologies that are capable of capturing suspended sediment data at an appropriate scale for detecting changes in fine sediment dynamics, and at a resolution sufficient to inform specific catchment management strategies.
Whilst monitoring for the protection of aquatic habitats is an important step-forward, there is also a need for current research to develop frameworks that better characterise spatial variability in fluvial suspended sediment flux and more closely specify provenance of sediment at enhanced spatio-temporal resolutions (Fryirs, 2012; Owens and Collins, 2005; Wainwright et al., 2011). Such frameworks will address the current dearth of knowledge about the impacts of land-use on the temporal discontinuity of fluvial suspended sediment transfer and facilitate appropriate catchment-scale management strategies through better understanding of the scale dependence of sediment yields (Jansson, 1988; Mills et al., 2008). This raises the important question of whether low-cost spatially distributed sampling networks can provide fine sediment data at a precision that can enhance understanding of how these dynamic fluvial systems operate.
The aim of this paper is to demonstrate how novel, low-cost time-integrated networks provide essential information about the exposure, quality and composition of suspended sediment in fluvial networks draining upland and piedmont zone catchments of significant size (101 - 102 km2). We contend that programmes based upon infrequent sampling are often unsuitable, and whilst high-frequency traditional sampling and surrogate (turbidity) monitoring programmes
4
are essential to meet critical regulatory commitments (e.g. discharges from wastewater treatment plants), lower cost, time-integrated suspended sediment sampling networks (e.g. Perks et al., 2014) may be used by competent authorities to assess spatio-temporal changes in contamination status across catchments. We demonstrate this through the presentation of: (i) the uncertainty in characterising the sediment transport regime through evidence gathered by a synthetic sampling programme logistically constrained to represent a typical environmental quality standards style assessment; (ii) data generated by a low-cost time-integrated network which is used to provide evidence of catchment-wide variations in suspended sediment flux; and (iii) an illustration of how distributed sampling networks and risk modelling can be used in conjunction to inform sediment management plans for the delivery of adequate pollution prevention and control.
2 Regional and Catchment Setting
This study takes place in the 362 km2 River Esk catchment, located in the North Yorkshire region of Northern England, UK (Figure 1). The climate is cool, temperate-maritime with annual average rainfall of less than 1000 mm. The catchment is underlain by sandstone, siltstone and mudstone formations of the mid and lower Jurassic periods with the River Esk originating as a group of upland springs at Esklets on Westerdale Moor at an altitude of 432 m above sea level. Several major tributaries of the Esk, orientated south-west to north-east, drain the upland plateau which is dominated by the largest area of heathland in England (Boon et al., 2015; Evans et al., 2014). Beyond the upland plateau, pasture and rough grazing dominate in the headwaters with some woodland and improved grassland prevalent in the middle and lower reaches of the Esk valley and along riparian river corridors (Figure 1). The formerly glaciated Esk valley accommodates a meandering river that traverses the landscape for 42 km from West to East, before joining the North Sea at Whitby. Here, flow can approach 950 m3 s-1 during extreme events. The Esk is one of only two nationally recognised Atlantic salmon Salmo salar rivers in Yorkshire, and it supports a regionally important sea trout Salmo
trutta population. It is also one of only two rivers on the east coast of England to have known
populations of the freshwater pearl mussel, Margaritifera margaritifera (Geist, 2005). This species is one of the most critically endangered bi-valves in the world, with siltation and excessive suspended sediment concentrations being attributed to causing their decline (Walling et al., 2001). This has led to local conservation and restoration efforts being undertaken by the competent authorities over the last 20 years (Arnold-Forster, 2002; Emery, 2010; Emery et al., 2013; Perks and Warburton, 2016).
5
Figure 1. Map providing the regional setting of the Esk catchment (white outline) in the NE of England, UK (inset). Map projection: OSGB 1936 British National Grid. Numeric values represent the monitoring station locations and identifiers. Identifier names with (T) appended indicate turbidity monitoring stations. Background map: USGS Landsat 8 imagery (captured October 2nd 2015).
3 Materials and Methods
Field data presented herein were collected in the Esk catchment from a network of 17 spatially distributed monitoring sites (Perks et al., 2016e), with high temporal resolution turbidity monitoring at two primary locations (Perks et al., 2016b, c), over a two year period spanning the 2008 and 2009 hydrological years (Figure 1). Results were compared with the SCIMAP spatially distributed modelling approach, which was developed to predict diffuse pollution risk across catchments (Reaney et al., 2011).
3.1 Field Data Collection
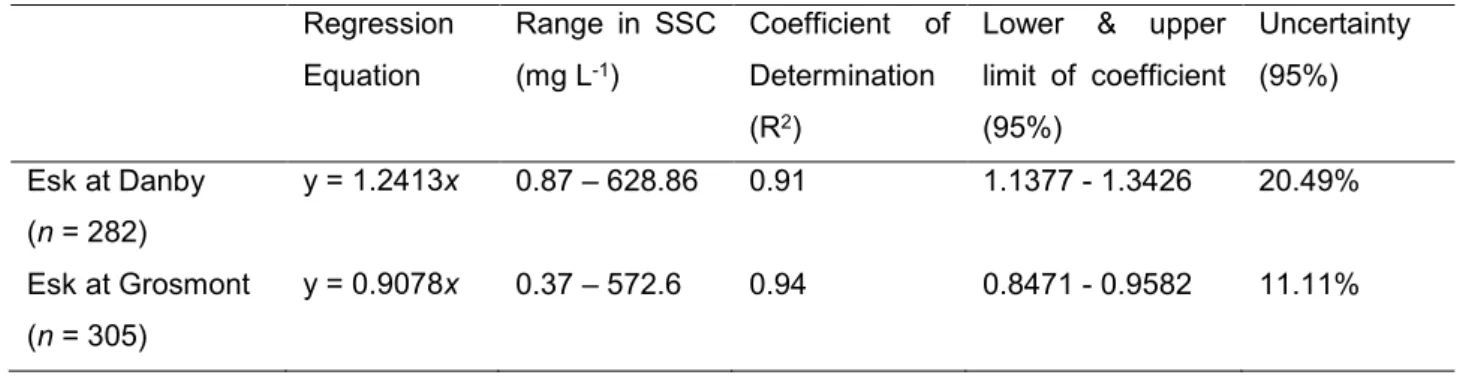
Turbidity monitoring stations were installed at Danby (13) and Grosmont (17) along the main River Esk (Figure 1). Turbidity measurements were made using McVan Analite 395 nephelometers at 15-min intervals as a surrogate for suspended sediment concentrations (SSCs). Prior to deployment, each probe was calibrated against varying concentrations of Formazin (C2H4N2) solution to assess the stability, sensitivity and linearity of response. Further site specific calibrations between Formazin calibrated turbidity (FTU) and SSC were established using the method presented in Perks et al. (2014). These calibrations are within the 25% uncertainty range, deemed acceptable for the range of observed suspended sediment concentrations, as set out by Gray et al. (2002) (Table 1).
6 Regression Equation Range in SSC (mg L-1) Coefficient of Determination (R2)
Lower & upper limit of coefficient (95%) Uncertainty (95%) Esk at Danby (n = 282) y = 1.2413x 0.87 – 628.86 0.91 1.1377 - 1.3426 20.49% Esk at Grosmont (n = 305) y = 0.9078x 0.37 – 572.6 0.94 0.8471 - 0.9582 11.11%
Table 1. Statistics of the site specific field calibrations of turbidity probes. All relationships are significant at the 99.9% level. The location of the sites (Danby – 13; Grosmont – 17) is shown in Figure 1.
An additional seventeen time-integrated sediment samplers were deployed and maintained throughout the sampling period (Figure 1). These devices were essentially a modified version of the Phillips et al. (2000) sampler consisting of a 1 m long cylindrical plastic pipe with an 8 mm diameter inlet and outlet positioned perpendicular to the flow. Flow enters the inlet and passes into a 90 mm wide chamber where the sudden expansion results in a significant reduction in velocity, encouraging sedimentation of fine particles. At approximately monthly intervals the sampler was removed from the metal uprights secured to the river bed and the contents emptied into 5-L containers. This sampling interval ensured that a sufficient mass of material was accumulated for subsequent analysis. Samples were allowed to settle in a cold store (< 4°C) for four days before the supernatant was siphoned off and discarded, taking care not to disturb the sediment. Analysis showed that the supernatant contained on average 0.12% of the total mass of collected sediment. The sediment was rinsed from the container and placed in an oven at 40 °C until dry. The mass of the material was then determined. Occasionally, the intake of the in-stream sampler can become obstructed by naturally occurring debris resulting in temporarily compromised sampling rates. It is therefore often necessary to deploy multiple samplers to assess the consistency of the data. This was performed at four sites, with results indicating that the samplers offer a useful, low-cost means of assessing spatial and temporal patterns of fine sediment transfer across catchments (Perks et al., 2014). To provide a hydrological context for the sediment fluxes presented, the total rainfall depth over each sampling period is provided. This is based on the aggregation of hourly rainfall data collected in the vicinity of Site 13 by the Met Office Integrated Data Archive System (MIDAS) monitoring network (Perks et al., 2016a).
3.2 Data Processing
7
Across much of Europe, suspended sediment sampling strategies are typically based upon infrequent, monthly (or coarser), sampling intervals in order to characterise the nature of particulate pollutants (Carere et al., 2012), with an implicit assumption that this sample is representative of the sampling interval (e.g. Facchi et al., 2007). Based on analysis of these samples, the most commonly adopted metric for description of the suspended sediment regime is the mean concentration. To assess the impact of sampling frequency on this metric, high frequency SSC data collected at Danby and Grosmont were used to construct a series of synthetic sampling records across a range of sampling frequencies typical of manual sampling schemes in UK river catchments. These were established using a Monte Carlo approach whereby the SSC record was sampled n times; where n is the a prioiri determined frequency of measurements over the entire monitoring period. For each measurement frequency the record was resampled 1000 times to produce an ensemble of measurements from which population statistics could be obtained (Skeffington et al., 2015). Following each sampling run, the number of samples was monotonically increased by one, with sample frequencies ranging from one sample per year, through to one every 15-min. The only constraint on the record was that samples must be selected between Mon-Fri, 09:00 – 17:00 to reflect typical manual sampling constraints. The deviation between the mean concentration derived from synthetic sampling programmes at various measurement frequencies and the reference data could then be assessed.
3.2.2 Time-integrated Sediment Sampling Metrics
Unlike SSC samples, which are usually discrete, the derivation of an equivalent mass concentration from a bulk mass of material collected by a time-integrated sediment sampler (𝑚), which is representative of the sampling interval, is more complex. In an optimal situation, in addition to a time-integrated sampler, each monitoring site would be equipped with a device to measure the samplers inlet flow rate (𝑟; m3 s-1) and the overall discharge of the river (𝑄; m3 s-1). Assuming a constant sampling efficiency this would enable scaling of the sampled mass of material to the overall fluvial suspended sediment load (𝐿):
𝐿 = 𝑚 (𝑄
𝑟) (1)
Following this, the derived load would be normalised by flow, to account for scale effects, resulting in a flow-weighted concentration 𝐶̂ - a metric that is conceptually similar to current Environmental Quality Standard approaches:
𝐶̂ = (𝑄𝐿) (2)
However, due to the costs associated with implementing this approach, and the focus on characterising the sediment regime rather than comparisons with compliance targets, a useful compromise is to characterise sediment transfer as a flux to inform catchment management
8
policies. This can be achieved following the application of some simple assumptions, namely: (i) the majority of suspended sediment during the sampling period is transported during peak flow; and (ii) the bankfull cross-section area (𝑎) approximates peak flow:
𝐿𝑒𝑠𝑡= 𝑚 (𝑎𝑖) (3)
Accepting these assumptions, the mass of material collected by a sampler with a known inlet cross-section area (𝑖) can be scaled by the bankfull area of flow to provide the estimated load (𝐿𝑒𝑠𝑡) over the collection interval. The validity of these assumptions have previously been tested in the Esk catchment through the use of in-stream monitoring stations to provide quasi-continuous measurements of sediment transfer (cf. Perks et al., 2014). This was achieved by deploying calibrated turbidity probes alongside continuous flow measurements. These data are defined as the reference loads, against which 𝐿𝑒𝑠𝑡 can be compared. The relationship between these data can be best described as a power-law, developed through linear least squares fitting on log-transformed data (R2 = 0.80; n = 109). The function is in the form:
𝑙𝑜𝑔10(𝐿) = 0.836 + 1.454 ∙ 𝑙𝑜𝑔10(𝐿𝑒𝑠𝑡) (4)
Which when back-transformed into linear space yields:
𝐿 = 28.44𝐿𝑒𝑠𝑡0.836 (5)
Where 𝐿 is the reference suspended sediment load (t), and 𝐿𝑒𝑠𝑡 is the suspended sediment load (t) following application of Eq. 3. Given the availability of this information in the Esk catchment, Eq. 5 was applied to the distributed sediment dataset.
3.3 Distributed Sediment Modelling
Accurately capturing the spatial distribution of fluvial fine sediment transfer is a fundamental pre-requisite for determining the spatial distribution of catchment sediment sources across a catchment. Although this can be achieved in isolation through the targeted deployment of monitoring networks, the proliferation of open access, spatially distributed modelling software offers an attractive alternative to catchment managers and competent authorities. Here we use one such model, SCIMAP (Reaney et al., 2011), to model fine sediment risk in the Esk catchment. This risk-based modelling approach uses land-use, and geomorphological controls (such as local slope) to predict areas within the catchment where fluvial suspended sediment transport is likely to be highest, and to identify potential source areas within sub-catchments. Anthropogenic modification of the landscape is assessed through the use of the CEH Land Cover Map (LCM) 2007 (Morton et al., 2011), which classifies land-use into 23 individual classes at 25 x 25 m resolution. Each land use class is assigned a risk weight (𝑅𝑤) (Table 2), which is used to describe the erodibility of the surface and the potential for mobilisation of the sediment, with the implicit assumptions that there is a correlation between soil type and land
9
cover (Reaney et al., 2011), and that any seasonal variability in erodibility values are implicitly accounted for in the weightings. The land cover based risk weights are combined with the upslope contributing area (𝐴), which is a proxy for the volume of potential surface flow, and the gradient (𝛽), which is a proxy for the flow speed. These factors combine to give the spatially distributed erosion potential (𝐸) across the catchment:
𝐸 = 𝑅𝑤∙ 𝐴 ∙ 𝑡𝑎𝑛𝛽 (6)
Having calculated spatially distributed estimates of erosion potential across the catchment (𝐸), the links between these potential sources and the watercourse is achieved through the calculation of the connectivity index (𝐶). This index considers the catchment wetness required for each point in the catchment to generate surface runoff and to connect to a watercourse. This index is based on analysis of a 5 m digital terrain model (DTM) using the Network Index algorithm (Lane et al., 2004). This is a time-integrated approach that implicitly contains a temporal component as locations in a catchment that are more difficult to connect in space are also connected for shorter durations (Lane et al., 2009). By taking into account the ease of connection of a hillslope cell to a waterbody, the predicted at-a-point fine sediment risk 𝐿𝑗 is calculated, with upslope contributing cells 𝑗 increasing monotonically with distance down through the drainage network:
𝐿𝑗 = ∑𝑗𝑖=1𝐸𝑖 ∙ 𝐶𝑖 (7)
Material is most likely to be exported where there is both a significant erodible source, overland flow to erode the sediment, and a connected pathway to the channel – the critical source areas (Heathwaite et al., 2000). These risks are then accumulated through the landscape into a river channel network where the risk level in the channel (𝐶𝑗) is a summation of the upstream
catchment area’s point scale values divided by the cell size (𝑎𝑖) and rainfall weighting factor 𝑟𝑖, i.e. through weighting upslope contributing areas by the amount of upstream contributed precipitation normalised across the catchment. Precipitation is based on the UK Met Office 5 km x 5 km rainfall grid, averaged over the period spanning 1961–90 (Perry and Hollis, 2005): 𝐶𝑗= ∑𝑗𝑖=1𝐸𝑖 ∙𝐶𝑖
∑𝑗𝑖=1𝑎𝑖 ∙𝑟𝑖
(8)
This risk based modelling approach operates with a similar underlying philosophy as the time-integrated sediment sampling framework presented in this paper, with both datasets reporting sediment pressures in units that are normalised by the unit area. Both tools seek to capture the broad spatial patterns of sediment transport, seeking to understand the relative contribution of sub-catchments to the wider catchment sediment dynamics. The model outputs highlight the spatial variability of fine sediment risk across the channel network, which can then be examined and compared with outputs from the direct monitoring network in further
10
detail to determine which areas of the catchment warrant additional attention either in terms of monitoring or direct intervention.
Land Cover Risk Weight Value (𝑅𝑤)
Woodland 0.05 Arable 1.00 Improved Grassland 0.30 Natural Grassland 0.15 Moorland 0.05 Water 0.00 Urban 0.01
Table 2. Land cover risk weights (𝑅𝑤) used to assess the spatial pattern of erodibility in the SCIMAP model of the River Esk catchment.
4 Results
4.1 Impact of Sampling Frequency on Apparent Fine Sediment Exposure
When a single sample per month is extracted randomly (during the working week) and compared with the mean concentration over the month, we find that central estimates consistently underestimate the reference at both the Danby and Grosmont monitoring stations, with the mean value exceeding the median of the sample (Figure 2). This underestimation falls outside of the ±20% bounds on 82% and 84% of occasions for each station respectively. The inter-quartile range of the estimates also exceeds the ±20% bounds on 59% and 79% of occasions. These findings place considerable doubt over the potential for an individual sample to be representative of the sampling period.
11
Figure 2. Percentage deviation between actual monthly mean SSCs and estimates based on one random sample per month collected Mon-Fri, 09:00 – 17:00 at (a) Danby and (b) Grosmont. Crosses represent the central estimate, the shaded area representing ±20% of the reference value, and error bars illustrating the interquartile range of estimates.
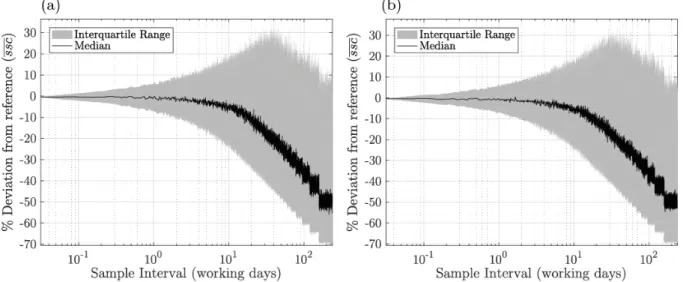
When these uncertainties are propagated through a series of alternative sampling scenarios, it is clear that varying the sampling frequency exerts a significant impact on the bias (defined as the deviation of the median simulation from the reference value), and precision (defined as the interquartile range of estimates), when simulating the suspended sediment regime (Figure 3). At the highest sampling frequency of 15-min, both the bias and precision are negligible (<1%). As sample frequency decreases, the sampling bias and precision respond non-linearly. Bias and precision at 1-hour sampling intervals are less than 0.5% and 5% respectively whilst at 3-hours these values increase to 0.6% and 8%. At the daily sampling frequency, mean estimates are generated that are still consistent with the reference value (<1% bias), with acceptable precision as indicated by an inter-quartile range of ±15%. As sample frequency approaches the twelve samples annually target for Environmental Quality Standard monitoring (Carere et al., 2012), and adopted by the UK (Bowes et al., 2009), the bias of the estimates is less than 13%. However, the precision of the estimates declines considerably reflected by an interquartile range of -35 to +20% of the actual reference value. These findings are consistent
across the Esk catchment, with comparable response at the Danby (92km2)and Grosmont
(286km2) monitoring stations (Figure 3). This demonstrates that recommended approaches for determining the occurrence and transfer of particulate materials in fluvial systems (e.g.
12
Environmental Quality Standard sampling protocols) may produce concentration estimates that are vastly different to the reference state (e.g. Grove et al., 2015; Johnes, 2007; Skeffington et al., 2015). This has implications not only for the characterisation of background levels of suspended sediment, but also particulate borne contaminants. Only by accurately accounting for temporal variability can suspended sediment and particulate matter be justifiably evaluated for its impact on the aquatic communities. In the absence of secondary variables (e.g. hydrology) to inform sampling (e.g. Horowitz et al., 2015; Lewis and Eads, 2008), or to compensate for sampling bias (Phillips et al., 1999), the long term condition of the system may only be adequately characterised through daily, or sub-daily sampling.
Figure 3. Percentage deviation between the long term reference SSC (calculated as the mean over the entire monitoring period), and estimates based on randomly sampling at varying time intervals targeted during the working week (Mon-Fri, 09:00 – 17:00) at (a) Danby and (b) Grosmont. The dataset was randomly sampled 1000 times for each sample interval with the median (black line) and interquartile range (grey fill) of estimates being displayed.
Our analysis adds support to claims that sampling regimes based on the typical requirements of Environmental Quality Standards, and often constrained by limited resources, are incapable of accurately characterising the suspended sediment regime in stormflow-dominated catchments (e.g. Horowitz et al., 2015; Johnes, 2007; Thompson et al., 2014). Alternative approaches for characterising the temporal and spatial variability of sediment fluxes are required (Littlewood and Marsh, 2005).
4.2 Time-integrated approaches
In contrast to significant bias and imprecision associated with infrequent Environmental Quality Standard style sampling for determining the magnitude of fine sediment and particulate-borne contaminant transfer, the deployment of time-integrating sediment samplers
13
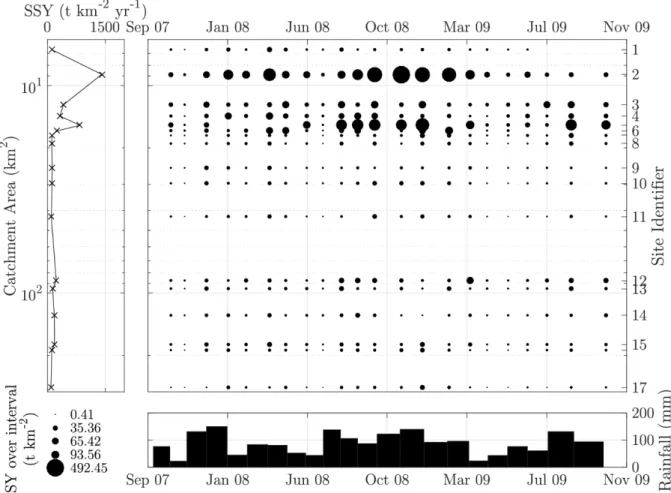
across the Esk catchment has been successful for characterising the spatial and temporal variability of fine sediment fluxes. Using these devices, the location of peak specific sediment yields (SSYs; t km-2 yr-1) in the Esk catchment is at catchment scales of 8.84 km2, along with relatively high SSYs across the 8.84 – 15.56 km2 range (Figure 4). This is consistent with previous research indicating that the peak in SSYs may typically occur within the 0.1 – 20 km2 catchment scale range (Osterkamp and Toy, 1997; Poesen et al., 1996). Following the peak in SSYs in the catchment headwaters, a significant reduction is often observed with increasing catchment area (de Vente and Poesen, 2005). This is typically reported to be a consequence of decreasing local slope and the development of floodplains which act as temporary sediment sinks (Syvitski et al., 2005; Walling, 1999). Following peak specific sediment yields in the small headwater tributaries of the Esk, the magnitude of fine sediment transfer per unit-area indeed does decrease significantly but is relatively stable between 17.34 and 286.57 km2 (Figure 4). This stability is likely a result of the incised river channels continuing to contribute significant volumes of fine material from riverbanks, and enhanced fine sediment inputs to the lower reaches of the Esk from tributaries of the central Esk valley (e.g. Perks and Warburton, 2016). The limited floodplain development of the Esk also provides few opportunities for temporary storage of fine grained material. The advantages of the time-integrated sampling approach are most noticeable when hydrologically active periods generate high magnitude sediment transport. For example, Butter Beck (Site 2), transferred 492 t km-2 of material in one month (34% of the average annual SSY), whilst 1211 t km-2 was transferred over a three month period (85% of the average annual SSY). Failure to adequately document the location and exposure of aquatic organisms to the quality and abundance of fine sediment during these active sediment transfer periods would underestimate the local pressures on the aquatic system, and significantly devalue the utility of a monitoring programme.
14
Figure 4. Temporal and spatial variability of specific sediment yields (SSYs) across the Esk catchment determined using a network of time-integrated suspended sediment samplers. The area of the filled circles is proportional to the SSY observed over the monitoring period. For hydrological context, the total rainfall for each sampling interval, based on hourly data collected in the vicinity of Site 13, is presented. Note: Site identifiers 1-17 correspond to the
station id’s provided in Figure 1. Butter Beck is Site 2 – see text.
4.3 Linkages with Distributed Sediment Modelling
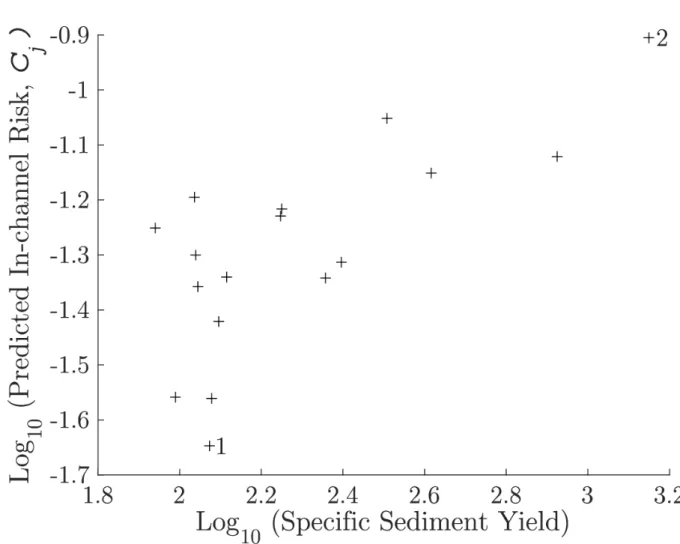
Upon application of SCIMAP we compare the predicted in-channel risk (𝐶𝑗) and the spatial variability in specific sediment yields (SSYs) provided by the direct sampling network. Given that 𝐶𝑗 represents the risk loading per unit area (Eq. 8), and the SSY is the total sediment load per unit area, a positive correlation would be expected providing that the distributed model is successfully accounting for sediment generation and delivery processes. This comparison shows that the results are broadly similar, with a highly significant Spearman Rank correlation between the observed SSYs and predicted risk (Figure 5; r = 0.58; p = 0.017).
15
Figure 5. Bivariate plot of log10 transformed predicted in-channel fine sediment risk (𝐶𝑗) and specific sediment yield (t km-2 yr-1) based on sediment collected using time-integrated suspended sediment samplers across the Esk catchment (n = 17; r = 0.58; p = 0.017). Tower Beck and Butter Beck are identified by 1 and 2 respectively.
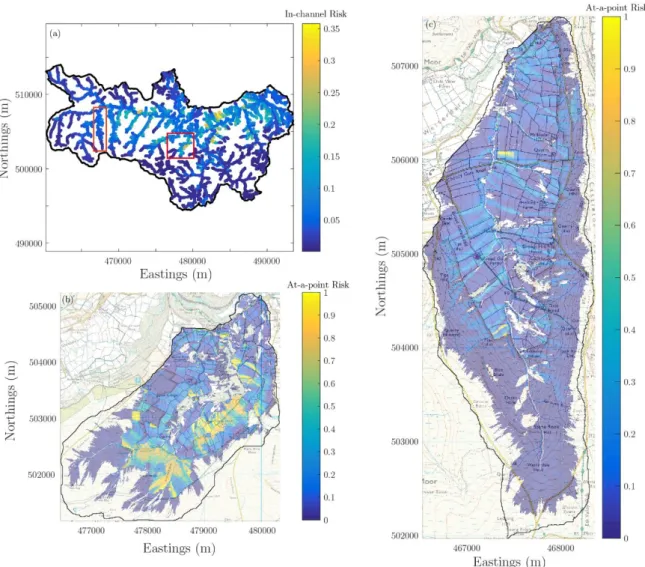
The examination of in-channel fine sediment risk (𝐶𝑗) for the sub-catchment of Butter Beck (ID = 2; Figures 5-6), in conjunction with analysis of SSYs (Figures 4-5) demonstrates the significance of Butter Beck as a key contributor of fine sediment to the River Esk (𝐶𝑗 = 0.12; SSY = 1411 t km-2 yr-1). 𝐶
𝑗 values are high across the sub-catchment as a result of the coupling between land-uses susceptible to enhanced fine sediment mobilisation, and connectivity to watercourses. Highest erosion risk (𝐿𝑗) is observed in the east and south-east of the catchment with values exceeding 0.5 for 10% of the sub-catchment by area (Figure 6b). In a contrasting example, Tower Beck (ID = 1), which drains the headwaters of the Esk, is not deemed to be a major contributor of fine sediment to the wider catchment. This is due to low 𝐶𝑗 of 0.05 and SSY of 109 t km-2 yr-1 (Figure 5). Only 0.2% of the sub-catchment is designated as having an erosion risk in excess of 0.5, 50 times less than that of Butter Beck (Figure 6c). These two independent, yet corroborating data sources provide land managers with important information as to the role of land-use on the delivery of fine sediment to the river.
16
The broad success of SCIMAP across the Esk is largely due to fine sediment problems in the catchment being diffuse and closely related to land management practices, processes that are well represented by the model. However, in sub-catchments where SSYs exceed the broad patterns of accumulated risk, it may direct authorities towards the assessment of pollution sources that are not explicitly represented in the SCIMAP framework e.g. in-stream sources, point discharges, or land-use conflicts. Conversely, in sub-catchments where accumulated risk is elevated relative to SSYs this may be an indication of the impact of land management operations (e.g. river restoration, contour ploughing, etc.) that are not directly represented within the model.
Figure 6. (a) Distributed in-channel fine sediment risk (𝐶𝑗) of major watercourses in the Esk catchment produced by SCIMAP modelling. Boxes indicate the location of Butter Beck and Tower Beck (right and left respectively), for which the at-a-point fine sediment risk (𝐿𝑗) is presented in (b) and (c). Map projection: OSGB 1936 British National Grid.
17
5 Discussion
Current infrequent sampling approaches are unable to establish particulate fluxes (discharges) with confidence and are unable to correctly characterise sediment regimes due to bias and imprecision generated by unsatisfactory sampling of periods of significant particulate transfer (e.g. Dickinson, 1981; Grove et al., 2015; Walling and Webb, 1985). This is a direct consequence of the prohibitive costs associated with frequent sampling, and a lack of quantitative criteria specifying suitable sampling designs (Greenwood et al., 2007; Madrid and Zayas, 2007). In order to robustly test the targets of the Water Framework Directive, including ensuring that concentrations of priority substances do not increase within sediments and biota, with negligible discharges by 2025 (Crane and Babut, 2007; Förstner, 2009), alternative monitoring approaches are required (Hering et al., 2010; Roig et al., 2007). Advances in low-cost devices and open-source sensors for hydrological monitoring offer significant potential for the accurate assessment of spatio-temporal dynamics and fluxes of contaminants, with passive sampling technology being used for the determination of time-weighted average concentrations of various analytes including metals and organic contaminants (Allan et al., 2006). Additionally, passive samplers are routinely used as the collection vessel for sediment finger-printing investigations (e.g. Lamba et al., 2015; Sherriff et al., 2015). However uptake for the explicit role of detecting temporal and spatial variation in exposure to particulate pollutants is not yet widespread, despite increasing popularity (Ankers et al., 2003; Pulley et al., 2016).
A step-change in the ways in which the transfer of fine particulates are monitored across fluvial environments may be expedited through demonstration of the limitations of traditional approaches and the presentation of alternatives. Reference sites such as those in the Esk catchment could be established across a wide range of fluvial environments to enable the simultaneous deployment of traditional techniques and high-resolution sampling, alongside emerging approaches, to further test their applicability and build confidence. Providing that uncertainty is accounted for, these additional datasets could be utilised to provide additional insights into catchment behaviour and so add to the weight of evidence for the allocation of resources (such as setting location-specific agri-enviromental scheme priorities) to ensure positive effects of pollution prevention and control measures (Jalón et al., 2015; Roig et al., 2007).
The application of a novel technique for suspended sediment sampling in the Esk catchment, alongside traditional and high-resolution sampling approaches has enabled the strengths and limitations of this developmental approach to be assessed. However, these approaches are
18
not without uncertainties that should be acknowledged when using these devices: (i) the mass of material recovered by an individual sampler is dependent on its location in the cross-section (McDonald et al., 2010; Perks et al., 2014). This is likely a consequence of bed-form heterogeneity, and variations in the source and type of sediment. Sampler location should therefore, wherever possible, be consistent between sites (Schindler Wildhaber et al., 2012). The impact of the sampler location does however appear to be less significant when determination of the physical properties of fine sediment is the purpose. For example, Perks et al. (2014) demonstrated that the organic content, carbonate content, and particle sizes recovered from multiple samplers in a cross-section showed no statistically significant differences, whilst Phillips et al. (2000) and Russell et al. (2000) found the sampler was able to collect sediment samples with chemical concentrations comparable to those collected manually; (ii) assuming complete sampling efficiency of the water column, it would be expected that sediment fluxes would be overestimated when using Eq. 3 and 4 due to the scaling by bankfull area. However, estimated loads using this method are significantly less than reference loads, with underestimation ranging from 66 – 99% (Perks et al., 2014). Despite this limitation, individual samplers operate consistently over prolonged periods, underestimating the sediment flux in a predictable manner, which enables the identification of tributaries with relatively elevated sediment transfer levels, and the development of robust empirical models relating the estimated load to the reference load (Eq. 4 and 5), which may be used to derive actual sediment fluxes across a catchment, when required. However, it is important to note that the form of the relationship is likely to vary based on catchment specific sediment transport characteristics, and sampler configuration.
Despite these limitations, this novel methodology provides a robust estimate of the spatial dynamics of suspended sediment transfer at the catchment scale. Determining the spatial nature of fine sediment fluxes is crucial to develop effective catchment management interventions. The nature of the data set produced has the potential to enable catchment managers to pin-point source areas and practices that mobilise fine sediment. The combined approach of deploying time-integrated samplers and using distributed modeling techniques such as SCIMAP further increase the rigour of the analysis, providing competent authorities and land managers with geomorphological predictions that are suited to assisting in targeted management such as farm visits, additional monitoring, the tailoring of agri-environmental payments or direct interventions. The results presented in this paper therefore showcase the potential of geo-spatial data and distributed modelling to be used in a hybrid approach to support decision making.
19
6 Conclusions
In this paper we critically assess the utility of low-cost, time-integrated sampling devices for assessing temporal and spatial variations in fine sediment transport at the landscape scale. We contend that this methodology provides evidence for the identification of catchment pressures and locations requiring further investigation or direct intervention. Following an analysis of the impacts of sampling frequency on sediment regime classification we concur with the findings of Johnes (2007) that continuing with the current monitoring programme in the UK cannot be recommended. Current Environmental Quality Standard based approaches adopted by many competent authorities for the assessment of exposure to fine sediment potentially misrepresent the state of the fluvial sediment regime. At a monthly sampling interval we observe bias in the region of 13% with an interquartile range of estimates spanning -35 to +25% relative to the reference value (e.g. Figure 3). We propose an alternative methodology involving the deployment of a spatially distributed time-integrated sampling network. This enables the consistent capture of spatial and temporal patterns of sediment flux across the Esk catchment, enabling key contributing sub-catchments to be identified. In this instance, sub-catchments located in the middle reaches of the Esk originating on the upland plateau were found to be key contributors (Figure 4). Through the integration of this distributed data with risk-based modelling we are able to better understand fine sediment risk through the identification of critical source areas (Figure 6). This unique dataset illustrates the utility of this sampling approach to inform catchment scale management. However, scientific benchmarks for fine sediment flux need to be developed to encourage integrated assessment of suspended sediment transfer. This will ensure that fine sediment is assessed alongside concomitant pollutants, and result in more efficient and scientifically robust monitoring practises at the national scale.
7 Data Availability
Datasets produced and/or utilized in the production of this research article are publicly available at https://doi.pangaea.de/10.1594/PANGAEA.867534 (Perks et al., 2016d). These datasets are freely available for use provided attribution of the source is provided. MATLAB scripts used to produce the Figures can be obtained at https://github.com/CatchmentSci/Esk-Management (Perks, 2016).
Acknowledgements
The authors gratefully acknowledge the co-operation of local landowners for access to the field site. Monitoring was undertaken as part of the first author’s PhD research project which was made possible following financial support from Durham University and the Environment Agency. We wish to thank two anonymous reviewers and the guest editors (Nicolas
20
Lamouroux and Hervé Piégay) whose detailed comments significantly improved this
manuscript. All views in the paper are those of the author’s and should not be interpreted as necessarily representing the opinions of other land management agencies.
21
References
Allan, I.J., Vrana, B., Greenwood, R., Mills, G.A., Knutsson, J., Holmberg, A., Guigues, N., Fouillac, A.-M., Laschi, S., 2006. Strategic monitoring for the European Water Framework Directive. TrAC, Trends Anal. Chem. 25, 704-715.
Ankers, C., Walling, D.E., Smith, R.P., 2003. The influence of catchment characteristics on suspended sediment properties. Hydrobiologia 494, 159-167.
Arnold-Forster, 2002. Benefits to environment and economy through EU structural funds, with special reference to the North York Moors National Park, in: Burt, T.P., Thompson, D.B.A., Warburton, J. (Eds.), The British Uplands: Dynamics of Change. JNCC, pp. 83-90.
Bilotta, G.S., Brazier, R.E., 2008. Understanding the influence of suspended solids on water quality and aquatic biota. Water Res. 42, 2849-2861.
Boon, D.P., Chambers, J.E., Hobbs, P.R.N., Kirkham, M., Merritt, A.J., Dashwood, C., Pennington, C., Wilby, P.R., 2015. A combined geomorphological and geophysical approach to characterising relict landslide hazard on the Jurassic Escarpments of Great Britain. Geomorphology 248, 296-310.
Bowes, M.J., Smith, J.T., Neal, C., 2009. The value of high-resolution nutrient monitoring: A case study of the River Frome, Dorset, UK. J. Hydrol. 378, 82-96.
Braskerud, B.C., 2001. The influence of vegetation on sedimentation and resuspension of soil particles in small constructed wetlands. J. Environ. Qual. 30, 1447-1457.
Brils, J., 2008. Sediment monitoring and the European Water Framework Directive. Ann. Ist. Super. Sanità 44, 218-223.
Carere, M., Dulio, V., Hanke, G., Polesello, S., 2012. Guidance for sediment and biota monitoring under the common implementation strategy for the water framework directive. TrAC, Trends Anal. Chem. 36, 15-24.
Collins, A.L., Anthony, S.G., 2008. Assessing the likelihood of catchments across England and Wales meeting 'good ecological status' due to sediment contributions from agricultural sources. Environ. Sci. Policy 11, 163-170.
Collins, A.L., McGonigle, D.F., 2008. Monitoring and modelling diffuse pollution from agriculture for policy support: UK and European experience. Environ. Sci. Policy 11, 97-101. Collins, A.L., Naden, P.S., Sear, D.A., Jones, J.I., Foster, I.D.L., Morrow, K., 2011. Sediment targets for informing river catchment management: international experience and prospects. Hydrol. Process. 25, 2112-2129.
Crane, M., 2003. Proposed development of Sediment Quality Guidelines under the European Water Framework Directive: a critique. Toxicol. Lett. 142, 195-206.
Crane, M., Babut, M., 2007. Environmental quality standards for water framework directive priority substances: Challenges and opportunities. Integr. Environ. Assess. Manage. 3, 290-296.
de Vente, J., Poesen, J., 2005. Predicting soil erosion and sediment yield at the basin scale: Scale issues and semi-quantitative models. Earth-Sci. Rev. 71, 95-125.
Dickinson, W.T., 1981. Accuracy and precision of suspended sediment loads, Erosion and Sediment Transport Measurement (Proceedings of the Florence Symposium, June 1981). IAHS Publications, pp. 195-202.
Emery, S.B., 2010. In Better Fettle: Improvement, Work and Rhetoric in the Transition to Environmental Farming in the North York Moors. Durham Univeristy; UK.
Emery, S.B., Perks, M.T., Bracken, L.J., 2013. Negotiating river restoration: The role of divergent reframing in environmental decision-making. Geoforum 47, 167-177.
Environment Agency, 2015. Update to the river basin management plans in England: National Evidence and Data Report, p. 20.
Eriksson, E., Baun, A., Scholes, L., Ledin, A., Ahlman, S., Revitt, M., Noutsopoulos, C., Mikkelsen, P.S., 2007. Selected stormwater priority pollutants — a European perspective. Sci. Total Environ. 383, 41-51.
Etchells, T., Tan, K.S., Fox, D., 2005. Quantifying the uncertainty of nutrient load estimates in the Shepparton irrigation region, Proceedings MODSIM05 International Congress on Modelling and Simulation, Advances and Applications for Management and Decision Making.
22
European Community, 2000. Directive 2000/60/EC of the European parliament and of the council of 23 October 2000 establishing a framework for community action in the field of water policy. Official Journal of the European Communities, L327, pp. 1-72.
European Union, 2006. Directive 2006/44/EC of the European Parliament and of the Council of 6 September 2006 on the quality of fresh waters needing protection or improvement in order to support fish life.
Evans, C.D., Chadwick, T., Norris, D., Rowe, E.C., Heaton, T.H.E., Brown, P., Battarbee, R.W., 2014. Persistent surface water acidification in an organic soil-dominated upland region subject to high atmospheric deposition: The North York Moors, UK. Ecol. Indicators 37, Part B, 304-316.
Facchi, A., Gandolfi, C., Whelan, M.J., 2007. A comparison of river water quality sampling methodologies under highly variable load conditions. Chemosphere 66, 746-756.
Förstner, U., 2009. Sediments and priority substances in river basins. J. Soils Sed. 9, 89-93. Fryirs, K., 2012. (Dis)connectivity in catchment sediment cascades: A fresh look at the sediment delivery problem. Earth Surf. Process. Landf. 38, 30-46.
Geist, J., 2005. Conservation genetics and ecology of European freshwater pearl mussels (Margaritifera margaritifera L.), Department für Ökosystem- und Landschaftsmanagement. Universität München, p. 132.
Gray, J.R., Glysson, G.D., Mueller, D.S., 2002. Comparability and accuracy of fluvial sediment data - a view from the U.S. Geological Survey, Speciality Conference, Hydraulic Measurements and Experimental Methods, Colorado, USA, p. 6.
Gray, J.S., 1999. Using science for better protection of the marine environment. Mar. Pollut. Bull. 39, 3-10.
Greenwood, R., Mills, G.A., Roig, B., 2007. Introduction to emerging tools and their use in water monitoring. TrAC, Trends Anal. Chem. 26, 263-267.
Grove, M.K., Bilotta, G.S., Woockman, R.R., Schwartz, J.S., 2015. Suspended sediment regimes in contrasting reference-condition freshwater ecosystems: Implications for water quality guidelines and management. Sci. Total Environ. 502, 481-492.
Heathwaite, L., Sharpley, A., Gburek, W., 2000. A conceptual approach for integrating phosphorus and nitrogen management at watershed scales. J. Environ. Qual. 29, 158-166. Hering, D., Borja, A., Carstensen, J., Carvalho, L., Elliott, M., Feld, C.K., Heiskanen, A.-S., Johnson, R.K., Moe, J., Pont, D., Solheim, A.L., de Bund, W.v., 2010. The European Water Framework Directive at the age of 10: A critical review of the achievements with recommendations for the future. Sci. Total Environ. 408, 4007-4019.
Horowitz, A.J., Clarke, R.T., Merten, G.H., 2015. The effects of sample scheduling and sample numbers on estimates of the annual fluxes of suspended sediment in fluvial systems. Hydrol. Process. 29, 531-543.
Horsburgh, J.S., Spackman Jones, A., Stevens, D.K., Tarboton, D.G., Mesner, N.O., 2010. A sensor network for high frequency estimation of water quality constituent fluxes using surrogates. Environ. Model. Software 25, 1031-1044.
Irvine, K., Boelens, R., Fitzsimmons, J., Kemp, A., Johnston, P., 2002. Review of monitoring and research to meet the needs of the EU Water Framework Directive (2000-DS-5-M1), Environmental RTDI Programme 2000–2006, p. 157.
Jalón, D.G.d., Bussettini, M., Rinaldi, M., Grant, G., Friberg, N., Vezza, P., Cowx, I.G., Màs, F.M., Buijse, T., 2015. D7.7 Policy discussion paper III - Linking e-Flows to sediment dynamics. REstoring rivers FOR effective catchment Management, p. 22.
Jansson, M.B., 1988. A global survey of sediment yield. Geografiska Annaler. Series A, Physical Geography 70, 81-98.
Johnes, P.J., 2007. Uncertainties in annual riverine phosphorus load estimation: Impact of load estimation methodology, sampling frequency, baseflow index and catchment population density. J. Hydrol. 332, 241-258.
Lamba, J., Karthikeyan, K.G., Thompson, A.M., 2015. Apportionment of suspended sediment sources in an agricultural watershed using sediment fingerprinting. Geoderma 239–240, 25-33.
23
Lane, S.N., Brookes, C.J., Kirkby, M.J., Holden, J., 2004. A network-index-based version of TOPMODEL for use with high-resolution digital topographic data. Hydrol. Process. 18, 191-201.
Lane, S.N., Reaney, S.M., Heathwaite, A.L., 2009. Representation of landscape hydrological connectivity using a topographically driven surface flow index. Water Resour. Res. 45, W08423.
Lewis, J., Eads, R., 2008. Implementation guide for turbidity threshold sampling: principles, procedures, and analysis. Department of Agriculture, Forest Service, Pacific Southwest Research Station, Arcata, CA: USA.
Littlewood, I.G., Marsh, T.J., 2005. Annual freshwater river mass loads from Great Britain, 1975-1994: estimation algorithm, database and monitoring network issues. J. Hydrol. 304, 221-237.
Madrid, Y., Zayas, Z.P., 2007. Water sampling: Traditional methods and new approaches in water sampling strategy. TrAC, Trends Anal. Chem. 26, 293-299.
McDonald, D.M., Lamoureux, S.F., Warburton, J., 2010. Assessment of a time-integrated fluvial suspended sediment sampler in a high arctic setting. Geografiska Annaler. Series A, Physical Geography 92, 225-235.
Mills, C.F., Bathurst, J.C., Quinn, P., 2008. A study of spatial scaling in suspended sediment yield along a rural river system – the River Eden, Cumbria, UK, Sediment Dynamics in Changing Environments (Proceedings of a symposium held in Christchurch, New Zealand, December 2008). IAHS Publication, pp. 217-224.
Morton, D., Rowland, C., Wood, C., Meek, L., Marston, C., Smith, G., Wadsworth, R., Simpson, I., 2011. Final Report for LCM2007-the new UK land cover map. Countryside Survey Technical Report No 11/07.
Moss, B., 2008. The Water Framework Directive: Total environment or political compromise? Sci. Total Environ. 400, 32-42.
Ockenden, M.C., Deasy, C.E., Benskin, C.M.H., Beven, K.J., Burke, S., Collins, A.L., Evans, R., Falloon, P.D., Forber, K.J., Hiscock, K.M., Hollaway, M.J., Kahana, R., Macleod, C.J.A., Reaney, S.M., Snell, M.A., Villamizar, M.L., Wearing, C., Withers, P.J.A., Zhou, J.G., Haygarth, P.M., 2016. Changing climate and nutrient transfers: Evidence from high temporal resolution concentration-flow dynamics in headwater catchments. Sci. Total Environ. 548–
549, 325-339.
Osterkamp, W.R., Toy, T.J., 1997. Geomorphic considerations for erosion prediction. Environ. Geol. 29, 152-157
Owen, G.J., Perks, M.T., Benskin, C.M.H., Wilkinson, M.E., Jonczyk, J., Quinn, P.F., 2012. Monitoring agricultural diffuse pollution through a dense monitoring network in the River Eden Demonstration Test Catchment, Cumbria, UK. Area 44, 443-453.
Owens, P.N., Collins, A.J., 2005. Soil erosion and sediment redistribution in river catchments: Sumary, outlook and future requirements, in: Owens, P.N., Collins, A.J. (Eds.), Soil erosion and sediment redistribution in river catchments. CAB International, Wallingford, UK.
Perks, M.T., 2016. Esk-Management, GitHub repository, available at:
https://github.com/CatchmentSci/Esk-Management.
Perks, M.T., Owen, G.J., Benskin, C.M.H., Jonczyk, J., Deasy, C., Burke, S., Reaney, S.M., Haygarth, P.M., 2015. Dominant mechanisms for the delivery of fine sediment and phosphorus to fluvial networks draining grassland dominated headwater catchments. Sci. Total Environ. 523, 178-190.
Perks, M.T., Warburton, J., 2016. Reduced fine sediment flux and channel change in response to the managed diversion of an upland river channel. Earth Surf. Dyn. 4, 705-719.
Perks, M.T., Warburton, J., Bracken, L., 2014. Critical assessment and validation of a time-integrating fluvial suspended sediment sampler. Hydrol. Process. 28, 4795-4807.
[dataset] Perks, M.T., Warburton, J., Bracken, L., Reaney, S.M., Emery, S.B., Hirst, S., 2016a. Daily rainfall data at Danby in the Esk catchment, UK (2007-10), In: Perks, MT; Warburton, J; Bracken, L; Reaney, SM; Emery, SB; Hirst, S (2016): River Esk distributed fine sediment fluxes. Dataset #867534. PANGAEA.
24
[dataset] Perks, M.T., Warburton, J., Bracken, L., Reaney, S.M., Emery, S.B., Hirst, S., 2016b. River discharge and suspended sediment concentrations measured at Danby on the River Esk, UK (2007-09), In: Perks, MT; Warburton, J; Bracken, L; Reaney, SM; Emery, SB; Hirst, S (2016): River Esk distributed fine sediment fluxes. Dataset #867534. PANGAEA.
[dataset] Perks, M.T., Warburton, J., Bracken, L., Reaney, S.M., Emery, S.B., Hirst, S., 2016c. River discharge and suspended sediment concentrations measured at Grosmont on the River Esk, UK (2007-09), In: Perks, MT; Warburton, J; Bracken, L; Reaney, SM; Emery, SB; Hirst, S (2016): River Esk distributed fine sediment fluxes. Dataset #867534. PANGAEA.
[dataset] Perks, M.T., Warburton, J., Bracken, L., Reaney, S.M., Emery, S.B., Hirst, S., 2016d. River Esk distributed fine sediment fluxes. PANGAEA.
[dataset] Perks, M.T., Warburton, J., Bracken, L., Reaney, S.M., Emery, S.B., Hirst, S., 2016e. Time integrated suspended sediment samples from the Esk catchment, UK (2007-09), In: [dataset] Perks, MT; Warburton, J; Bracken, L; Reaney, SM; Emery, SB; Hirst, S (2016): River Esk distributed fine sediment fluxes. Dataset #867534. PANGAEA.
Perry, M., Hollis, D., 2005. The generation of monthly gridded datasets for a range of climatic variables over the UK. Int. J. Climatol. 25, 1041-1054.
Phillips, J.M., Russell, M.A., Walling, D.E., 2000. Time-integrated sampling of fluvial suspended sediment: a simple methodology for small catchments. Hydrol. Process. 14, 2589-2602.
Phillips, J.M., Webb, B.W., Walling, D.E., Leeks, G.J.L., 1999. Estimating the suspended sediment loads of rivers in the LOIS study area using infrequent samples. Hydrol. Process. 13, 1065-1050.
Poesen, J., Vandaele, K., van Wesemael, B., 1996. Contribution of gully erosion to sediment production on cultivated lands and rangelands., in: Walling, D.E., Webb, B.W. (Eds.), Erosion and Sediment Yield: Global and Regional Perspectives. IAHS Symposium, pp. 251-266. Pulley, S., Foster, I., Antunes, P., 2016. The dynamics of sediment-associated contaminants over a transition from drought to multiple flood events in a lowland UK catchment. Hydrol. Process. 30, 704-719.
Reaney, S.M., Lane, S.N., Heathwaite, A.L., Dugdale, L.J., 2011. Risk-based modelling of diffuse land use impacts from rural landscapes upon salmonid fry abundance. Ecol. Model. 222, 1016-1029.
Roig, B., Valat, C., Allan, I.J., Greenwood, R., Berho, C., Guigues, N., Mills, G.A., Ulitzur, N., 2007. The use of field studies to establish the performance of a range of tools for monitoring water quality. TrAC, Trends Anal. Chem. 26, 274-282.
Russell, M.A., Walling, D.E., Hodgkinson, R.A., 2000. Appraisal of a simple sampling device for collecting time-integrated fluvial suspended sediment samples. International Association of Hydrological Sciences, Wallingford.
Schindler Wildhaber, Y., Michel, C., Burkhardt-Holm, P., Bänninger, D., Alewell, C., 2012. Measurement of spatial and temporal fine sediment dynamics in a small river. Hydrol. Earth Syst. Sci. 16, 1501-1515.
Schubert, B., Heininger, P., Keller, M., Claus, E., Ricking, M., 2012. Monitoring of contaminants in suspended particulate matter as an alternative to sediments. TrAC, Trends Anal. Chem. 36, 58-70.
Sherriff, S.C., Franks, S.W., Rowan, J.S., Fenton, O., Ó’hUallacháin, D., 2015. Uncertain ty-based assessment of tracer selection, tracer non-conservativeness and multiple solutions in sediment fingerprinting using synthetic and field data. J. Soils Sed.15, 2101-2116.
Skarbøvik, E., Stålnacke, P., Bogen, J., Bønsnes, T.E., 2012. Impact of sampling frequency on mean concentrations and estimated loads of suspended sediment in a Norwegian river: Implications for water management. Sci. Total Environ. 433, 462-471.
Skeffington, R.A., Halliday, S.J., Wade, A.J., Bowes, M.J., Loewenthal, M., 2015. Using high-frequency water quality data to assess sampling strategies for the EU Water Framework Directive. Hydrol. Earth Syst. Sci. 19, 2491-2504.
Syvitski, J.P.M., Vorosmarty, C.J., Kettner, A.J., Green, P., 2005. Impact of humans on the flux of terrestrial sediment to the global coastal ocean. Science 308, 376-380.
25
Thomas, R.B., Lewis, J., 1995. An evaluation of flow-stratified sampling for estimating suspended sediment loads. J. Hydrol. 170, 27-45.
Thompson, J., Cassidy, R., Doody, D.G., Flynn, R., 2014. Assessing suspended sediment dynamics in relation to ecological thresholds and sampling strategies in two Irish headwater catchments. Sci. Total Environ.468–469, 345-357.
Wainwright, J., Turnbull, L., Ibrahim, T.G., Lexartza-Artza, I., Thornton, S.F., Brazier, R.E., 2011. Linking environmental régimes, space and time: Interpretations of structural and functional connectivity. Geomorphology 126, 387-404.
Walling, D.E., 1999. Linking land use, erosion and sediment yields in river basins. Hydrobiologia 410, 223-240.
Walling, D.E., Collins, A.J., McMellin, G., 2001. Provenance of insterstitial sediment retrieved from salmonid spawning gravels in England and Wales, Bristol, p. 43.
Walling, D.E., Webb, B.W., 1985. Estimating the discharge of contaminants to coastal waters by rivers: Some cautionary comments. Mar. Pollut. Bull. 16, 488-492.
View publication stats View publication stats