ModFOLD6: an accurate web server for
the global and local quality estimation of
3D protein models
Article
Published Version
Creative Commons: Attribution 4.0 (CCBY)
Open Access
Maghrabi, A. H. A. and McGuffin, L. J. (2017) ModFOLD6: an
accurate web server for the global and local quality estimation
of 3D protein models. Nucleic Acids Research, 45 (W1). W416
W421. ISSN 03051048 doi: https://doi.org/10.1093/nar/gkx332
Available at http://centaur.reading.ac.uk/70267/
It is advisable to refer to the publisher’s version if you intend to cite from the
work.
To link to this article DOI: http://dx.doi.org/10.1093/nar/gkx332
Publisher: Oxford University Press
All outputs in CentAUR are protected by Intellectual Property Rights law,
including copyright law. Copyright and IPR is retained by the creators or other
copyright holders. Terms and conditions for use of this material are defined in
the
End User Agreement
.
www.reading.ac.uk/centaur
CentAUR
Central Archive at the University of Reading
Nucleic Acids Research, 2017 1
doi: 10.1093/nar/gkx332
ModFOLD6: an accurate web server for the global and
local quality estimation of 3D protein models
Ali H. A. Maghrabi
†and Liam J. McGuffin
*,†School of Biological Sciences, University of Reading, Whiteknights, Reading RG6 6AS, UK
Received January 30, 2017; Revised April 05, 2017; Editorial Decision April 14, 2017; Accepted April 21, 2017
ABSTRACT
Methods that reliably estimate the likely similarity be-tween the predicted and native structures of proteins have become essential for driving the acceptance and adoption of three-dimensional protein models by life scientists. ModFOLD6 is the latest version of our leading resource for Estimates of Model Accu-racy (EMA), which uses a pioneering hybrid quasi-single model approach. The ModFOLD6 server inte-grates scores from three pure-single model methods and three quasi-single model methods using a neu-ral network to estimate local quality scores. Addi-tionally, the server provides three options for pro-ducing global score estimates, depending on the re-quirements of the user: (i) ModFOLD6 rank, which is optimized for ranking/selection, (ii) ModFOLD6 cor, which is optimized for correlations of predicted and observed scores and (iii) ModFOLD6 global for bal-anced performance. The ModFOLD6 methods rank among the top few for EMA, according to indepen-dent blind testing by the CASP12 assessors. The ModFOLD6 server is also continuously automatically evaluated as part of the CAMEO project, where sig-nificant performance gains have been observed com-pared to our previous server and other publicly able servers. The ModFOLD6 server is freely avail-able at:http://www.reading.ac.uk/bioinf/ModFOLD/. INTRODUCTION
Predicted three-dimensional (3D) models of proteins are now routinely relied upon to drive research across the life sciences, mainly due to the expense and time limitations of determining structures experimentally. 3D models are comparatively quick to produce and can often be of suf-ficiently high quality. However, with all predictions there is some level of uncertainty, and therefore accurate meth-ods for model quality assessment have become necessary for driving the acceptance of structure prediction methods. Es-sentially, relying on a 3D model of a protein without an
esti-mate of its accuracy is tantamount to relying on a sequence alignment without an E-value. Thus, the development of 3D model Quality Assessment (QA) tools has become an im-portant area of research in itself. Numerous methods have been developed over the years in an attempt to provide users with scores that will give them confidence in their 3D mod-els and allow them identify any potentially suspect regions. The model quality assessment field has its roots in early structure validation tools (1–3). Such tools can be used to perform basic stereochemical checks, and they are very use-ful in identifying unusual geometric features in a model. However, such methods are not able to produce a single global score that can be used for ranking alternative models or discriminating good models from bad (often bad models will still have good stereochemistry). Modern methods for QA can be classified into three broad categories: pure-single model methods, which consider only information within an individual model (4–11), clustering/consensus approaches (12–16), which can only be used if you have multiple alter-native models built for the same protein target, and quasi-single model methods (17,18), which can score an individual model against a pool of alternative models generated from the target sequence. Each approach has its advantages and disadvantages. Clustering methods have been far more ac-curate than pure single-model methods, but are more com-putationally intensive and do not work when very few sim-ilar models are available, which is often the case in real life research scenarios. Pure-single model methods are less ac-curate overall, but they are more rapid, they produce con-sistent scores for single or few models at a time and they often perform better at model ranking and selection.
Quasi-single model methods attempt to provide com-parable accuracy to clustering methods, while addressing real-life needs of researchers with few/single models. We initially implemented a quasi-single model approach with our ModFOLD3 method (18), which generated reference sets of models from the target sequence, using IntFOLD-TS (19), for comparison with the submitted model using ModFOLDclust2 (16). The method has since undergone a number of updates: ModFOLD4 (17), which makes use of IntFOLD2-TS (20) models, and ModFOLD5, which makes use of IntFOLD3-TS (21) models. Each of these
quasi-*To whom correspondence should be addressed. Tel: +44 118 378 6332; Fax: +44 118 378 8106; Email: [email protected]
†These authors contributed equally to the paper as first authors.
C
The Author(s) 2017. Published by Oxford University Press on behalf of Nucleic Acids Research.
This is an Open Access article distributed under the terms of the Creative Commons Attribution License (http://creativecommons.org/licenses/by/4.0/), which permits unrestricted reuse, distribution, and reproduction in any medium, provided the original work is properly cited.
2 Nucleic Acids Research, 2017
single model versions of ModFOLD have been ranked among the top performing methods in the quality assess-ment categories of the recent CASP experiassess-ments (22,23) and have undergone incremental improvements in accuracy. By some measures, the quasi-single model methods have been competitive with the predictive power offered by clustering-based methods, as well as being capable of making predic-tions for a single model at a time. While the ModFOLD server has been a pioneer of the quasi-single model ap-proach and a leader in terms of prediction performance, it has fallen short in some aspects, such as model selection. Furthermore, there is still significant room for improvement in many aspects of quality assessment.
Here we describe significant major updates to the Mod-FOLD server. The server has been popular with modellers around the world, having completed ∼200 000 quality as-sessment jobs for ∼9000 unique users. The latest version, ModFOLD6, operates solely in single model mode, deploy-ing a novel hybrid pure/quasi-single model QA algorithm. In addition to interface updates, in this paper we will also briefly describe the major modifications to the prediction algorithm, which have led to significant performance gains in both local and global model quality predictions, allowing us to maintain our position as a leading prediction group. The main changes under the hood have been the addition of several new local scoring inputs, a new neural network (NN) architecture and alternative optimized global scores for different use cases. On the front end submission page, users are now given three alternative choices for optimized global model quality scoring, depending on whether their preference is for optimal model selection (the best models are ranked at the very top), predicting absolute values (the predicted scores closely reflect the observed scores) or more balanced performance for the two use cases. We also report on the independent benchmarking of the server for the re-cent CASP12 experiment and ongoing CAMEO project.
MATERIALS AND METHODS
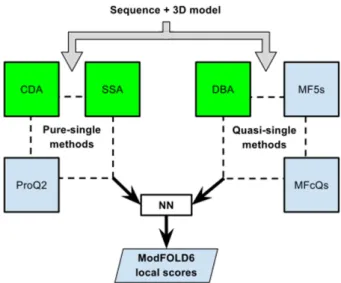
The ModFOLD6 server combines a pure-single and quasi-single model strategy for improved accuracy, which was originally developed for the CASP12 experiment. For Mod-FOLD version 6, our initial emphasis was on increasing the accuracy of per-residue assessments for single mod-els. Each model was considered individually using three pure-single model methods, ProQ2 (8) and two newly de-veloped methods: the Contact Distance Agreement (CDA) score and the Secondary Structure Agreement (SSA) score. Additionally, a set of 130 reference 3D models (generated using the latest version of IntFOLD (19–21)) was used to score models using three alternative quasi-single model methods: the Disorder B-factor Agreement (DBA) score, the ModFOLD5 single residue score and the ModFOLD-clustQ single residue score (Figure 1). An NN was then used to combine the component per-residue quality scores from each of the six alternative scoring methods, resulting in a final consensus of per-residue quality scores for each model.
Component per-residue/local quality scoring methods: (i) CDA is new pusingle model local QA method that re-lates to the agreement between the predicted residue
con-Figure 1. Flow of data for local quality assessment scoring in
Mod-FOLD6. The target sequence and 3D model were evaluated with three pure-single model scoring methods (Secondary Structure Agreement (SSA), Contact Distance Agreement (CDA) and ProQ2) and three quasi-single model methods (Disorder B-factor Agreement (DBA), Mod-FOLD5 single (MF5s) and ModFOLDclustQ single (MFcQs)). The new methods developed for ModFOLD6 are highlighted in green. The per-residue scores from all six methods were combined into a single per-residue score using an artificial neural network (see Supplementary Figure S1).
tacts according to MetaPSICOV (24) and the model con-tacts, which are measured by the Euclidean distance (in ˚A) between residues in the 3D model. All pairs of residues in a model that were measured to be 8 ˚A apart or less were con-sidered to be in contact and the CDA score for each residue was calculated by the mean MetaPSICOV score for those model contacts. In other words, if residueiwas measured to be in contact with both residuejand residuekin the model, and MetaPSICOV scores also existed forijandik, then the CDA score for residueiwas taken as the mean MetaPSI-COV score forijandik. Thus,CDA=(p)/c, wherepis the MetaPSICOV score andcis simply the number of con-tacts for the residue in the model where a value forpalso exists. (ii) SSA is a simple new pure-single model local QA method that relates to the agreement between the predicted secondary structure of each residue according to PSIPRED (25) and the secondary structure state of the residue in the model according to Dictionary of Secondary Structures of Proteins (DSSP) (26). Thus, SSA=pCHE, where, pCHE is
simply the p-value from PSIPRED for the secondary struc-ture state––coil (C), helix (H) or strand (E)––of the residue in the model according to DSSP. The eight DSSP states (H, I, G, E, B, S, T, -) were reduced to three states such that E (strand) and H (helix) were preserved and all other states were treated as C (coil). (iii) The local scores were also taken from the ProQ2 (8) method. (iv) The ModFOLD5 single local QA scores were calculated from the comparison of each model with the reference set of 130 models built by IntFOLD version 4, in a similar way to the ModFOLD4 (17) method acting in quasi-single model mode, with the predicted distancesdconverted back into residue similar-ities Sr, thus: Sr =1/(1+(d/3.9)2). (v) The
ModFOLD-Nucleic Acids Research, 2017 3
clustQ single local QA scores were calculated in a similar way to ModFOLD5 single, however, in this case individ-ual models were compared against the reference IntFOLD4 set using the local Q-score approach (16,27). (vi) DBA is a new quasi-single model QA method that relates to the agreement between the predicted disordered residues in the sequence according to DISOPRED3 (28) and the Mod-FOLD5 single predicted per-residue error. Thus,DBA=
1-|Sr-(1-Pd)|, where,Sris the ModFOLD5 single accuracy of
the predicted residue for the model andPdis the probability
of disorder according to DISOPRED3.
The final ModFOLD6 per-residue similarity scores were calculated using a simple multilayer NN (Supplementary Figure S1), which takes as its input a sliding window (size
=5) of per-residue scores from each of the 6 methods de-scribed above and outputs a single quality score for each residue in the model (30 inputs, 15 hidden, 1 output). The RSNNS package for R was used to construct the NN, which was trained using data derived from the evaluation of CASP11 server models. Similarity scores were converted back to distances in ˚Angstr ¨oms,d, by rearranging the equa-tion for Srabove (Supplementary Figure S1).
Global scores were calculated by taking the mean per-residue scores (the sum of the per-per-residue similarity scores divided by the target sequence lengths) for each of the six individual component methods, described above and the NN consensus output (ModFOLD6). Furthermore, three additional quasi-single global model quality scores were generated for each model based on the original ModFOLDclust, ModFOLDclustQ and ModFOLDclust2 global scoring methods (16) (in a similar vein to the Mod-FOLD4 single and ModFOLD5 singleglobalscores, tested in CASP10 (22) and CASP11 (23) respectively). Thus, we ended up with 10 alternative global QA scores, which could be combined in various ways in order to optimize for the different aspects of quality estimation (QE) (Supple-mentary Figure S2). The ModFOLD6 global score (the mean per-residue NN output score) considered alone was found to have a good balance of performance based on correlations of predicted and observed scores and rank-ings of the top models. The ModFOLD6 cor global score variant (calculated as: (ModFOLDclustQ single global + DBA global + ModFOLD6 global)/3) was found to be an optimal combination for producing good correlations with the observed scores, i.e. the predicted global quality scores produced should produce closer to linear correla-tions with the observed global quality scores. The FOLD6 rank global score variant (calculated as: Mod-FOLDclustQ single global + ProQ2 global + CDA global + DBA global + SSA global + ModFOLD6 global)/6) was found to be an optimal combination for ranking, i.e. the top ranked models (top 1) should be closer to the high-est accuracy, but the relationship between predicted and ob-served scores may not be linear (Supplementary Figure S2).
RESULTS AND DISCUSSION
Server inputs and outputs
The only required inputs to the ModFOLD6 server are the amino acid sequence for the target protein and a single 3D model (in PDB format) for evaluation. However, users may
optionally upload multiple alternative models (as a com-pressed archive of PDB files), a name for their protein se-quence and their email address. The server provides a clean and simple interface so that results can be easily interpreted by non-experts at a glance. The results page consists of a single table summarizing the quality assessment scores for each submitted model (Figure2A). The prediction data in the table are represented graphically, with thumbnail images of the local error plots and annotated 3D models. Users can click through the images in the table in order to drill down into individual results and visualize annotated 3D models interactively in using the JSmol/HTML5 framework (Fig-ure2B and C). No plugins are required and, conveniently, interactive results may also be viewed on mobile devices.
Each row in the results table includes: a global score for the model, aP-value indicating the likelihood that the ob-served similarity between the model and native structure is random (TM-score < 0.2) and a plot of the local er-rors in the model (the predicted distance in ˚Angstr ¨oms of each residue from the native structure) (Figure2A). Con-veniently, the server also inserts the predicted local qual-ity scores into the B-factor column of the ATOM records for each submitted model and makes them available to download, either individually or as a compressed archive. The results table also includes a graphical view of each model coloured by predicted B-factors using the tempera-ture scheme (Figure2A and B). The raw machine readable data files for each set of predictions are also provided for developers, which comply with the CASP data standards.
Independent benchmarking and cross validation
The ModFOLD6 server is continuously independently benchmarked for local QE performance using the CAMEO resource (29). At the time of writing, the CAMEO pub-lic QE data (http://www.cameo3d.org/) shows that Mod-FOLD6, and another unpublished method (QMEAN-DisCo), are currently the leading public QA methods for producing local (per-residue) quality scores, according to the lDDT measure over 6 months. Our common subset analysis using 6 months of CAMEO data prior to CASP12, verifies that the ModFOLD6 server is a significant improve-ment on our previous leading public ModFOLD4 method (17). Furthermore, results show that ModFOLD6 also out-performs the top publicly available published methods in terms of local quality (Table1, Supplementary Figure S3 and Table S1).
The ModFOLD6 server was also subjected to indepen-dent blind testing during the CASP12 experiment in 2016. We were invited to speak at the CASP12 meeting in Gaeta as one of the leading groups in the Estimation of Model Accuracy category. The ModFOLD6 server performed par-ticularly well in terms of differentiating between good and bad models (Table2), local scoring (Supplementary Tables S2–5) and assigning absolute global accuracy values (Sup-plementary Tables S6–9). The CASP12 data indicates that: ModFOLD6 ranks in top 10 in every benchmark of local score performance, it is the overall leading single model ap-proach, it is competitive with the consensus/clustering ap-proaches and it outperforms all pure-single model meth-ods (Supplementary Tables S2–5). In terms of global scores,
4 Nucleic Acids Research, 2017
Figure 2. ModFOLD6 server results for models submitted to CASP12 generated for target T0859 (PDB ID: 5jzr). (A) An example of the graphical output
from the server showing the main results page with a summary of the results from each method (truncated here to fit page). Clicking on the thumbnail images in the main table allows results to be visualized in more detail. (B) A histogram of the local or per-residue errors for the top ranked model, with the residue number on the x-axis and the predicted residue error (distance of the C␣atom from the native structure in ˚A) on the y-axis, which may be downloaded. (C) Interactive views of models, which can be manipulated in 3D using the JSmol/HTML5 framework and/or downloaded for local viewing.
Table 1. Independent benchmarking of local scoring with CAMEO using 6 months of common data comparing five publicly available published methods
(177 025 common residues, 725 common models, 113 650 high quality residues, 63 375 low quality residues)
Method AUC StdErr AUC 0–0.1 AUC 0–0.1 rescaled ModFOLD6 (server18) 0.8748 0.00096 0.0508 0.5081
ModFOLD4 (server7) 0.8638 0.00099 0.0467 0.4669 ProQ2 (server 8) 0.8374 0.00107 0.0428 0.4283 Verify3d (server0) 0.7020 0.00134 0.0208 0.2081 Dfire v1.1 (server1) 0.6606 0.00138 0.0168 0.1675
Twenty-six weeks of data between 29 April 2016 and 21 October 2016 downloaded fromhttp://www.cameo3d.org/. AUC=Area Under the ROC Curve. StdErr=Standard Error in AUC score. AUC 0-0.1=Area Under the ROC curve with False Positive Rate≤0.1. The table is sorted by the AUC score. See also Supplementary Tables S1–5 for independent local score benchmarks.
the ModFOLD6 variants were ranked within the top three for nearly every global benchmark using LDDT and CAD scores, as well as ranking within the top 10 according to other scores. (Table 2 and Supplementary Tables S6–10). The server was also a key factor contributing to our suc-cess in the Template Based Modelling category, where our group ranked in second position according to the assessors’ formula (http://www.predictioncenter.org/casp12/).
Prior to CASP12, the ModFOLD6 methods were also cross-validated using the CASP11 data to gauge perfor-mance versus the component methods, in terms of local
(Supplementary Tables S11–13) and global scores (Supple-mentary Tables S14 and 15). In all target categories, the ModFOLD6 local scores significantly outperform the com-ponent methods. Similarly, significant performance gains can be made from combining component global scores, both in terms of cumulative GDT-TS of the top ranked models (with ModFOLD rank) and in terms of assigning absolute accuracy values (with ModFOLD6 cor) (Supple-mentary Figure S2).
Nucleic Acids Research, 2017 5
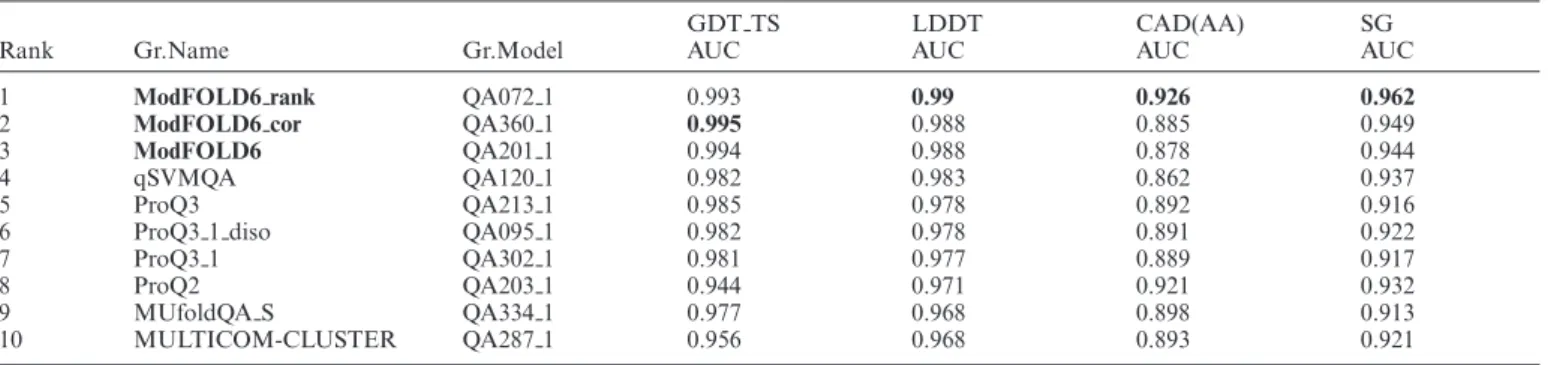
Table 2. Independent benchmarking of global scoring with official CASP12 data
GDT TS LDDT CAD(AA) SG Rank Gr.Name Gr.Model AUC AUC AUC AUC
1 ModFOLD6 rank QA072 1 0.993 0.99 0.926 0.962
2 ModFOLD6 cor QA360 1 0.995 0.988 0.885 0.949
3 ModFOLD6 QA201 1 0.994 0.988 0.878 0.944
4 qSVMQA QA120 1 0.982 0.983 0.862 0.937 5 ProQ3 QA213 1 0.985 0.978 0.892 0.916 6 ProQ3 1 diso QA095 1 0.982 0.978 0.891 0.922 7 ProQ3 1 QA302 1 0.981 0.977 0.889 0.917 8 ProQ2 QA203 1 0.944 0.971 0.921 0.932 9 MUfoldQA S QA334 1 0.977 0.968 0.898 0.913 10 MULTICOM-CLUSTER QA287 1 0.956 0.968 0.893 0.921
The ability of methods to separate good models (accuracy score≥50) from bad (<50) according to GDT TS, LDDT, CAD and SG scores is evaluated using the Areas Under the Curve (AUC) (seehttp://predictioncenter.org/casp12/doc/presentations/CASP12 QA AK.pdf). Only the top 10 methods are shown and the table is sorted using LDDT scores. The scores are calculated over all models for all targets (QA stage 1–select 20). The table is sorted by the LDDT AUC score. Data are fromhttp://predictioncenter.org/casp12/qa aucmcc.cgi. See also Supplementary Tables S5–10.
CONCLUSION
The ModFOLD6 server provides users with intuitively pre-sented, high accuracy estimates of local and global quality of 3D protein models. The ModFOLD6 server has been in-dependently verified, via the CAMEO project, showing a significant improvement on our previous published server as well as taking the lead over other public published meth-ods, in terms of local accuracy estimates. Furthermore, ac-cording to the recent CASP12 evaluation, the global scores produced by the ModFOLD6 sever methods rank among the best, outperforming other methods in terms of assign-ing absolute accuracy values to models and differentiatassign-ing between good and bad models.
SUPPLEMENTARY DATA
Supplementary Data are available at NAR Online.
FUNDING
Saudi Arabian Government Studentship (to A.H.A.M). Funding for open access charge: University of Reading.
Conflict of interest statement.None declared.
REFERENCES
1. Laskowski,R.A., Rullmannn,J.A., MacArthur,M.W., Kaptein,R. and Thornton,J.M. (1996) AQUA and PROCHECK-NMR: programs for checking the quality of protein structures solved by NMR.J. Biomol. NMR,8, 477–486.
2. Hooft,R.W., Vriend,G., Sander,C. and Abola,E.E. (1996) Errors in protein structures.Nature,381, 272.
3. Lovell,S.C., Davis,I.W., Arendall,W.B. 3rd, de Bakker,P.I., Word,J.M., Prisant,M.G., Richardson,J.S. and Richardson,D.C. (2003) Structure validation by Calpha geometry: phi,psi and Cbeta deviation.Proteins,50, 437–450.
4. Eisenberg,D., Luthy,R. and Bowie,J.U. (1997) VERIFY3D: assessment of protein models with three-dimensional profiles.
Methods Enzymol.,277, 396–404.
5. Wiederstein,M. and Sippl,M.J. (2007) ProSA-web: interactive web service for the recognition of errors in three-dimensional structures of proteins.Nucleic Acids Res.,35, W407–W410.
6. Zhou,H. and Zhou,Y. (2002) Distance-scaled, finite ideal-gas reference state improves structure-derived potentials of mean force for structure selection and stability prediction.Protein Sci.,11, 2714–2726.
7. McGuffin,L.J. (2007) Benchmarking consensus model quality assessment for protein fold recognition.BMC Bioinformatics,8, 345. 8. Uziela,K. and Wallner,B. (2016) ProQ2: estimation of model
accuracy implemented in Rosetta.Bioinformatics,32, 1411–1413. 9. Uziela,K., Menendez Hurtado,D., Shu,N., Wallner,B. and
Elofsson,A. (2017) ProQ3D: Improved model quality assessments using Deep Learning.Bioinformatics,
doi:10.1093/bioinformatics/btw819.
10. Benkert,P., Tosatto,S.C. and Schomburg,D. (2008) QMEAN: A comprehensive scoring function for model quality assessment.
Proteins,71, 261–277.
11. McGuffin,L.J. (2008) The ModFOLD server for the quality assessment of protein structural models.Bioinformatics (Oxford, England),24, 586–587.
12. McGuffin,L.J. (2009) Prediction of global and local model quality in CASP8 using the ModFOLD server.Proteins,77, 185–190. 13. Larsson,P., Skwark,M.J., Wallner,B. and Elofsson,A. (2009)
Assessment of global and local model quality in CASP8 using Pcons and ProQ.Proteins,77, 167–172.
14. Benkert,P., Tosatto,S.C. and Schwede,T. (2009) Global and local model quality estimation at CASP8 using the scoring functions QMEAN and QMEANclust.Proteins,77, 173–180.
15. Cheng,J., Wang,Z., Tegge,A.N. and Eickholt,J. (2009) Prediction of global and local quality of CASP8 models by MULTICOM series.
Proteins,77, 181–184.
16. McGuffin,L.J. and Roche,D.B. (2010) Rapid model quality assessment for protein structure predictions using the comparison of multiple models without structural alignments.Bioinformatics,26, 182–188.
17. McGuffin,L.J., Buenavista,M.T. and Roche,D.B. (2013) The ModFOLD4 server for the quality assessment of 3D protein models.
Nucleic Acids Res.,41, W368–W372.
18. Roche,D.B., Buenavista,M.T. and McGuffin,L.J. (2014) Assessing the quality of modelled 3D protein structures using the ModFOLD server.Methods Mol. Biol.,1137, 83–103.
19. McGuffin,L.J. and Roche,D.B. (2011) Automated tertiary structure prediction with accurate local model quality assessment using the IntFOLD-TS method.Proteins,79, 137–146.
20. Buenavista,M.T., Roche,D.B. and McGuffin,L.J. (2012) Improvement of 3D protein models using multiple templates guided by
single-template model quality assessment.Bioinformatics (Oxford, England),28, 1851–1857.
21. McGuffin,L.J., Atkins,J.D., Salehe,B.R., Shuid,A.N. and Roche,D.B. (2015) IntFOLD: an integrated server for modelling protein structures and functions from amino acid sequences.Nucleic Acids Res.,43, W169–W173.
22. Kryshtafovych,A., Barbato,A., Fidelis,K., Monastyrskyy,B., Schwede,T. and Tramontano,A. (2014) Assessment of the assessment: evaluation of the model quality estimates in CASP10.Proteins,82, 112–126.
23. Kryshtafovych,A., Barbato,A., Monastyrskyy,B., Fidelis,K., Schwede,T. and Tramontano,A. (2016) Methods of model accuracy
6 Nucleic Acids Research, 2017
estimation can help selecting the best models from decoy sets: assessment of model accuracy estimations in CASP11.Proteins,84, 349–369.
24. Jones,D.T., Singh,T., Kosciolek,T. and Tetchner,S. (2015) MetaPSICOV: combining coevolution methods for accurate prediction of contacts and long range hydrogen bonding in proteins.
Bioinformatics,31, 999–1006.
25. Buchan,D.W., Minneci,F., Nugent,T.C., Bryson,K. and Jones,D.T. (2013) Scalable web services for the PSIPRED Protein Analysis Workbench.Nucleic Acids Res.,41, W349–W357.
26. Kabsch,W. and Sander,C. (1983) Dictionary of protein secondary structure: pattern recognition of hydrogen-bonded and geometrical features.Biopolymers,22, 2577–2637.
27. Ben-David,M., Noivirt-Brik,O., Paz,A., Prilusky,J., Sussman,J.L. and Levy,Y. (2009) Assessment of CASP8 structure predictions for template free targets.Proteins,77, 50–65.
28. Jones,D.T. and Cozzetto,D. (2015) DISOPRED3: precise disordered region predictions with annotated protein-binding activity.
Bioinformatics,31, 857–863.
29. Haas,J., Roth,S., Arnold,K., Kiefer,F., Schmidt,T., Bordoli,L. and Schwede,T. (2013) The Protein Model Portal–a comprehensive resource for protein structure and model information.Database (Oxford),2013, bat031.