Tropicalization Process of the 7 November 2014
Mediterranean Cyclone:
Numerical Sensitivity Study
D. S. Carrió
1, V. Homar
1, A. Jansa
1, R. Romero
1and M. A. Picornell
21 Meteorology Group, Department of Physics, Universitat de les Illes Balears, Palma de
Mallorca, Spain
2Agencia Estatal de Meteorología, Palma de Mallorca, Spain
Submitted to Atmospheric Research
Corresponding author address: Diego Carrió, Dept. of Physics, Universitat de les Illes Balears, 07122 Palma de Mallorca, Spain
e-mail: [email protected]
KEYWORDS: Medicane, Extra-tropical Cyclone, Cyclogenesis, Factor Separation, Potential-vorticity inversion, Hart’s diagram
Abstract
Tropical-like Mediterranean cyclones (medicanes) have been documented and investigated in the literature, revealing that their physical mechanisms are still poorly understood and likely not unique across cases. During late hours of 7 November 2014 a small-scale cyclone was detected over the Sicilian channel, affecting the Islands of Lampedusa, Pantelleria and Malta. Gust wind values exceeding 42.7 m s-1 and a pressure drop above 20 hPa in 6 hours were registered in Malta. Clear signatures of a well-defined cloud-free eye surrounded with convective activity of axisymmetric character were identifiable through IR satellite imagery during the late stages of the cyclone, resembling the properties of a hurricane. We investigate the cyclogenesis and posterior development of this small-scale cyclone as well as its physical nature; to this aim, a set of high-resolution sensitivity numerical experiments were performed. Hart’s phase diagrams adapted to the Mediterranean region clearly reveal the tropical characteristics of the simulated storm. A numerical sensitivity analysis by means of a factor separation technique is used to gain quantitative insight on the roles latent heat release, surface heat fluxes and upper-level PV signatures (dynamically isolated through a PV-Inversion technique) have on the unfold of this singular event. Results show the importance of the upper-level dynamics to generate a baroclinic environment prone to surface cyclogenesis and in supporting the posterior tropicalization of the system. On the contrary, latent heat release and surface heat fluxes factors do not seem to contribute, as individual processes, to the genesis of the cyclone as much as it could be suspected, considering it behaves as a tropical-like cyclone. However, the asynchronous synergism between latent heat release and PV factors plays a crucial role for the intensification of the cyclone towards reaching the pure diabatic phase.
1.
Introduction
Cyclogenesis and Mediterranean region are closely linked, with the frequency of cyclones in the basin ranking among the highest in the world (Pettersen, 1956; Radinovic, 1987). Mediterranean cyclones occasionally produce hazardous weather, generating high impacts on exposed people and property assets (Jansa et al., 2001; Gomez et al., 2002; De Zolt et al., 2006). There is an extensive body of literature analyzing the physical and climatological characteristics of these cyclones (e.g. Jansa et al. (2014) for a recent review) and various approaches have been used to formulate conceptual models that either explain the mechanisms of their formation or outline their features. The deepest and most intense cyclones are associated with all kinds of high-impact weather, in particular strong winds and torrential precipitations (Jansa et al., 2001; Lionello et al., 2006). One descriptive way to classify Mediterranean cyclones is based on their location, morphological characteristics (Alpert et al., 1990; Trigo et al., 1999; Campins et al., 2000; Hoskins and Hodges, 2002; Wernli and Schwierz, 2006; Campins et al., 2011;) and even the preceding synoptic conditions that led to their formation (Homar et al., 2006; Garcies and Homar, 2009). A complementary but linked classification is based on the physical mechanisms involved in the genesis, intensification, evolution and decay of the cyclonic system.
In recent years, a relatively rare type of Mediterranean cyclone with some tropical characteristics, has got the attention of the meteorological scientific community. These cyclones are relatively small in size and associated to strong winds and usually heavy precipitations (Ernst and Matson, 1983; Rasmunssen and Zick, 1987; Lagouvardos et al., 1999; Fita et al., 2007). They share morphological characteristics with hurricanes such as
a warm core, axisymmetry and cloud-free eye, and have been consequently named Mediterranean hurricanes (Emanuel, 2005) or simply medicanes.
Various studies highlight the role of surface heat fluxes in medicanes, along with high values of mid-tropospheric relative humidity and low values of wind shear (Rasmussen and Zick, 1987; Lagouvardos et al., 1999; Pytharoulis et al. 1999; Pytharoulis et al., 2000; Homar et al., 2003; Moscatello et al., 2008; Tous et al., 2013, Cavicchia et al., 2014). Additionally, Businger and Reed (1989), described this kind of cyclones over the Mediterranean Sea as a subclass of polar lows. The accepted conceptual model for the intensification and maintenance of medicanes is similar to that of tropical cyclones, being governed by surface energy fluxes within pre-existing organized cyclonic environments, although with the very substantial difference of the requirement for an upper-level cold trough that contributes to cool and moisten the low and mid-tropospheric environment, thus increasing the air-sea gradient of saturation moist static energy (Emanuel, 2005). Therefore, a key factor for classical baroclinic cyclogenesis in the Mediterranean, such as an upper-level trough, may also positively contribute to generate tropical-like cyclone prone environment, especially during the mature development, when the vertical wind shear -both directional and in magnitude- tends to decrease. The rarity of medicanes as opposed to the commonness of synoptic troughs affecting the region is an obvious indication that further conditions must be met for medicane formation (Tous and Romero, 2011; Cavicchia et al., 2012; Tous and Romero, 2013). As highlighted by Cioni et al. (2016), the physical mechanisms contributing to a certain sea-level pressure distribution (e.g. a cyclonic area) alternate and even coexist in the same area and period of time, thus making the attempt to classify some systems within pure baroclinic (i.e., extratropical) or diabatically driven (i.e. tropical-like) classes a daring and unrealistic objective. Some
baroclinic cyclones evolve into symmetrical structures during its occlusion phase, with intense latent heat release around its core, posing a serious forecast challenge similar to that found in the the so-called extratropical transition of tropical cyclones. Jones et al. (2003) allude to the continuum spectrum between pure tropical and pure baroclinic synoptic systems and to the difficult forecast implications of extratropical transitions, mainly due to the lack of observations over the maritime areas as well as the model limitations to reliably simulate physical interactions between baroclinic and thermodynamic processes at high resolution.
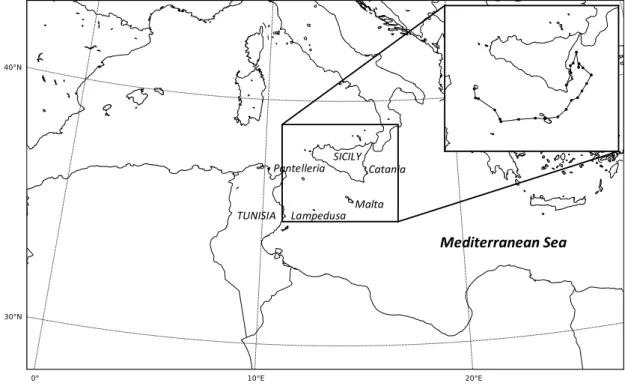
During 7 November 2014, a mid-levels synoptic trough extended across the Western Mediterranean, reaching as far south as southern Algeria. Cyclonic conditions were present at low levels over the western Mediterranean since 4 November. On 7 November a small intense cyclone formed in the South Central Mediterranean Sea and moved northeasterly towards southern Sicily, affecting the Islands of Pantelleria, Lampedusa and Malta (Figs. 1 and 2). The small and rapidly-rotating system dissipated as it crossed the Catanian coast (eastern Sicily), during the first hours of 8 November.
The main scope of this study is to advance in our understanding of the physical mechanisms involved in the genesis of quasi-tropical like cyclones (Homar et al., 2003), such as the case of 7 November 2014, with special focus on the diagnosis of the extratropical and tropical characteristics based on satellite, gridded analysis and high-resolution numerical simulations.
Section 2 describes the event using synoptic charts, satellite imagery and observations from METARs (METeorological Aerodrome Reports). Section 3 presents the
characteristics of the control simulation and its verification against observations. Sensitivity experiments taking into account the roles of a set of relevant factors are discussed in section 4. Finally, section 5 provides the discussion and conclusions of this research work.
2. Description of the event
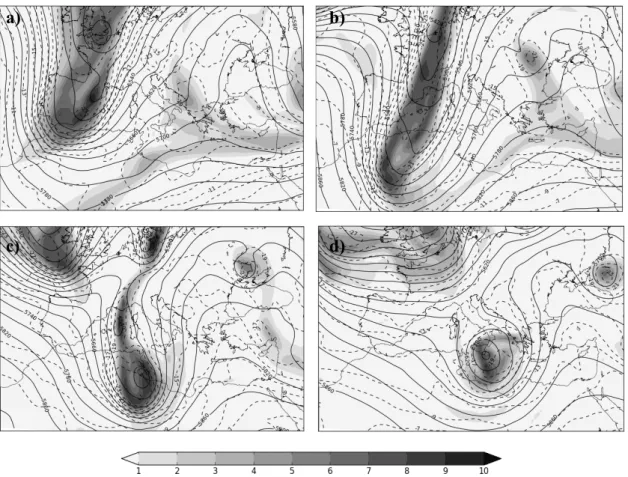
From 5 to 8 November 2014, the Western Mediterranean was under the influence of an intense upper-level trough and general cyclonic flow at low levels. The Global Forecast System (GFS) analyses, produced by the National Centers for Environmental Prediction (NCEP), are used to diagnose the synoptic setting of the event. The synoptic situation at mid-levels over the Western Mediterranean on 5 and 6 November 2016 was dominated by a prominent ridge over the Atlantic and the intense trough moving southwards along western Europe, with an associated intense PV streamer extending from northern Europe and reaching the southern Algerian lands during 6 November (Fig. 3). The general cyclonic circulation over the Western Mediterranean was influenced by the North Atlantic Subtropical High and high-pressures over the Eastern Mediterranean (Fig. 4). The cold and warm fronts associated with the cyclonic circulation were reinforced by a persistent northward advection of a warm and moist plume across the central Mediterranean during 5, 6 and 7 November. During 6 November, the upper-level trough became negatively tilted and the PV streamer eventually disconnected from the northern nucleus, evolving into an intense (reaching 8 PVU at 300 hPa; 1 PVU = 10-6 K m2 s-1 kg -1) upper-level cut-off during the late hours of 7 November (Fig. 3).
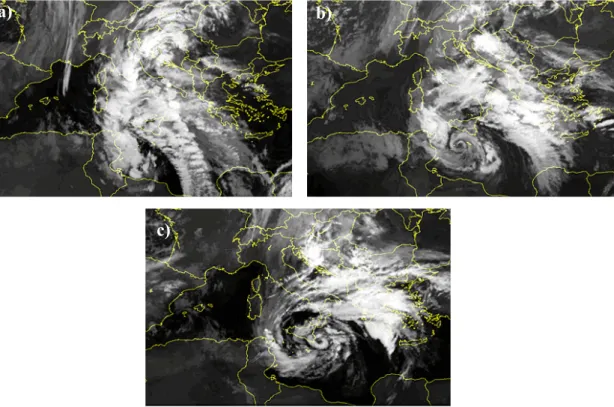
During the first hours of 7 November, the enhanced vorticity advection aloft forced general uplifts and further low-level cyclogenesis over the Sicily area. Infrared Meteosat Second Generation (MSG2) imagery show that, in addition to the convective activity already identifiable along the cold and warm fronts, deep convective systems formed during the night and first hours of 7 November around the initiation area of this quasi-tropical Mediterranean cyclone (Fig. 1a). During the midday hours of 7 November, a small well-defined spiral-to-circular shaped cloud formed just south of Sicily and evolved east-northeastward (Fig. 1b), reaching its maximum measured intensity over Malta. The small cyclonic circulation, which possessed distinct circulation from the larger cyclone, continued progressing until the last hours of 7 November. A clear and well-defined eye was visible all along its trajectory, although deep convection around the eye was only intermittent. Finally, the small cyclonic system dissipated as it crossed the Catanian (eastern) coast of Sicily (Fig. 1c), moving over land.
Since the small cyclone initiated and moved over the sea (Fig. 2), a quite limited number of observations are available. METAR reports from land locations close to the cyclone path (i.e., Pantelleria, Lampedusa, Malta and Catanian coast; see Fig. 2 for geographical references) provide in-situ measurements of the small cyclone. During the first hours of 7 November, an incipient depression was recorded in Pantelleria, still fairly shallow at this time. Despite the center of the cyclone progressed eastwards some 100 km north of Lampedusa, surface pressure records in the island show a 10 hPa drop in 1.5 h. The barometer in Malta recorded a pressure drop of nearly 20 hPa in 6 h, from 1046 to 1645 UTC, and a minimum recorded pressure for the event of 985 hPa at 1645 UTC (Fig. 5c). The wind record in Malta provides a clear signature of the structure of the eye, with intense wind speeds (gusts exceeding 42.7 m s-1) that precedes and follows a relatively
calm period around 1645 UTC. Ten hours later, the signature over the Catania pressure record is much attenuated, with winds still showing a calmed period followed by gusts reaching 40 m s-1.
The intensity, pressure record and some morphological characteristics such as the central eye and cloud symmetry, more clear at the end of the process than at the beginning (see Fig. 1c) contribute to the idea of a cyclonic entity with mostly tropical mechanisms driving its circulation and pressure pattern, at least at the end of the process. However, the lack of continuous and persistent deep convective activity in the central part of the system, as evidenced by the time series of satellite images, and the presence of dry air intrusions turning around the cyclone center, like in many extratropical mature disturbances (see Fig. 1b), lead us to hypothesize a certain coexistence of various cyclogenetic mechanisms. It should be noted that the lack of deep convective activity is not exclusive of this medicane event (see, for instance (Luque et al. 2007, Claud et al. 2010 and Miglietta et al. 2013)).
In order to investigate and better diagnose the physical mechanisms involved in this intense and localized Mediterranean cyclogenesis, numerical experiments were performed and are presented in the following sections.
3. Control run
Numerical simulations were done using the Advanced Research core of the Weather Research and Forecasting Model Version 3.4 (WRF-ARW; Skamarock et al. 2008), a fully compressible and nonhydrostatic mesoscale model. GFS analysis from the Global Data Assimilation System which continuously assimilates observations mainly from the Global Telecommunications System, are used as initial and boundary conditions every three hours, with a horizontal grid resolution of 0.5º (approximately 50 km).
We define a high-resolution domain with 2.5 km horizontal grid-size and 1040x640 points, which covers most of the Mediterranean Sea basin (Fig. 2). In the vertical, we adopted 30 terrain-following η levels up to 50 hPa, with higher density of levels in the
lower troposphere. Keeping in mind the timing of the formation of the small cyclone during the midday of 7 November, and with the aim of correctly capturing the initial, mature and dissipation phases of the cyclone, a 48 h forecast from 0000 UTC 7 November is performed. Thus, the model has sufficient spin-up time to reach balance before the cyclone forms. The parameterized physics options used include: the single-moment Thompson microphysics (Thompson et al. 2004, 2008), preferred for its ability to well-represent updraft/downdraft cores and rainfall distribution compared with other microphysics schemes (Rajeevan, M. et al 2010); the short- and long-wave (SW/LW) radiation scheme RRTMG (Iacono et al. 2008), and the second-order planetary boundary layer (PBL) scheme Mellor-Yamada Nakanishi and Niino Level 2.5 (MYNN2; Nakanishi and Niino 2006, 2009).
The relevance of the numerical sensitivity experiments is conditioned by the availability of an accurate control run that reproduces the main observed characteristics of the small-scale cyclone, bearing in mind the inherent limitations of any modeling system. Despite the northward shift in the simulated trajectory, the model reproduces the evolution and deepening of the cyclone, mainly during the first hours of its lifetime (Fig. 6a). The simulated surface pressure signature near Malta shows good agreement with the observations at the Luqa airport (Fig. 6b). Discrepancies in the simulated cyclone-track during the dissipating stage deserve some attention. The curvature of the observed trajectory coincides with the progression of the vorticity advection maximum associated with the cut-off low aloft (Fig. 3d). The divergence between modeled and observed trajectory might be attributable to a misrepresentation of the upper-levels dynamics. A sensitivity experiment, presented in section 4, is designed to investigate the main drivers of the small cyclone evolution.
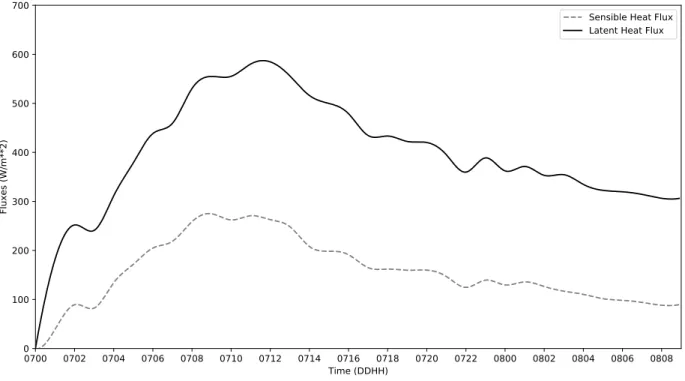
The role of air-sea fluxes during the lifecycle of quasi-tropical cyclones is crucial. Indeed, the genesis and evolution of tropical cyclones require a strong diabatic contribution to the surface levels equivalent potential temperature, helping to enhance moisture and convective destabilization mechanisms. Not only tropical cyclones organize and intensify from surface heat fluxes distribution but primarily derive their energy from the release of latent heat obtained from the ocean surface layers (Ooyama, 1969). Medicanes are also shown to be influenced by air-sea interactions but synoptic dynamical forcings are still determinant as revealed by numerical experiments (Tous et al., 2013). For this case, both sensible and latent surface heat fluxes around the core of the simulated cyclone show a rapid intensification during the first hours of 7 November (Fig. 7) reaching the maximum values (nearly 600 and 300 W m-2) during the most intense phase of the cyclone (8-12
UTC 7 November). These high values are comparable with those attributed to Atlantic hurricanes by Kowaleski and Evans (2015), with Bowen ratios (ratio of sensible to latent heat fluxes; Bowen, 1926) at the 0.5 level, suggesting a moist boundary layer in the cyclone vicinity.
Additionally, a direct verification of the simulated small cyclone with in-situ observations lacks significance due to the reduced number of observations available along the essentially maritime cyclone track. Therefore, an alternative verification of the control run is performed using model Precipitable Water (PW), calculated from 650 to 200 hPa, as a pseudo-derived product of satellite imagery:
𝑃𝑊 = 𝑔&' ,-..𝑞 𝑑𝑝 ,
,/0.
where q is the specific humidity and g the gravity. Overall, simulated PW structures (Fig. 8) match the shape, location and time of those observed over satellite images, including the dry and wet spiral bands around the cyclone center. For this comparison, we used radiances derived from Meteosat-Seviri satellite instruments (6.2 µm) which provide information of water vapour content representative of upper levels between 600 and 150 hPa (with maximum signal at 350 hPa). During the first hours of simulation, simulated PW shows the upper-air dry intrusion curling around the low-pressure center, suggesting a baroclinic development (Fig. 8a). However, in the following hours, the PW signature clearly transitions to an axisymmetric shape structure around the small cyclone eye, allegedly detached dynamically from the larger parent spiral circulation (Fig. 8 b and c). It is noteworthy that, in addition to the well-represented axisymmetric cloud-free eye, the
model simulates a clear warm-core anomaly (Fig. 9 a and c). Both properties are identifying characteristics of quasi-tropical Mediterranean cyclones.
In order to complete the description of the aforementioned simulated cyclone, a method to study the life cycle and thermal structure of cyclonic systems is implemented. Hart (2003) proposed a three-dimensional phase space to analyze the cyclone structural evolution using three variables defined over a circular area of influence around the cyclone center. Such parameters are: the storm-motion relative low troposphere thickness asymmetry (B), the low tropospheric thermal wind (-VTL) and the upper-tropospheric thermal wind (-VTU). The low tropospheric thermal wind indicates the low levels thermal core structure (cold, neutral or warm) whereas the upper-tropospheric thermal wind helps distinguish between deep and shallow warm-core cyclones. With the objective of simplifying the visualization of the trajectories in phase space, two cross sections -called the phase diagrams- are usually plotted. A mesoscale-adapted version of original Hart’s cyclone phase diagrams (Picornell et al., 2014) has been used to our small-scale cyclone (Fig. 10). One of the substantial changes in this modified version includes a storm-size-dependent circle of exploration, the mean radius of the warm-core anomaly (as suggested in Hart (2003)).
During the first hours of the numerical simulation, the structure of the system is becoming smaller in size and its thermal character is changing from deep-cold to shallow-warm symmetric core (Fig. 10), depicting symmetry throughout the whole lifetime of the cyclone. However, the system is still deepening with time, reducing its size from 240 to 100 km, when the cyclone is described as symmetric deep warm core (medicane), for the first time on 7 November at 0700 UTC (Fig. 10b). On the following hours, an
intensification of the cyclone is observed in the phase diagram depicting a deeper warm cyclone core. The cyclone presents medicane features until the end of the simulation on 8 November at 1200 UTC.
4. Sensitivity Experiments
A set of sensitivity experiments (Table 1) is used to investigate the physical mechanisms involved in the genesis and evolution of the cyclonic storm. The presence of the intense upper-level trough, with the associated vorticity advection and the dry-intrusion, suggests that baroclinicity would have played a dominant role in the development of this small cyclone. On the other hand, the central eye and cloud structure symmetry on satellite images together with a ring of convective activity around the eye during the later stages of its lifecycle indicate a level of organization characteristic of tropical systems.
a) Reduced upper-level PV experiment (EXP_PV)
In order to assess the effect of the upper-level dynamics on the cyclogenesis and posterior evolution of the cyclone, the PV-inversion technique of Davis and Emanuel (1991) is applied in this study to generate test conditions with reduced upper-level dynamic forcing on the low-level cyclogenesis. It is noteworthy that the PV-inversion technique is applied over an extended geographical domain (see Fig. 11) using a grid resolution of 16 km. A modified PV field, with the amplitude of the southernmost part of the PV anomaly (defined with respect to the zonal mean) fully removed (see Fig. 11b), is inverted and used to define the initial conditions for this experiment (labeled EXP_PV). For further details about the application of this technique see Homar et al. (2003). This modification
is substantial (exceeding 8 PVU at some points) but focused over the portion of the trough hypothesized to influence the low-level development the most. The result of weakening the southern tip of the PV streamer is a clear reduction in the depth of the trough, eliminating the isolated cut-off circulation (Fig. 11 c-d). Differences identified between EXP_CNTR and EXP_PV simulations are effects unequivocally attributable to the upper level PV perturbation (shaded structure in Fig. 11b).
b) Diabatic forcing experiments (EXP_NLH and EXP_NSFL)
Although the presence of an upper-level cold disturbance contributes to destabilize the Mediterranean troposphere, heat fluxes from the sea surface often provide the tipping point to trigger convection and support intense and sustained diabatic warming through latent heat release from condensation. As previously discussed, sea surface fluxes found for this case are similar to those present in tropical cyclones and these diabatic contributions to the low-level equivalent potential temperature would play an important role in the formation of an isolated and self-sustained vorticity structure of tropical nature (i.e. a medicane or tropical-like Mediterranean cyclone) embedded in the parent cyclonic environment. In order to quantitatively assess the effects of the latent heat release and the surface heat fluxes on the genesis and evolution of the small cyclone, two experiments are designed. In EXP_NLH diabatic heating from condensation is removed in the simulation: surface fluxes are still activated, but the diabatic generation of vorticity from latent heat release is not included in this experiment (see Table 1). Additionally, EXP_NSFL tests the effects of both sensible and latent heat surface fluxes, as these are entirely removed from the numerical simulation.
c) Experiments results
A comparison of the MSLP at 1800 UTC 7 November among the control run and the three sensitivity experiments is presented in Fig. 12. Although surface heat fluxes are moderate around the cyclone center during its lifecycle, EXP_NSFL reveals that no significant differences result when these surface fluxes are removed from the simulation (Fig. 12d). The suppression of these fluxes is mainly reflected in a colder core and shallower center of the simulated cyclone, compared with the control experiment (Fig. 9 b and d). Since surface heat fluxes are proved not relevant in the genesis phase and posterior evolution of the cyclone, this factor is not further considered in the sensitivity analysis. On the other hand, EXP_NLH simulates a completely different scenario in terms of MSLP (Fig. 12b). Without the contribution of latent heat release from condensation, no distinct cyclonic structure is simulated in the core of the larger baroclinic cyclone covering the Western Mediterranean. This is a clear indication of the crucial role diabatic processes play in the genesis and maintenance of the small cyclone, in the line of the conceptual model of medicane genesis. Diabatic processes seem to exert an action that goes beyond the mere intensification of the synoptic baroclinic cyclone around its core during the occlusion stage, and are shown to provide the energy to generate a self-sustained small tropical-like system.
Results from the EXP_PV (Fig. 12c) also show a notably different evolution from the control run, showing a synoptic low displaced to the north and associated with relatively low mean sea level pressure values. The northward displacement results from the more rapid evolution of the weakened upper level trough, which, without its cut-off feature, progresses faster, steering the low-level cyclogenesis.
In summary, the latent heat release and the dynamic forcing from the cut-off system aloft are both identified as leading factors for the formation of the small cyclonic circulation. The Hart’s phase diagrams for the sensitivity experiments reveal that the EXP_NSFL also simulates a medicane phase, confirming the weak influence of the surface fluxes. The main differences with respect to the control evolution are found in the shorter duration and shallower depression of the simulated cyclone in the EXP_NSFL (not shown).
d) Factor separation
In order to get a deeper insight on the impact each of the two relevant factors (PV and LHR) has on the evolution of the cyclone, as well as to quantify the joint contribution to the formation of the small cyclonic system, we apply the factor separation technique of Stein and Alpert (1993). This technique allows to quantify the individual and combined effects of predefined factors on any measurable aspect of a numerical experiment. The PV and LHR factors could be interpreted as valid proxies for baroclinic and tropical-like contribution to the cyclogenesis. Some studies hypothesize that baroclinic instability plays a spin-up role in the genesis of cyclones and then, after initiation, convective instability and latent heat release, fed by air-sea interaction, are able to sustain the cyclone intensification (Emanuel and Rotunno, 1989). This conceptual model fits this case study, although air-sea fluxes are only ancillary to the effect of latent heat release from pre-existing environmental moisture. The factor-separation technique helps to quantitatively assess the effects of latent heat release and upper-level PV anomaly, as well as their synergism on the genesis and evolution of the system.
Factor separation results on the MSLP drop (i.e. cyclogenesis) at the time the observed cyclone achieves its most intense phase (~1800 UTC on 7 November) reveals that the PV effect contributes efficiently to the early genesis of the cyclone (Fig. 13a). On the contrary, latent heat release does not seem to individually contribute to neither the genesis nor the development of the cyclone (Fig. 13b). In fact, the most relevant impact on the evolution of the cyclone is the synergism between latent heat release and upper-level PV anomaly (Fig. 13c). This combined action contributes more than 10 hPa to the deepening of the cyclone center.
A time evolution of the cyclogenetic –or cyclolitic- effects of the three factors (Fig. 14) over the EXP_CNTR low pressure system reveals that during approximately the first 5 hours of simulation, the PV anomaly effect dominates the cyclogenesis, contributing more than 6 hPa to the cyclone center deepening. After that time, the negative tendency on the MSLP due to the PV effect stops and a slight cyclolitic phase takes place until the end of the experiment. On the other hand, LHR effect does not contribute significantly to the deepening of the cyclone during the entire simulation period, confirming the minor role played by this factor individually when no environmental preconditioning support from the upper level dynamics is present. Regarding the synergy between PV anomaly and LHR effects, it is shown that after 03 UTC it becomes the leading process for the cyclogenesis, such that after 07 UTC it contributes more than any other factor to the accumulated pressure drop at the cyclone center. This synergistic mechanism has reduced the MSLP by approximately 11 hPa at 1600 UTC 7 November (EXP_CNTR cyclone mature time). It is noteworthy that the total effect describes the development of a ‘meteorological bomb’ (Sanders and Gyakum, 1980) since the MSLP drop largely exceeds the theoretical threshold of 16.7 hPa/24h for a latitude of ~37º.
We can conclude that, in agreement with Emanuel (2005), the upper-level PV anomaly plays a key role as preconditioning mechanism. In fact, it is the interaction effect between PV anomaly and latent heat release that, after the first hours, becomes the most important factor sustaining the cyclogenesis phase, and the posterior transformation into a medicane.
5. Summary and discussion
During 7 and 8 November 2014, a small intense cyclone formed in the South Central Mediterranean Sea and evolved northeastwards, approaching southern Sicily and mainly affecting Pantelleria, Lampedusa and Malta Islands. Available observations indicate that wind gusts reached 42.7 m s-1 while a minimum pressure of 985 hPa was recorded. Throughout the first hours of 7 November, a small spiral-to-circular cloud shape was identifiable from IR satellite imagery. The spiral structure continued evolving with time during the day until it gained a circular shape with a well–defined eye surrounded by convective activity. Such observations are indicative of the formation of a tropical-like Mediterranean cyclone (medicane). This study provides a better understanding of the physical mechanisms involved in the cyclogenesis of medicanes and particular attention has been devoted to the diagnosis of the tropical and extra-tropical features based on satellite imagery and high-resolution numerical simulations.
The phase transition from extra-tropical to tropical-like cyclone captured by satellite images is accurately depicted by the simulated PW. The control experiment also reproduces properly the timing and location of the cloud patterns observed throughout IR
satellite imagery. Furthermore, the numerical model simulates to good extent the observed trajectory of the cyclone, as well as its fast deepening during the first hours of its lifetime. Only during the last phase of the event the simulated trajectory departs significantly from the observed track. The inferred physical mechanisms are confirmed through the analysis of thermal wind and thickness asymmetry parameters by means of the Hart’s diagrams. The simulated cyclone shows the transitions from a shallow-warm to a deep-warm symmetric core (medicane) during the first hours of 7 November. From this time on, the simulated cyclone remains as a medicane until the end of the experiment on 8 November at 1200 UTC.
High-resolution numerical sensitivity experiments were performed to examine the role of different key factors for the genesis and posterior evolution of the small cyclone, using a combination of the factor separation and PV-Inversion techniques. In light of the similarities of the system with tropical cyclones, we analyze the roles of latent heat release, surface heat fluxes and the dynamical forcing linked to an upper-level potential vorticity anomaly. Results indicate the relevant role of the PV effect on the cyclogenesis during the early stages of the event, helping to set up a deep convection prone environment required for the medicane development. Conversely, neither the latent heat release nor the surface heat fluxes seem to contribute significantly to the genesis or evolution of the small-scale cyclone as individual factors. However, the most crucial phase of deepening and circular-shaping of the cyclone is attributable to the synergism between PV and LHR factors. We conclude that during the first hours of 7 November, the baroclinic effects associated with the PV anomaly contributed to the early development of the cyclone, but it is the synergism between PV and latent heat release
the factor that actually contributes the most to the cyclogenesis and posterior intensification of the mature system into a medicane.
These results also highlight that small and intense cyclonic systems which are identified as medicanes because of their analogy with tropical cyclones signatures on satellite images, must be physically analysed in more detail before they can be classified as medicanes. Future work should gain insight on the physical mechanisms contributing to this small-scale cyclogenesis and verify whether pure diabatic processes, similar to those operating in genuine tropical cyclones, occur in the Mediterranean Sea.
Finally, the limited number of in-situ observations over maritime bodies poses specific challenges to the investigation of the tropicalization process that medicanes undergo. Within this context, numerical simulations are key tools to advance in the understanding of the physical mechanisms and environmental conditions that favor the cyclone transition. Based on these numerical studies, observational campaigns, such as the SOPs carried under the framework of HyMeX (Hydrological cycle in the Mediterranean Experiment), become promising action lines to gather observational evidences.
Acknowledgements:
This research is framed within the CGL2014-52199-R [Future Regional Impacts of Climate Change Associated to Extreme Weather Phenomena (EXTREMO)] Spanish project which is partially supported with AEI/FEDER funds. The first author was also supported by the FPI- CAIB (FPI/1877/2016) grant from the Conselleria d'Innovació, Recerca i Turisme del Govern de les Illes Balears and the Fons Social Europeu. The authors also acknowledge the computer resources at MareNostrum and the technical
support provided by Barcelona Supercomputing Center (AECT-2017-1-0014, RES-AECT-2017-2-0014), that al- lowed us to perform the high-resolution simulations presented in this study.
References:
Alpert, P., Neeman, B. U., & Shay-‐El, Y. (1990). Climatological analysis of Mediterranean cyclones using ECMWF data. Tellus A, 42(1), 65-77.
Bowen, I. S. (1926). The ratio of heat losses by conduction and by evaporation from any water
surface. Physical review, 27(6), 779.
Businger, S., & Reed, R. J. (1989). Cyclogenesis in cold air masses. Weather and Forecasting, 4(2), 133-156.
Campins, J., Genovés, A., Jansa, A., Guijarro, J. A., & Ramis, C. (2000). A catalogue and a classification of surface cyclones for the western Mediterranean. International journal of climatology, 20(9), 969-984.
Campins, J., A. Genovés, M. A. Picornell, and A. Jansa. 2011. “Climatology of Mediterranean Cyclones Using the ERA-40 Dataset.” International Journal of Climatology 31 (11): 1596–1614. doi:10.1002/joc.2183.
Cavicchia, L., and H. von Storch, 2012: The simulation of medicanes in a high-resolution regional climate model. Climate Dyn., 39, 2273–2290, doi:10.1007/s00382-011-1220-0.
Cavicchia, L., and H. von Storch, and S. Gualdi, 2014: A long-term climatology of medicanes. Climate Dyn., 43, 1183–1195, doi:10.1007/s00382-013-1893-7.
Cioni, G., P. Malguzzi, and A. Buzzi. 2016. “Thermal Structure and Dynamical Precursor of a Mediterranean Tropical-like Cyclone.” Quarterly Journal of the Royal Meteorological Society 142 (697): 1757–66. doi:10.1002/qj.2773.
Claud, C., Alhammoud, B., Funatsu, B. M., & Chaboureau, J. P. (2010). Mediterranean hurricanes: large-scale environment and convective and precipitating areas from satellite
microwave observations. Natural Hazards and Earth System Sciences, 10(10), 2199.
Davis, C. A., & Emanuel, K. A. (1991). Potential vorticity diagnostics of cyclogenesis. Monthly weather review, 119(8), 1929-1953.
De Zolt, S., Lionello, P., Nuhu, A., & Tomasin, A. (2006). The disastrous storm of 4 November 1966 on Italy. Natural Hazards and Earth System Science, 6(5), 861-879.
Emanuel, K. A., & Rotunno, R. (1989). Polar lows as arctic hurricanes. Tellus A,41(1), 1-17.
Emanuel, K. (2005). Genesis and maintenance of" Mediterranean hurricanes". Advances in Geosciences, 2(2), 217-220.
Ernst, J. A., & Matson, M. (1983). A Mediterranean tropical storm?. Weather, 38(11), 332-337.
Fita, L., Romero, R., Luque, A., Emanuel, K., & Ramis, C. (2007). Analysis of the environments of seven Mediterranean tropical-like storms using an axisymmetric, nonhydrostatic, cloud resolving model. Natural Hazards and Earth System Sciences, 7(1), 41-56.
Garcies, L., and V. Homar. 2009. “Ensemble Sensitivities of the Real Atmosphere: Application to Mediterranean Intense Cyclones.” Tellus, Series A: Dynamic Meteorology and Oceanography 61 (3): 394–406.
Gómez, M., Álvarez, E., Carretero, J. C., Pérez, B., Rodríguez, I., Serrano, O., & Sotillo, M. G. (2002). Oceanographic and atmospheric analysis of the 10–16 November 2001 Storm in the Western Mediterranean. In 4th EGS Plinius Conference on Mediterranean Storm (p. 5).
Hart, R. E. (2003). A cyclone phase space derived from thermal wind and thermal asymmetry. Monthly Weather Review, 131(4), 585-616.
Homar, V., Romero, R., Stensrud, D. J., Ramis, C., & Alonso, S. (2003). Numerical diagnosis of a small, quasi-‐tropical cyclone over the western Mediterranean: Dynamical vs. boundary factors. Quarterly Journal of the Royal Meteorological Society, 129(590), 1469-1490.
Homar, V., Jansa, A., Campins, J., & Ramis, C. (2006). Towards a climatology of sensitivities of Mediterranean high impact weather? first approach. Advances in Geosciences, 7, 259-267.
Hoskins, B. J., & Hodges, K. I. (2002). New perspectives on the Northern Hemisphere winter storm tracks. Journal of the Atmospheric Sciences, 59(6), 1041-1061.
Iacono, M. J., Delamere, J. S., Mlawer, E. J., Shephard, M. W., Clough, S. A., & Collins, W. D. (2008). Radiative forcing by long-‐lived greenhouse gases: Calculations with the AER radiative transfer models. Journal of Geophysical Research: Atmospheres, 113(D13).
Jansa, A., A. Genovés, M.A. Picornell, J. Campins, R. Riosalido, and O. Carretero. 2001. “Western Mediterranean Cyclones and Heavy Rain. Part 2: Statistical Approach.” Meteorological Applications 8 (1): 43–56. doi:10.1017/S1350482701001049.
Jansa, A., Alpert, P., Arbogast, P., Buzzi, A., Ivančan-Picek, B., Kotroni, V., ... & Speranza, A. (2014). MEDEX: a general overview. Natural hazards and earth system sciences, 14, 1965-1984.
Jones, S. C., Harr, P. A., Abraham, J., Bosart, L. F., Bowyer, P. J., Evans, J. L., ... & Sinclair, M. R. (2003). The extratropical transition of tropical cyclones: Forecast challenges, current understanding, and future directions. Weather and Forecasting, 18(6), 1052-1092.
Kowaleski, Alex M., and Jenni L. Evans. 2015. “Thermodynamic Observations and Flux Calculations of the Tropical Cyclone Surface Layer within the Context of Potential Intensity,” no. 1998: 1303–20. doi:10.1175/WAF-D-14-00162.1.
Lagouvardos, K., Kotroni, V., Nickovic, S., Jovic, D., Kallos, G., & Tremback, C. J. (1999). Observations and model simulations of a winter sub-synoptic vortex over the central Mediterranean. Meteorological Applications, 6(04), 371-383.
Lionello, P., Malanotte-Rizzoli, P., Boscolo, R., Alpert, P., Artale, V., Li, L., ... & Ulbrich, U. (2006). The Mediterranean climate: an overview of the main characteristics and issues. Developments in earth and environmental sciences,4, 1-26.
Luque, A., Fita, L., Romero, R., & Alonso, S. (2007). Tropical-like Mediterranean storms: an
analysis from satellite. EUMETSAT 07 proceedings.
Miglietta, M. M., Laviola, S., Malvaldi, A., Conte, D., Levizzani, V., & Price, C. (2013). Analysis
of tropical-‐like cyclones over the Mediterranean Sea through a combined modeling and satellite
Moscatello, A., Miglietta, M.M., Rotunno, R., 2008. Numerical analysis of a Mediterranean ‘hurricane’ over southeastern Italy. Mon. Weather Rev. 136, 4373–4397.
Nakanishi, M., & Niino, H. (2006). An improved Mellor–Yamada level-3 model: Its numerical stability and application to a regional prediction of advection fog. Boundary-Layer Meteorology, 119(2), 397-407.
Nakanishi, M., & Niino, H. (2009). Development of an improved turbulence closure model for the atmospheric boundary layer. 気象集誌. 第 2 輯, 87(5), 895-912.
Ooyama, K. (1969). Numerical simulation of the life cycle of tropical cyclones. Journal of the Atmospheric Sciences, 26(1), 3-40.
Pettersen, S., 1956. Weather Analysis and Forecasting. Mac Graw Hills Book Company, New York,USA.
Picornell, M. A., Campins, J., & Jansa, A. (2014). Detection and thermal description of medicanes from numerical simulation. Natural Hazards and Earth System Sciences, 14(5), 1059-1070.
Pytharoulis, I., Craig, G. C., & Ballard, S. P. (1999). Study of the hurricane-like Mediterranean cyclone of January 1995. Physics and Chemistry of the Earth, Part B: Hydrology, Oceans and Atmosphere, 24(6), 627-632.
Pytharoulis, I., Craig, G., & Ballard, S. (2000). The hurricane-like Mediterranean cyclone of January 1995. Meteorological Applications, 7(03), 261-279.
Radinovic, D. (1987). Mediterranean cyclones and their influence on the weather and climate. PSMP Rep. Ser.
Rajeevan, M., Kesarkar, A., Thampi, S. B., Rao, T. N., Radhakrishna, B., & Rajasekhar, M. (2010, February). Sensitivity of WRF cloud microphysics to simulations of a severe thunderstorm event over Southeast India. In Annales geophysicae: atmospheres, hydrospheres and space sciences (Vol. 28, No. 2, p. 603).
Rasmussen, E., & Zick, C. (1987). A subsynoptic vortex over the Mediterranean with some resemblance to polar lows. Tellus A, 39(4), 408-425.
Sanders, F., & Gyakum, J. R. (1980). Synoptic-dynamic climatology of the “bomb”. Monthly
Weather Review, 108(10), 1589-1606.
Stein, U., & Alpert, P. I. N. H. A. S. (1993). Factor separation in numerical simulations. Journal of the Atmospheric Sciences, 50(14), 2107-2115.
Skamarock WC, Klemp JB, Dudhia, J, Gill DO, Barker DM, Wang W., Powers, JG. 2008. A description of the advanced research WRF version 3. NCAR. Tech. Rep. TN-4751STR, 113pp. NCAR: Boulder, Colorado, USA.
Thompson, G., Rasmussen, R. M., & Manning, K. (2004). Explicit forecasts of winter precipitation using an improved bulk microphysics scheme. Part I: Description and sensitivity analysis. Monthly Weather Review, 132(2), 519-542.
Thompson, G., Field, P. R., Rasmussen, R. M., & Hall, W. D. (2008). Explicit forecasts of winter precipitation using an improved bulk microphysics scheme. Part II: Implementation of a new snow parameterization. Monthly Weather Review, 136(12), 5095-5115.
Tous, M., & Romero, R. (2011). Medicanes: cataloguing criteria and exploration of meteorological environments. Tethys, 8, 53-61.
Tous, M., & Romero, R. (2013). Meteorological environments associated with medicane development. International Journal of Climatology, 33(1), 1-14.
Tous, M., Romero, R., Ramis, C., 2013. Surface heat fluxes influence on medicane trajectories and intensification. Atmos. Res. 123, 400–411.
Trigo, I. F., Davies, T. D., & Bigg, G. R. (1999). Objective climatology of cyclones in the Mediterranean region. Journal of Climate, 12(6), 1685-1696.
Wernli, H., & Schwierz, C. (2006). Surface cyclones in the ERA-40 dataset (1958-2001). Part I: Novel identification method and global climatology. Journal of the atmospheric sciences, 63(10), 2486-2507.
TABLES: FIGURES: TABLES: FIGURES: TABLES:" "
TABLE 1. Configuration of the sensitivity experiments
Experiment Latent-heat release Sfc.-heat fluxes PV anomaly
EXP_CNTR 1 1 1 EXP_NLH 0 1 1 EXP_NSFL 1 0 0 EXP_PV 1 1 0 EXP_00 0 0 0 " " FIGURES:-" " " " " " " " " " Figure"1."IR-MSG"satellite"imagery"at"(a)"07:00"UTC,"(b)"14:00"UTC"and"(c)"21:00"UTC,"7" November"2012.""
a)-
b)-
c)-Figure 1. IR-MSG satellite imagery at (a) 0700 UTC, (b) 1400 UTC and (c) 2100 UTC, 7 November 2012.
TABLES:" "
TABLE 1. Configuration of the sensitivity experiments
Experiment Latent-heat release Sfc.-heat fluxes PV anomaly
EXP_CNTR 1 1 1 EXP_NLH 0 1 1 EXP_NSFL 1 0 0 EXP_PV 1 1 0 EXP_00 0 0 0 " " FIGURES:-" " " " " " " " " " Figure"1."IR-MSG"satellite"imagery"at"(a)"07:00"UTC,"(b)"14:00"UTC"and"(c)"21:00"UTC,"7" November"2012."" a) b) c)
Figure 1. IR-MSG satellite imagery at (a) 0700 UTC, (b) 1400 UTC and (c) 2100 UTC, 7 November 2014.
Table 1. Configuration of the sensitivity experiments: 1 indicates the factor is activated during the simulation and 0 otherwise.
Experiment Latent,heat.release Sfc.,heat.fluxes PV.anomaly
EXP_CNTR 1 1 1
EXP_NLH 0 1 1
EXP_NSFL 1 0 1
Figure 2. Numerical domain used in all experiments, centered over the Central Mediterranean Sea and including the locations referred to in the text. The top-right embedded diagram shows the path evolution of the cyclone viewed from satellite imagery. ! ! ! ! ! ! ! ! ! ! ! ! ! ! ! ! ! ! ! ! ! ! SICILY& TUNISIA& Mediterranean)Sea) Malta& &&Lampedusa& Pantelleria& Catania&
Figure! 2.! Numerical! domain! used! in! all! experiments,! centered! over! the! Central! Mediterranean! Sea! and! including! the! locations! referred! to! in! the! text.! The! top>right! embeded!diagram!shows!the!path!evolution!of!the!cyclone!viewed!from!satellite!imagery.!
Figure 3. Potential Vorticity (PVU, shaded) at 300 hPa, geopotential height (gpm, solid line) and temperature (°C, dashed line) from NCEP analyses at 500 hPa on 00 UTC (a) 5, (b) 6, (c) 7, (d) 8 November 2014.
! ! ! ! ! ! ! ! ! ! ! ! ! ! ! ! ! ! ! Figure!3.!Potential!Vorticity!(PVU,!shaded)!at!300!hPa,!geopotential!height!(gpm,!solid!line)! and!temperature!(°C,!dashed!line)!from!NCEP!analyses!at!500!hPa!on!00!UTC!(a)!5,!(b)!6,!(c)!7,! (d)!8!November!2014.! a) b) c) d)
Figure 5. Surface pressure (hPa, solid line), sustained wind and gusts (m s-1, light and dark grey bars respectively) from METAR stations, at (a) Pantelleria, (b) Lampedusa, (c) Malta and (d) Catania. Indicated times in UTC of 7 November 2014. Note the temporal scale changes among panels.
! ! ! ! ! ! ! ! ! ! ! ! ! ! ! ! ! ! ! ! ! ! ! ! 970 975 980 985 990 995 1000 1005 1010 1015 0 10 20 30 40 50 60 70 00: 20 02: 20 04: 20 06: 20 08: 20 10: 20 12: 20 14: 20 16: 20 18: 20 20: 20 22: 50 00: 50 02: 50 04: 50 06: 50 08: 50 10: 50 12: 50 14: 50 16: 50 18: 50 20: 50 22: 50 00: 50 970 975 980 985 990 995 1000 1005 1010 1015 0 10 20 30 40 50 60 70 00: 15 01: 15 02: 15 03: 15 04: 15 05: 15 06: 15 07: 15 08: 15 09: 15 10: 15 11: 15 12: 15 13: 15 14: 15 15: 15 16: 15 17: 15 18: 15 19: 15 20: 15 21: 15 22: 15 970 975 980 985 990 995 1000 1005 1010 1015 0 10 20 30 40 50 60 70 00: 15 00: 45 01: 15 01: 45 02: 15 02: 45 03: 15 03: 45 04: 15 04: 45 05: 15 05: 45 06: 15 970 975 980 985 990 995 1000 1005 1010 1015 0 10 20 30 40 50 60 70 00: 15 00: 45 01: 15 01: 45 02: 15 02: 45 03: 15 03: 45 04: 15 04: 45 05: 15 Figure!5.!Surface!pressure!(hPa,!solid!line),!sustained!and!gust!winds!(m!s<1,!light!and!dark!grey!bars!respectively)! from! METAR! stations,! at! (a)! Pantelleria,! (b)! Lampedusa,! (c)! Malta! and! (d)! Catania.! Indicated! times! in! UTC! of! 7! November!2014.!Note!the!temporal!scale!changes!among!pannels.!
a) b)
c) d)
Figure 4. Temperature (°C, dashed line) at 925 hPa and sea level pressure (hPa, solid line) from NCEP analyses at 00-12 UTC on (a-b) 6 and (c-d) 7 November 2012.
! ! ! ! ! ! ! ! ! ! ! ! ! ! ! ! ! ! ! ! ! ! Figure!4.!Temperature!(°C,!dashed!line)!at!925!hPa!and!sea!level!pressure!(hPa,!solid!line)! from!NCEP!analyses!at!00D12!UTC!on!(aDb)!6!and!(cDd)!7!November!2012.! a) b) c) d)
Figure 4. Temperature (ºC, dashed line) at 925 hPa and sea level pressure (hPa, solid line) from NCEP analyses at 00-12 UTC on (a-b) 6 and (c-d) 7 November 2014.
Figure 6. (a) Trajectory of the cyclone from 7 November at 08 UTC to 8 November at 08 UTC: Satellite-observed cyclone center (depicted hourly, black solid line) and simulated minimum pressure (depicted every 3h, grey dotted line). (b) Pressure recorded at Luqa airport (Malta, black line) and pressure given by the model (grey line) at the grid point of the simulated trajectory that is closest to Luqa Airport. ! ! ! ! 08 11 14 17 20 23 02 05 08 990.3 984.7 985.3 986.3 987.8 988.7 988.4 990.4 992.6 08 11 14 17 20 23 02 05 08 a)# #b)#
Figure 7. Temporal evolution of latent and sensible heat fluxes over a 100 km x 100 km area around simulated cyclone center.
Figure 8. Comparison between simulated precipitable water (mm) integrated over the 650-200 hPa layer and water vapour radiance (6.2 µm) from METEOSAT-SEVIRI satellite at (a,d) 1200, (b,e) 1500 and (c,f) 1800 UTC on 7 November.
a)
b)
c)
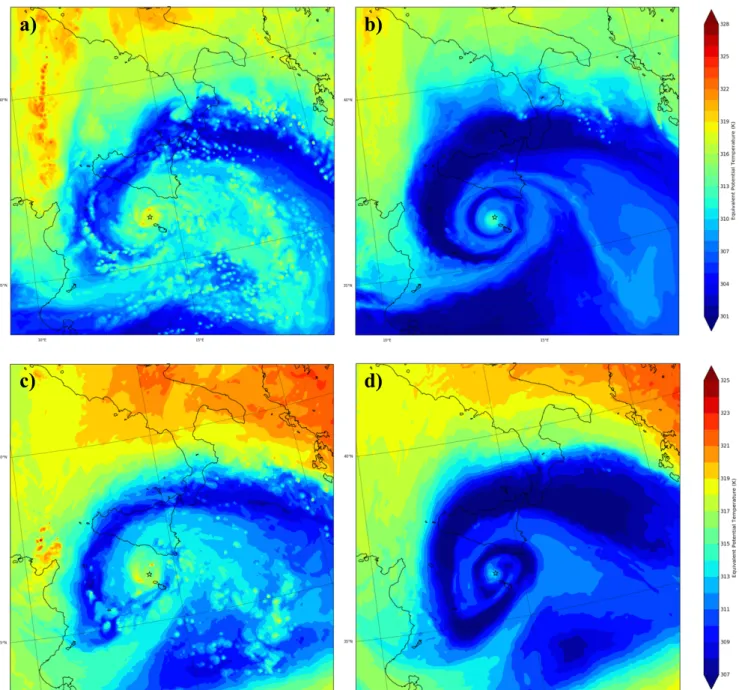
Figure 9. Equivalent potential temperature (K) attributable to EXP_CNTR and EXP_NSFL at (a-b) 700 hPa and (c-d) 500 hPa on 7 November at 18 UTC. A star shows the center of the cyclone at that time.
b)
a)
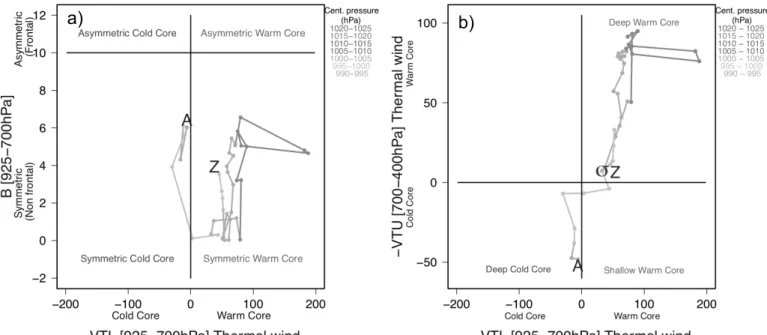
Figure 10. Cyclone phase diagrams I (a) and II (b) attributable to control simulation from 7 November at 00UTC to 8 November at 12UTC, labelled with A and Z respectively. Symbol σ indicates the first
time the cyclone becomes a medicane (7 November at 07 UTC).
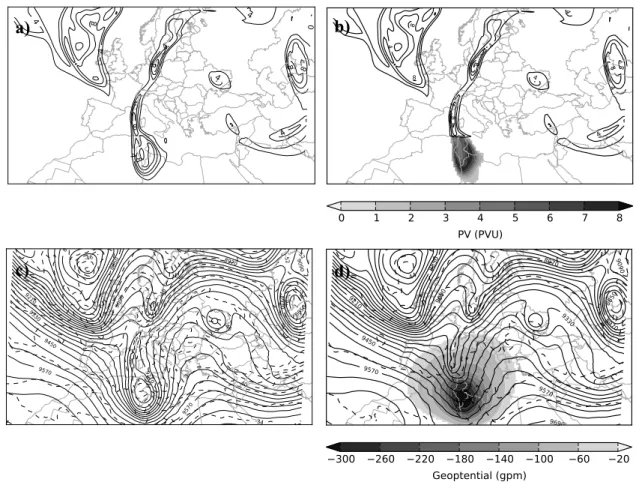
Figure 11. Potential vorticity (PVU, upper panels), and geopotential height (gpm, solid line) and temperature (ºC, dashed lines, lower panels) at 300 hPa on 00 UTC, 7 November 2014. Left panels show EXP_CNTR fields and right panels show EXP_PV fields used as initial conditions for the corresponding simulations. Shading on b) and d) panels show potential vorticity removed and geopotential height difference between EXP_CNTR and EXP_PV, respectively.
!
Figure 11. Potential vorticity (PVU, upper panels), and geopotential height (gpm, solid line) and temperatura (ºC, dashed lines, lower panels) at 300 hPa on 00 UTC, 7 November 2014. Left panels show EXP_CNTR fields and right panels show EXP_PV fields used as initial conditions for the corresponding simulations. Shading on b) and d) panels show potential vorticity removed and geopotential height difference between EXP_CNTR and EXP_PV, respectively.
a) b)
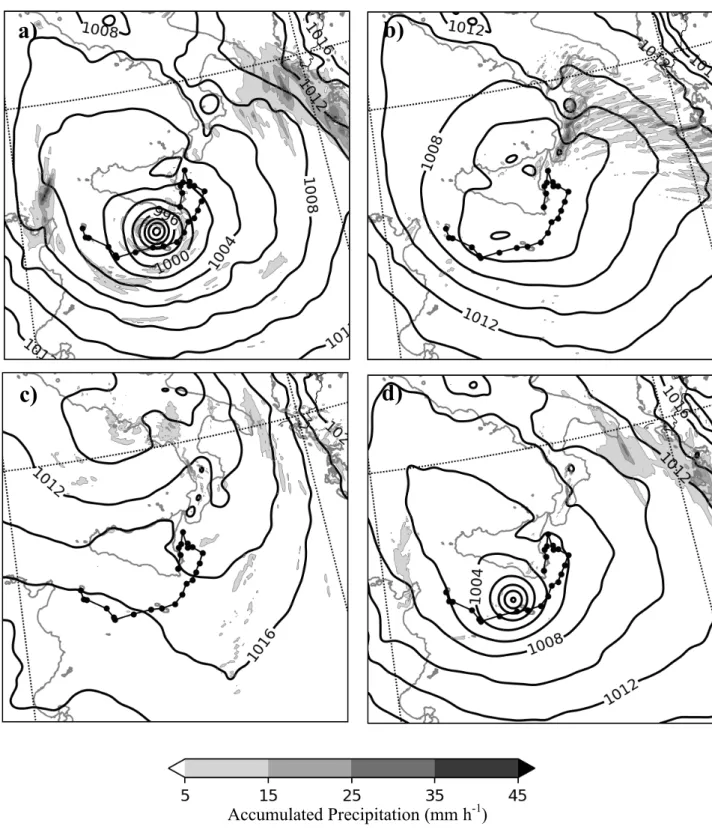
Figure 12. MSLP (hPa, solid line) and 2-hourly accumulated precipitation at 18 UTC 7 November 2014 for (a) EXP_CNTR, (b) EXP_NLH, (c) EXP_PV and (d) EXP_NSFL. Observed trajectory of the cyclone is also shown (connected dots).
Accumulated Precipitation (mm h-1)
a)
b)
d)
c)
Figure 13. Representation of the effects of a) potential vorticity anomaly, b) latent-heat release and c) synergy, over the MSLP drop field at 18 UTC 7 November 2014. Negative and positive effects are shown by dashed and solid lines respectively. Control simulated cyclone trajectory is also shown (connected bold stars).
a)
b)
Figure 14. Representation of the effects of potential vorticity anomaly, latent-heat release and synergy, over the MSLP drop, spatially averaged (10x10 km2) around cyclone center, during 7 and early 8 November 2014. Total effect is also shown (see legend).