Procedia - Social and Behavioral Sciences 227 ( 2016 ) 378 – 386
1877-0428 © 2016 The Authors. Published by Elsevier Ltd. This is an open access article under the CC BY-NC-ND license (http://creativecommons.org/licenses/by-nc-nd/4.0/).
Peer-review under responsibility of the organizing committee of CITIES 2015 doi: 10.1016/j.sbspro.2016.06.089
ScienceDirect
CITIES 2015 International Conference, Intelligent Planning Towards Smart Cities, CITIES 2015,
3-4 November 2015, Surabaya, Indonesia
Flood-prone Areas Mapping at Semarang City By Using Simple
Additive Weighting Method
Rizka Ella Setyani
a, Ragil Saputra
a*aComputer Science Diponegoro University, Prof. Soedarto, Tembalang Semarang 50275, Indonesia
Abstract
Semarang city is one of the cities in Java which is flooding frequently. This research develops Mapping of Flood-Prone Areas which is analyzed as the reasons of local flooding. Local flooding happens only in certain places where the rain falls. The criteria used are rain falls, topography, drainage, and the usage of land. There are many aspects that have to be analyzed, so that uses Simple Additive Weighting in order to determinate flood-prone areas. The advantages of this mapping of flood-prone areas are the user can easily access the informations about flood-prone areas that will be displayed in the form of a map, graphic, and table. © 2016 The Authors. Published by Elsevier Ltd.
Peer-review under responsibility of the organizing committee of CITIES 2015.
Keywords: Geographic Information System; Simple Additive Weighting; Flood-Prone;Local Flooding; Semarang City.
1. Introduction
Indonesia is a country of prone to natural disasters. Indonesia, especially Java, the cause of the flooding is still dominated by the high rainfall. Semarang city is one of example cities in Java are classified as areas that are often flooded.
Flooding is water runoff that exceeds the normal water level, so exploding from the riverbed caused a puddle on the low land on the river side (BNPB, 2013).
One of the technologies developed at this time is a Geographic Information System (GIS). SIG lately have a role
* Corresponding author. Tel.: +62 81326488466; fax: +0-000-000-0000 .
E-mail address: [email protected]
© 2016 The Authors. Published by Elsevier Ltd. This is an open access article under the CC BY-NC-ND license (http://creativecommons.org/licenses/by-nc-nd/4.0/).
in natural disaster mitigation. SIG consists of two components, namely spatial data related to the geometry of the shape of spatial and data attributes that provide information about the spatial form (Chang, 2002).
Determination of flood-prone areas is one of a kind Decision Support System (DSS). DSS is a computer-based information system that combines models and data to provide support to the decision makers in solving semi-structured problems or dependency problems involving users in depth (Turban et al, 2005) .One method used mainly in the SPK is Simple Additive Weighting (SAW). SAW is a multi-attribute procedure based on the concept of a weighted summation. Looking for a weighted summation of rating the performance of each alternative on all alternative criteria which the highest score overall is the best alternative and will be taken. This method can be used to support Geographic Information System with overlay operations (Malczewski,1999).
Research about flooding, have been carried out using various methods, such as using the Analytic Hierarchy Process (AHP) and Fuzzy Logic. Research by the Analytic Hierarchy Process (AHP) presents an approach for detecting flood-prone areas by combining with Geographic Information Systems (GIS). The criteria used to determine the flood-prone areas, are rainfall, geology, slope, the usage of land, soil type. AHP is used to determine the weight and value of each criterion assessment results, then integrated into the GIS system to produce estimates of flood maps (Matori et al, 2014). Whereas in other studies that use fuzzy logic of a model potential flooding that occurs in the arteries in Malang where fuzzy logic model used is the zero-order Sugeno fuzzy. The parameter used is the amount of rainfall, drainage, drainage coefficient and altitude region. In the data processing that will be used as input, several parameters processed using a calculation formula hydraulics, before the data are used as input fuzzy (Dewanto et al., 2013).
Based on above, in this study developed Mapping Prone Areas Flooding in the city of Semarang with the criteria analyzed as cause local flooding that are more local in accordance with the area that shed rain water is rainfall, topography, drainage, and the usage of land. Many aspects that must be analyzed is then used Simple Additive Weighting method in the determination of flood-prone areas. This system is expected to provide information useful for the government and society as widely accessible.
2. Methodes 2.1.Flooding
Floods are the overflow of river water caused by river discharge that exceeds the capacity on the state of high rainfall or inundation occurred in certain areas that are not normally stagnant (Kodoatie & Sugiyanto, 2002).
Causes of flooding can be divided into three kinds, namely (Suripin, 2004): 1. Flood submissions
Flood flow coming from upstream areas outside the flooded areas. This occurs if rain occurs upstream causing flooding that exceeds the flow capacity of the river or canal flood there, causing runoff.
2. Local Flood
Puddles arising from rain that fell in the region itself. This can happen if rain occurs exceeds the capacity of the existing drainage system. At the local flood, water inundation height between 0.2 to 0.7 m and the old pool of 1-8 hours. Present in low lying areas.
3. Flood rob
Flooding that occurs either due to direct the flow of the tide and / or water from the drainage channel behind due to hampered by the tide.
2.2.Simple Additive Weighting
Simple Additive Weighting (SAW) is a multi-attribute procedure is based on the concept of a weighted summation. Looking for a weighted summation of rating the performance of each alternative on all alternative criteria which the highest score overall is the best alternative and will be taken. This method can be used to support Geographic Information System with overlay operations (Malczewski, 1999).
Completion step is (Kusumadewi et al., 2006): 1. Determine alternative, namely Ai.
2.Determine the criteria that will be used as a reference in the decision, namely Cj. Subsequently identified the types of criteria, whether the criteria advantage (benefit criteria) or cost criteria (cost criteria).
If Cj is the criteria benefit the greater the value, the better the criteria for the determination of alternatives. If Cj is the cost attribute the smaller the value, the better the criteria for the determination of alternatives.
3.Provide rating matches the value of each alternative on each criterion. 4.Determine the weight of preference or importance level (W) of each criterion.
W = [W1, W2, W3, ..., Wj]
5.Create a table rating the suitability of each alternative on each criterion.
6.Making a decision matrix (X), which is formed from a table rating the suitability of each alternative on each criterion. Value (X) each alternative (Ai) on each criterion (Cj) that have been determined, wherein, i = 1,2, ... m and j = 1,2, ... n. ܺ ൌ ܺଵଵܺଵଶ ڮ ܺଵ ڭ ڭ ܺଵܺଶ ڮ ܺ (1)
7.Normalizing the decision matrix by calculating values ternomalisasi performance rating (rij) of alternative Ai on the criteria Cj. ݎൌ ە ۔ ۓ ೕ ெ௫ሺೕሻ݂݆݅݅ݏܾ݂݁݊݁݅ݐܿݎ݅ݐ݁ݎ݅ܽ ெሺೕሻ ೕ ݂݆݅݅ݏܿݏݐܿݎ݅ݐ݁ݎ݅ܽ (2)
8.The results of the performance rating value ternomalisasi (rij) form a matrix of normalized (R).
ܴ ൌ
ݎଵଵݎଵଶ ڮ ݎଵ
ڭ ڭ
ݎଵݎଶ ڮ ݎ
(3)
9.The final result preference value (Vi) obtained from the sum of the multiplication element row normalized matrix (R) weighs the preferences (W) corresponding element column matrix (W).
ܸൌ σ ܹ
ୀଵ ݎ (4)
2.3.Geographic Information System
Geographic Information Systems (GIS) is a system designed to work with spatial data or geographic coordinates, or in other words, GIS is a database with special abilities in handling spatial data apart is a set of operations imposed on such data (Jeffrey & John, 1990).
3. Result and Discussions 3.1.General Description
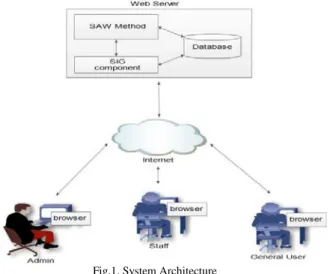
The system is built Flood-Prone Areas Mapping the city of Semarang using Simple Additive Weighting method as a method of calculation in determining the flood-prone areas. The web-based system that can be accessed by the community. The system provides geographic information on the map of Semarang containing the data of rainfall, drainage, land use, and topography and present maps flood-prone areas each recidences in Semarang city. In addition to the maps presented also comes with graph. Society can also use this system to obtain information on tips about the flood.
3.2.Perspektif System
The mapping system perspective Flood-Prone Areas presented with a picture of a system architecture that can be seen in Figure 1.
Fig.1. System Architecture
3.3.Entity Relationship Diagram (ERD)
Entity Relationship Diagram (ERD) is a diagram that is a portrait of the relationship between the entity set. ERD system built drawings can be seen in Figure 2.
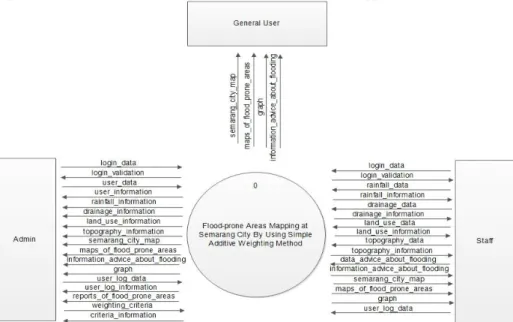
3.4.Context Diagram
Context diagram is a diagram illustrating an outline of the flow of information and data to be carried out by the system. There are three (3) external entities in the context diagram mapping system Flood Prone Areas include: 1.Administrator
Administrators have the authority to manage user data, and can view information about rainfall, topography, drainage, land use, and tips about flooding and can see the digital map of the flood prone areas. Administrators can also view user activity, download reports and view graphs.
2.Staff
The staff has a duty to manage the data into the criteria that data on rainfall, topography, drainage, and the usage land. These data will be stored in a database and processed by the system using Simple Additive Weighting method. In addition, the staff also insert data on tips about the flood. Staff have the right to see the information on the criteria used for the determination of the flood area with an additional interface in the form of maps showing flood-prone areas, graphs, calculation of SAW and can also view information on tips about the flood. To enter the system, administrators must login first.
3.General User
General users who visit the systems included in this outside entity. General users no need to login. Facilities provided that it can see the map of Semarang and their information, see the map prone to flooding along the graph, and tips about the flood. Context Diagram in Flood Prone Areas Mapping system is shown in Figure 3.
Fig. 3. Context Diagram
3.5.Digitized Maps
Digitization is the process of transforming an analog map data (paper maps) into digital format (digital map). Semarang city analog maps with digitized .png format using ArcView GIS 3.3. Results digitized maps generate a table that contains information about a feature in the city, which will be imported into the database.
3.6.Simple Additive Weighting Calculation 1.Determine alternative, namely Ai
Ai = 177 (the number of recidences in the city of Semarang) 2.Determine the criteria, ie Cj
Cj = 4 (rainfall, drainage, the usage of land, topography)
Criteria rainfall and land use are the criteria advantage (benefit) because the largest value is the best value while drainage and topography are the criteria of cost (cost) because the smallest value is the best value.
3.Provide rating matches the value of each alternative on each criterion
Suitability rating value is intended for giving value on each variable within each criteria.
Table 1. Table rating matches the value of each alternative on each criteria
Criteria Variables Value
Rain falls Very high (> 400 mm) 4 Height (301 – 400 mm) 3 Medium (101 – 300 mm) 2 Low (0 – 100 mm) 1
Drainage Accommodated 2
Not Accommodated 1
The Usage of Land
Swamps, Ponds, Park, Pasture 5 Yard, Building & Home Around, Others 4
Paddy Field 3
Plantation, Garden, Field 2
Forest 1 Topography > 40% 5 26 – 40% 4 16 – 25% 3 3 – 15% 2 0 – 2% 1
4.Determine the weight of preferences (W) of each criteria.
The weight given is based on these criteria influence tehadap flooding. The greater the influence of the flooding, the weight given will be higher.
W1 = Rainfall = 4; W2 = Drainage = 3; W3 = The usage of land = 2; W4 = Topography = 1
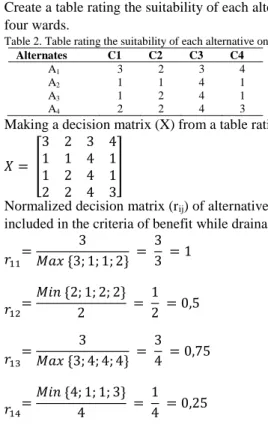
5.Create a table rating the suitability of each alternative on each criterion. In the table below given examples for the four wards.
Table 2. Table rating the suitability of each alternative on each criterion
Alternates C1 C2 C3 C4
A1 3 2 3 4
A2 1 1 4 1
A3 1 2 4 1
A4 2 2 4 3
6.Making a decision matrix (X) from a table rating the suitability of each alternative on each criterion
ܺ ൌ ൦ ͵ ʹ ͵ Ͷ ͳ ͳ Ͷ ͳ ͳ ʹ Ͷ ͳ ʹ ʹ Ͷ ͵ ൪
7.Normalized decision matrix (rij) of alternative Ai on the criteria Cj, to the criteria of precipitation and land use are included in the criteria of benefit while drainage and topography criteria are included in the cost criteria.
ݎଵଵ ൌ ͵ ܯܽݔሼ͵Ǣ ͳǢ ͳǢ ʹሽ ൌ ͵ ͵ ൌ ͳ ݎଵଶൌ ܯ݅݊ሼʹǢ ͳǢ ʹǢ ʹሽ ʹ ൌ ͳ ʹ ൌ Ͳǡͷ ݎଵଷൌ ͵ ܯܽݔሼ͵Ǣ ͶǢ ͶǢ Ͷሽ ൌ ͵ Ͷ ൌ Ͳǡͷ ݎଵସൌ ܯ݅݊ሼͶǢ ͳǢ ͳǢ ͵ሽ Ͷ ൌ ͳ Ͷ ൌ Ͳǡʹͷ
8. The results of the performance rating value normalized (rij) form a matrix of normalized (R). ܴ ൌ ൦ ͳ Ͳǡͷ Ͳǡͷ Ͳǡʹͷ Ͳǡ͵͵ ͳ ͳ ͳ Ͳǡ͵͵ Ͳǡͷ ͳ ͳ Ͳǡ Ͳǡͷ ͳ Ͳǡ͵͵ ൪
9. Calculate the value of preferences (Vi) obtained from the sum of the multiplication element row normalized matrix (R) weighs the preferences (W) corresponding column of the matrix element (W)
ܸଵൌ ሼሺͳݔͶሻ ሺͲǡͷݔ͵ሻ ሺͲǡͷݔʹሻ ሺͲǡʹͷݔͳሻሽ ൌ ǡʹͷ
ܸଶൌ ሼሺͲǡ͵͵ݔͶሻ ሺͳݔ͵ሻ ሺͳݔʹሻ ሺͳݔͳሻሽ ൌ ǡ͵͵
ܸଷൌ ሼሺͲǡ͵͵ݔͶሻ ሺͲǡͷݔ͵ሻ ሺͳݔʹሻ ሺͳݔͳሻሽ ൌ ͷǡͺ͵ ܸସൌ ሼሺͲǡݔͶሻ ሺͲǡͷݔ͵ሻ ሺͳݔʹሻ ሺͲǡ͵͵ݔͳሻሽ ൌ ǡͷ
10.Determine the class interval prone to flooding where many class = 4, using the formula:
݅݊ݐ݁ݎݒ݈݈ܽ݁݊݃ݐ݄ ൌ
ೌೣି
(5)
Where :
Vmax = maximum value of the Simple Additive weighting method Vmin = minimum value of the Simple Additive weighting method
݅݊ݐ݁ݎݒ݈݈ܽ݁݊݃ݐ݄ ൌ
ǡ͵͵ െ ͷǡͺ͵
Ͷ ൌ Ͳǡ͵ͷ
In order to obtain the limit values for each class that is prone to flooding:
6,955 < V ≤ 7, 33 = High flood-prone areas
6, 58 < V ≤ 6,955 = Mid-High flood-prone areas
6,205 < V ≤ 6, 58 = Medium flood-prone areas
5, 83 ≤ V ≤ 6,205 = Non flood-prone areas
Then it will be obtained recidences included in the classification of the level of vulnerability to flooding.
Table 3. Table final results classification level is prone to flooding
Residence Level
A1 High flood-prone areas
A2 High flood-prone areas
A3 Non flood-prone areas
A4 Medium flood-prone areas
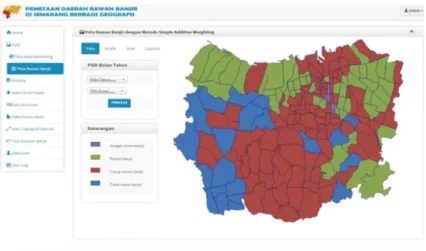
3.7.Implementation
Interface implementation is the result of the transformation interface design into a display in Flood Prone Areas Mapping system. The mapping system interface implementation Flood Prone Areas is :
Fig. 4. Implementation of Flood-Prone Map Page
3.8.Examination
In this test used black box testing techniques. Techniques used in black box testing, are: 1. Used to test specific functions of the software designed.
2. Real tested software only seen by the output generated from data or given input conditions for existing functions without seeing how the process of getting the output.
From the results of the mapping system testing flood-prone areas can be seen that this system has fulfilled: 1. Authentication and authorization login
2. Managing user data 3. Managing rainfall data 4. Managing drainage data 5. Managing topography data 6. Managing the used of land data 7. Managing weighting criteria 8. View the map of Semarang
9. Displays maps flood-prone areas of Semarang based on the calculation method Simple Additive weighting 10.Displaying a graph the number of flood-prone areas of Semarang
11.Print report flood-prone areas of Semarang 12.Manage tips about flooding
13.Manage user log data 4. Conclusions
The conclusion is the system used to map the type of local flooding that used the criteria which is analyzed as the reasons of local flooding, The criteria which is used are rainfall, drainage, the usage of land, and topography. The data is then processed using Simple Additive Weighting method. This system will display information about the level of flood-prones for each recidences in Semarang once a month. In addition in the form of maps, information or statements are also presented in tables and graphs. This system classifies the level of flood-prones with four classes of prones i.e. Non flood-prone areas (low level), medium flood-prone areas low level), flood-prone areas (mid-high level), and (mid-high flood-prone areas ((mid-high level).In this system uses its initial preference weights rain falls 4, drainage 3, the usage of land 2, and topography 1, wherein the weight value of these preferences can be changed by the admin.
References
BNPB, 2013. Indeks Resiko Bencana Indonesia. Sentul: Direktorat Pengurangan Risiko Bencana Deputi Bidang Pencegahan dan Kesiapsiagaan. Chang, K.-T., 2002. Introduction to geographic information systems. McGraw-Hill.
Chapin, F.S.J. & Kaiser, E.J., 1979. Urban Land Use Planning. 3rd ed. Urbana: University Of Illois Press.
Dewanto, W.K., Muslim, M.A. & Sunaryo, 2013. Rancang Bangun Model Potensi Banjir pada Jalan Arteri di Kota Malang Menggunakan Logika Fuzzy. Jurnal EECCIS, 7.
Handoko, 1993. Klimatologi Dasar. Jakarta: PT. Pustaka Jaya.
Jeffrey, S. & John, E., 1990. Geographic Information System: An Introduction. Prentice-Hall: Englewood Cliffs.
Kodoatie, R. & Sugiyanto, 2002. Banjir Beberapa Penyebab dan Metoda Pengendaliannya dalam Perspektif Lingkungan. Yogyakarta: Pustaka Belajar.
Kusrini, 2007. Konsep dan Aplikasi Sistem Pendukung Keputusan. Yogyakarta: Andi.
Kusumadewi, S., Hartati, S., Harjoko, A. & Wardoyo, R., 2006. Fuzzy Multy Attribute Decision Making (FUZZY MADM). Yogyakarta: Graha Ilmu.
Malczewski, J., 1999. GIS and Multicriteria Decision Analysis. illustrated ed. John Wiley & Sons. Matori, A.N. et al., 2014. Spatial Analytic Hierarchy Process Model for Flood. IOP Science, 20. Suripin, 2004. Sistem Drainase Perkotaan yang Berkelanjutan. Yogyakarta: Andi.
Syafri, S.H., Tilaar, & Sela, R.L.E., 2015. Identifikasi Kemiringan Lereng di Kawasan Pemukiman Kota Manado Berbasis SIG. Spasial, 1. Turban, E., Aronson, J.E. & Ling, T.-P., 2005. Decision Support System and Intelligent Systems. 7th ed. Yogyakarta: Andi