QoE Modeling for HTTP Adaptive Video
Streaming—A Survey and Open Challenges
NABAJEET BARMAN , (Member, IEEE), AND MARIA G. MARTINI , (Senior Member, IEEE) Wireless and Multimedia Networking Research Group, Faculty of Science, Engineering and Computing, School of Computer Science and Mathematics, Kingston University, London KT1 2EE, U.K.
Corresponding author: Maria Martini ([email protected])
This work was supported in part by the European Union’s Horizon 2020 Research and Innovation Programme under the Marie Skłodowska-Curie Grant Agreement 643072.
ABSTRACT With the recent increased usage of video services, the focus has recently shifted from the traditional quality of service-based video delivery to quality of experience (QoE)-based video delivery. Over the past 15 years, many video quality assessment metrics have been proposed with the goal to predict the video quality as perceived by the end user. HTTP adaptive streaming (HAS) has recently gained much attention and is currently used by the majority of video streaming services, such as Netflix and YouTube. HAS, using reliable transport protocols, such as TCP, does not suffer from image artifacts due to packet losses, which are common in traditional streaming technologies. Hence, the QoE models developed for other streaming technologies alone are not sufficient. Recently, many works have focused on developing QoE models targeting HAS-based applications. Also, the recently published ITU-T Recommendation series P.1203 proposes a parametric bitstream-based model for the quality assessment of progressive download and adaptive audiovisual streaming services over a reliable transport. The main contribution of this paper is to present a comprehensive overview of recent and currently undergoing works in the field of QoE modeling for HAS. The HAS QoE models, influence factors, and subjective test methodologies are discussed, as well as existing challenges and shortcomings. The survey can serve as a guideline for researchers interested in QoE modeling for HAS and also discusses possible future work.
INDEX TERMS HTTP adaptive streaming, QoE modeling, TCP, video quality assessment.
I. INTRODUCTION
The Cisco Visual Networking Index forecasts an increase of Internet traffic, with video alone being 82% of the net consumer Internet traffic by 2021 [1]. There has been a considerable amount of work on video delivery over the Internet to meet this increased demand. With the deployment of new wireless technologies such as 4G LTE-Advanced, the available end-user bandwidth has increased considerably over the recent years and it will further increase with 5G wireless systems. However, with the emerging video for-mats (e.g., Ultra High Definition (UHD), High Dynamic Range (HDR), Light Field) and new services such as Virtual Reality, Social-TV, Cloud Gaming, the available network technology will not be able to meet the increased demand for high bandwidth for all the users and to satisfy users’ expectations for any content, any place, any time. The new The associate editor coordinating the review of this manuscript and approving it for publication was Martin Reisslein.
video formats such as 4K and HDR result in files of enor-mous size and hence call for modern video compression standards. The effort in this direction resulted in the recently introduced new video compression standard H.265/MPEG-HEVC, which on an average, for the tested sequences, is shown to achieve 50% higher compression efficiency than its predecessor H.264/MPEG-AVC [2]–[4]. VP9, a royalty-free encoder developed by Google as a competitor of the H.265/HEVC encoder, has gained much popularity and is supported by almost all browsers except for Safari. Licensing issues with H.265/HEVC and the aim to develop a more futuristic royalty-free video codec led to the creation of a consortium of industry partners called Alliance for Open Media (AOM).1 The joint efforts of the members of AOM have since then drove to the development of the AV1 codec2 with the final bitstream specification frozen in early 2018.
1http://aomedia.org/
2https://aomedia.googlesource.com/aom/
VOLUME 7, 2019
2169-3536 2019 IEEE. Translations and content mining are permitted for academic research only.
Recent studies comparing the performance of AV1 with x265, x264 and libvpx considering on-demand adaptive streaming applications have found it to result in the highest bitrate savings but at the cost of huge encoding times [5], [6]. The applicability of such encoders for live streaming applications remains an open question.
The advancements in the field of video streaming have recently resulted in the rise of both Video-On-Demand (VOD) (YouTube, Netflix, Amazon Video, Hulu, etc.) and Live (Twitch.Tv, YouTubeGaming) streaming services. As evident, video streaming is not a niche market anymore, and there exist a wide range of options for the consumers to choose from. Hence, as a service provider, it is no more sufficient just to provide a service, but it is equally important to make sure that the needs and expectations of the end user of the offered services are met. This has led to the shift from traditional technical Quality of Service (QoS) based assessment (see, e.g., [7]) to Quality of Experience (QoE) based assessment (see, e.g., [8], [9]).
To correctly determine the end user QoE and subsequently move towards QoE based control and management, there exists a need for the development of reliable and accurate QoE models. Such models usually take into account various network and application level factors (including several QoS factors) and aim at predicting the QoE as experienced by the end user.
Having established the importance of QoE modeling and considering that HTTP Adaptive Streaming (HAS) is the pre-ferred video streaming technology, we present in this paper a review of existing QoE models for HAS applications. While there exist previous surveys, such as by Seufertet al.[10], which discuss HAS and related influence factors, and by Juluri et al.[11], which discuss tools and measurement methodologies for predicting QoE of online video streaming services, a survey of QoE models for HAS applications is still missing. Towards this end we present in this paper a review of the proposed QoE models for HAS applications. The major objectives of this review are:
• To classify the existing models and provide the reader with an overview of different works so far in the field of QoE modeling for HAS applications (SectionV).
• To identify the different influence factors as considered by the model proponents and discuss their impact on the model design and performance (SectionVI).
• To present the different subjective test methodologies used for model design and validation. We discuss how such information can favor reproducible research and steer the development of models valid in different set-tings and conditions (SectionVII).
• To present a list of publicly available open source datasets for HAS QoE model design and/or validation (SectionVIII).
• To identify existing research gaps and provide a set of recommendations for future model design and validation (SectionIX).
The rest of this paper is organized as follows. We start with a brief introduction to QoE, QoE assessment methodologies and the various influence factors which need to be taken into account for QoE model design in SectionII. In Section III we discuss QoE modeling and how QoE models can be classified based on the type of input information they require. Then we briefly introduce in SectionIVthe HAS technology. SectionVreviews the existing work in the field of HAS eling and provides a detailed discussion of the proposed mod-els. In SectionVIa detailed discussion on the effect of various influence factors is presented and in SectionVIIsubjective test methodologies as used for model validation and/or testing by the model proponents is discussed along with their impor-tance, advantage and shortcomings. SectionVIIIpresents a discussion on publicly available HAS based datasets which can act as a valuable resource for model design and validation by future researchers. Finally, in SectionIXwe summarize our observations and findings and point out some existing gaps and challenges for future work.
II. QoE: DEFINITION AND ASSESSMENT METHODOLOGIES
A. QoE DEFINITION
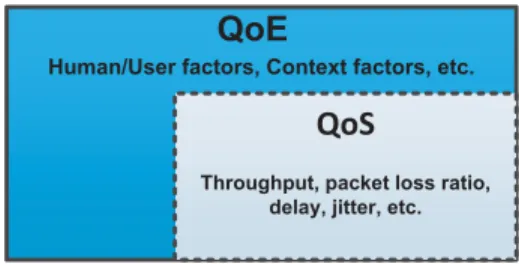
The EU Qualinet community (COST Action IC1003: ‘‘Euro-pean Network on Quality of Experience in Multimedia Sys-tems and Services’’) defines QoE as: ‘‘QoE is the degree of delight or annoyance of the user of an application or service. It results from the fulfillment of his or her expectations with respect to the utility and/or enjoyment of the application or service in the light of the user’s personality and current state’’ [12], [13]. QoE takes into account the end user’s expe-rience and level of satisfaction and is of much interest to both academic and industrial players in the field of multimedia. Understanding the end users’ expectations and experience is paramount to the development of future services as well as improvement of the existing technologies and services. While traditionally QoS has been used to measure the effectiveness of a service, it fails to take into account end user related factors (user expectation, environmental factors, etc.). Also, QoS is limited to telecommunication services and relies only on technical measurements. QoE on the other hand covers domains beyond telecommunications and is multidisciplinary in nature, including domains such as psychology, business, technical, environmental, etc. Figure1illustrates the encap-sulation of QoS and QoE.
B. QoE ASSESSMENT
ITU-T Recommendation P.10/G.100 Amendment 5 defines QoE assessment as the process of measuring or estimating the QoE for a set of users of an application or a service with a dedicated procedure, and considering the influencing factors (possibly controlled, measured, or simply collected and reported) [13]. The main objective of QoE assessment is the design of a system which can identify the various factors and their influence on the end user QoE. Such information can then be used by the various stakeholders for optimization along the process of service delivery (encoding pipeline, load balancing, resource allocation, etc.) to provide a reasonable QoE to the end user while making optimized usage of the available resources. Lossy compression is usually required for multimedia data which need to be transported over the Internet, to decrease the required bandwidth and transport costs. During lossy compression, information is lost, with higher compression ratios resulting in a higher amount of information loss. Also, in traditional streaming technologies, transmission errors such as jitter, delay, packet loss, etc., lead to further artifacts which are annoying to the end user. Since it is almost impossible for most practical applications to provide a service without any artifact, a proper QoE model/metric can help quantifying the amount and kind of distortions and the magnitude of their effect on the end user QoE, which can then lead to the design of proper strategies to help overcoming such artifacts.
C. VIDEO QUALITY ASSESSMENT (VQA) METHODOLOGIES
VQA approaches can be categorized into two main cate-gories: objective and subjective. Objective VQA methods are mathematical models that aim at providing a quality score which closely resembles the perceived image/video quality. Subjective VQA, on the other hand, tries to take into account the user feedback in the form of ratings and targets to estimate the video quality as perceived by the end user.
Subjective assessment scores are typically reported as Mean Opinion Score (MOS) which is the average of the opin-ion scores collected from the assessors. For repeatability and validation purpose, common guidelines for conducting sub-jective tests are issued in ITU-T Rec BT.500 and ITU-T Rec P.910 [14], [15]. These recommendations include a detailed description of the test settings, methodology and procedures that need to be followed, including data processing guide-lines, such as outlier detection, etc.
The common approach to evaluate an objective quality metric’s performance is to calculate the correlation coeffi-cients and MSE values between the MOS scores estimated via the objective VQA metrics and the actual MOS scores from subjective assessment, for the same set of test sequences.
Both objective and subjective VQA approaches have inher-ent drawbacks. While subjective VQA provides information on the actual quality experienced by the users, it is not suitable for real-world applications. Also, conducting sub-jective tests incurs costs and time, and only a small number
of influence factors can be evaluated due to constraints in test duration and assessors. Objective VQA using metrics such as Peak Signal to Noise Ratio (PSNR) and Structural Similarity (SSIM) index, while fast and comparatively easier to implement, do not always correlate well with the end user quality [16], [17]. For two videos of different (perceivable) quality, the objective metric may provide a similar score and hence does not necessarily reflect the end user’s perceived quality. Also, many objective metrics require the source sequences, which is not practical in most of the real-world quality estimation scenarios.
Quality metrics such as PSNR and SSIM were initially developed and used for Image Quality Assessment (IQA). For Video Quality Assessment (VQA), they are calculated on a frame-by-frame basis and then the final score is reported as the average of the individual scores over the full duration of the video sequence. There also exist different pooling meth-ods to combine the scores such as Minkowski summation, exponential weighting, etc. A discussion of temporal pooling strategies is out of the scope of this paper and interested readers can refer to [18] for an interesting comparison of the pooling mechanisms and their performance in HAS applica-tions.
Traditional models used for VQA, such as PSNR, SSIM, VQM [19], etc., are not designed for long-term quality pre-dictions. Also, most of the traditional objective VQA metrics were designed for quality estimation of impairments due to compression and/or due to packet losses etc., during the trans-mission process. They do not take into account impairments such as rebuffering, quality switches etc., which are present in HAS applications. Therefore, new approaches for QoE estimation model design are required for HAS applications which take into account IFs such as rebuffering and quality switching along with impairments due to lossy encoding.
D. QoE INFLUENCE FACTORS
A QoE influence factor is ‘‘any characteristic of a user, sys-tem, service, application, or context whose actual state or set-ting may have an influence on the Quality of Experience for the user’’ [12]. As defined in ITU-T Rec. P.10/G.100 Amend-ment 5, QoE influence factors include the type and char-acteristics of the application or service, context of use, the user’s expectations with respect to the application or service and their fulfillment, the user’s cultural background, socio-economic issues, psychological profiles, emotional state of the user, and other factors whose number will likely expand with further research [13]. Influence factors on QoE can be grouped into the following four categories as described by Skorin-Kapov and Varela [20].
1) SYSTEM IFs
System IFs mostly consist of the technical aspects of quality, for example, the ones which can be measured using QoS based measurement approaches. They cover a wide range of aspects such as media related (quality switching events), net-work related (wired/wireless/mobile, bandwidth, delay, jitter, 30833
packet loss, etc., resulting in impairments such as tempo-ral interruptions/pauses) or end-user device related (display resolution, playback capabilities such as supported codecs, formats, etc.).
2) HUMAN IFs
Human or User IFs include aspects which refer to the infor-mation about the end-user and related aspects. These include individual characteristics of a user such as expectations from the service, memory and recency effects, usage history of the application (e.g., browsing history, frequently played video), demographic and socio-economic background, physical and mental constitution (users’ emotional state), memory, catego-rization and attention among many others.
3) CONTEXT IFs
Context IFs deal with factors such as location, end user envi-ronment (viewing envienvi-ronment, acoustic conditions, etc.), time of the day, type of usage (e.g., just casual browsing, newly released episode of favorite TV show), time of service consumption (peak time, offload time, etc.)
4) CONTENT IFs
One of the most important is the content IFs which addresses the characteristics of the content. The aspects in this cat-egory include information about the content being offered by the service/application under consideration. For example, for video, the content level IFs are duration, video type and content complexity (spatial and temporal complexity).
III. QoE MODELING
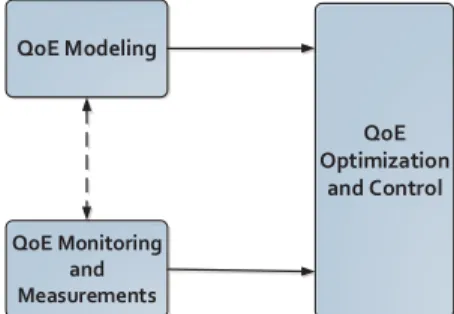
Managing Quality of Experience (QoE) in a communica-tion system is a complex task, primarily consisting of three steps, as shown in Figure2and discussed in [21] and [22]. A key step in QoE management is the design of QoE mod-els. ITU-T Recommendation P.1201 defines a QoE model as ‘‘An algorithm with the purpose of estimating the sub-jective (perceived) quality of a media sequence’’ [8]. QoE models take into account various influence factors and try to estimate the end user QoE. QoE monitoring and measure-ment(s) can be done by any stakeholder and the parameters measured will depend on the application and the interests of the stakeholder [23], [24]. The final step in QoE management
FIGURE 2. QoE management process.
includes QoE optimization and control, typically performed based on models or measurements. Again, the optimization process and the parameters controlled will depend on the stakeholder and the application type. In this paper, we limit our discussion to the first step, focusing on QoE Modeling for HAS applications using reliable transport protocols such as TCP or Quick UDP Internet Connections (QUIC) [25].
A. IMPORTANCE OF QoE MODELING FOR DIFFERENT STAKEHOLDERS
QoE modeling is one of the critical steps in the QoE man-agement process chain, as the performance of the QoE model will decide the reliability and accuracy of the next steps along QoE based management. We discuss next the importance of QoE modeling from the point of view of various stakeholders in the multimedia streaming process chain.
1) NETWORK PROVIDER
With increasing demand for OTT services, both VOD and live, there is a tremendous pressure on the network operators to provide seamless connectivity and high QoE to the end users. QoE models can help network operators identifying the various IFs and their respective impact on the end user QoE and hence allow the network operators to take necessary actions (resource allocation such as network throttling, load balancing, caching and network provisioning) to prevent user churn.
2) SERVICE PROVIDER
In today’s highly competitive environment with almost simi-lar pricing schemes, the service provider cannot rely on profit generation based solely on the provision of a service, but should also take into account different factors which may shift the user base to the competitors. For example, for a service provider measurable QoE factors such as viewing duration are of huge interest [26]. For advertisement based services, longer viewing duration implies more advertisement. On the other hand, for subscription based services, shift of even a smaller percentage of viewer base can result in significant effect on revenues. One of the disadvantages of HAS services is the requirement of additional storage space, as multiple copies of the same file are stored in the server. In such cases, optimized encoding bitrates can lead to huge storage space savings for the OTT provider while also reducing the demand for required bandwidth. Hence, proper QoE models can pro-vide an insight into the IFs and their impact on the service, and in turn allow the service provider to take appropriate decisions/measures to ensure high end user QoE.
3) DEVICE MANUFACTURER
Nowadays, most of the device manufacturers, such as Sam-sung, LG, Sony, etc., are involved in manufacturing of both small screen devices (mobiles, tablets) and big screen devices (PC/TV). Different devices have different capabilities and the perceived quality depends on various factors, one of which is the device screen size. Also, small screen devices have
different processing capabilities compared to large screen devices. Hence, good QoE models can provide insight to the device manufacturers, considering the device features (dis-play size, dis(dis-play resolution, CPU, ram, etc.), on what settings to use such that the QoE of the end user can be maximized. Also, media-layer models (see SectionIII-C.1) can be used for codec comparison and hence allow device manufacturers to provide optimized encoding and decoding support so as to support the latest codecs in the shortest possible time. Many device manufacturers are also interested in QoE modeling for production of QoE monitoring solutions such as probes, QoE estimation modules etc.
4) END USER
In the end, the user is the king or queen. The success of a service will depend on the acceptance of the same by users. As mentioned in [22], successful QoE management will lead to satisfied end users as their requirements and/or expectations will be met and hence they may be further open to adopt new and complex services, leading to growth of more advanced technologies.
To summarize, QoE modeling can help us identify the various Key Performance Indicators (KPIs). The actual appli-cability and performance of the model will vary depending on the stakeholder as different actors involved will focus on dif-ferent aspects (mostly the ones they can control). For exam-ple, in the case of HAS, a network provider may be interested in rebuffering, quality switches, etc. and their corresponding effect on QoE as they are directly or indirectly related to the network QoS parameters such as delay, jitter, packet loss, etc. A content provider may be interested more in the effect of average bitrate, segment size, video popularity, etc., for example, to save storage costs, optimized video caching, etc. At the application layer, the service provider may be interested in IFs such as adaptation frequency, adaptation magnitude, etc. to take these into account for the design of the client’s adaptation algorithm.
B. QoE MODEL PERFORMANCE EVALUATION
The criteria for the evaluation of the performance of an objective QoE model, as mentioned initially in Video Quality Experts Group (VQEG) FRTV Phase I and later in VQEG FRTV Phase II [27], [28], are:
• Prediction AccuracyIt refers to the ability of a model to predict the subjective rating scores with low error. The accuracy of the QoE model will affect the applicability and effectiveness of the QoE management process. • Prediction Monotonicity It refers to the degree of
model’s prediction agreement with the relative magni-tudes of the subjective rating scores.
• Prediction ConsistencyIt refers to the ability of a model to maintain prediction accuracy over a wide range of test sequences with a variety of video impairments.
The prediction accuracy of a model can be evaluated by using the Pearson Linear Correlation Coefficient (PLCC) between the predicted and actual subjective rating scores. Similarly,
the prediction monotonicity of a model can be evaluated using the Spearman’s Rank Correlation Coefficient (SROCC) between the predicted and actual subjective rating scores. Finally, the prediction consistency of the model can be eval-uated using measurements such as the Outlier Ratio (OR). A low OR value indicates a high consistency of prediction, withOR=0 implying that the model will be stable to predict the QoE. A good QoE model should provide insight on how the IFs affect the QoE of the end user. Such insight can help various stakeholders in a more efficient and optimized system design.
C. QoE MODEL CLASSIFICATION
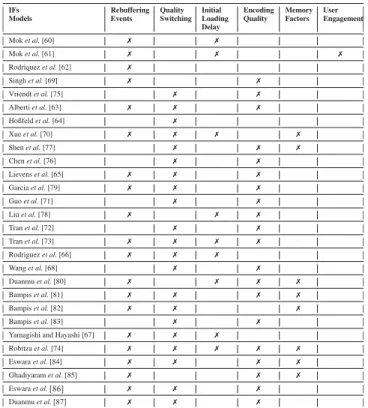
Depending on the application area or range of system or service the model applies to, there exist many ways to classify models such as based on model input parameters, application scope, measurement scope, etc. [22]. While there exist many approaches for classification of models, we use the approach presented by Takahashi et al.[29], similar to the one pre-sented by Raakeet al.[30] as shown in Figure3.
FIGURE 3. QoE model classification for streaming applications (adapted based on input from [30]).
1) SIGNAL-BASED MODELS
Signal-based models, also known as pixel-based models or media-layer models, utilize the decoded audio/video signal to estimate the video quality. Since such models do not use any codec specific information, they are widely used in codec comparison and optimization of unknown systems.
Based on the relationship between the input and output of the system, i.e., depending on the amount of source (refer-ence) information required, VQA metrics can be classified as Full Reference (FR), Reduced Reference (RR) and No Reference (NR).
(a) FR:As the name suggests, FR metrics require the avail-ability of full information of the source video. They are computed based on a frame-by-frame comparison between the reference and the distorted image/video. The source video should be available in pristine qual-ity (unimpaired and uncompressed) so that there can be a direct comparison (e.g., pixel by pixel) between 30835
the reference and distorted image/video. Due to the availability of full source information, these metrics are usually more accurate than their counterpart (RR or NR metrics) but as such are not suitable for most real-world applications. Some of the most widely used quality metrics in the field of image and VQA are FR metrics such as MSE, PSNR and SSIM [16] and ITU-T Recommendations [31]–[33].
(b) RR:RR metrics have access to limited source informa-tion. Due to partial source information, they are usually less accurate than the FR metrics. Some of the RR metrics are [34]–[41].
(c) NR: No reference quality metrics do no use any source/reference information and try to predict the quality based on the received signal. Commonly used NR metrics include DIIVINE, BRISQUE, BLIINDS and NIQE [42]–[45]. In the absence of source informa-tion, such metrics are usually less accurate than their counterparts, FR and RR metrics.
2) PARAMETRIC MODELS
Parametric models use measured or expected packet/network related parameters to estimate the quality. These can be fur-ther classified in packet-layer models and planning models, described below.
(a) Packet-layer models: Parametric packet-layer mod-els utilize only information that can be extracted from packet headers, such as bitrate, packet loss rate (PLR), frame rate, frame type, etc., and no media sig-nal information is required. Such models are hence non-intrusive in nature and are easily deployable and computationally very inexpensive (e.g., ITU-T Rec. P.564 for speech and ITU-T Rec. P.NAMS [8], [46]). Due to the absence of any payload information, such models are not suitable for individual QoE monitoring solutions such as determination of effect of content dependence on end-user QoE.
(a) Planning Models:Unlike other models, planning mod-els do not require input information from an existing service. Such models estimate the quality based on the quality planning information available during the plan-ning phase from the networks and terminals. Informa-tion such as expected bitrate, PLR, codec type, etc. are used as input in this kind of models. Such model type includes some of the most widely used model in the field of videophone services (ITU-T Rec. G.1070 [47]), E-model (ITU-T Rec. G.107, widely used network tool for public switched telephone network (PSTN) and Voice over Internet Protocol (VoIP) [48]) and for video and audio streaming applications [49].
3) BITSTREAM MODELS
Bitstream models take into account the encoded bitstream and packet layer information. Features such as bitrate, frame rate, Quantization Parameter (QP), PLR, motion vector, mac-roblock size (MBS), DCT coefficients, etc. are extracted and
used as input to the model. Such models are also relatively computationally inexpensive and can be used for real-time QoE monitoring. Bitstream based models have recently found application in the field of multimedia streaming services such as ITU-T Rec. P.1202, with ITU-T Rec. P.1203 being the most recently approved recommendation for adaptive audio-visual streaming services over reliable transport [9]. While bitstream based models show comparatively higher corre-lation with subjective quality scores, they suffer from the drawback that they are suitable for a specific codec. Bitstream models which can minimize their performance reliance on codec specific parameters such as size of MB, motion vec-tor size, etc. will prove to be more useful and find wider acceptance.
4) HYBRID MODELS
Hybrid models are usually the most effective ones as they combine two or more of the previously described models and hence can use much more information as input compared to any of the standalone models discussed previously.
IV. HTTP ADAPTIVE VIDEO STREAMING
In this paper we focus exclusively on HTTP Adaptive Stream-ing (HAS) applications usStream-ing reliable delivery mechanisms such as TCP and QUIC. Reliable transport protocols such as TCP make sure that all data will be delivered correctly to the destination process without any errors. This is usually achieved by a connection oriented approach between the sender and the receiver with the receiver acknowledging the receipt of packets and retransmission of lost or erroneous packets. Some of the most widely used implementations of HAS include:
• Adobe HTTP Dynamic Streaming (HDS) [50] • Apple HTTP Live Streaming (HLS) [51] • Microsoft Smooth Streaming [52]
• Dynamic Adaptive Streaming over HTTP (DASH) [53]. The first three are proprietary and vendor specific HAS implementations while DASH, also commonly known as MPEG-DASH, is an open source international standard developed by MPEG [54]. The underlying logic is common in all these implementations with some differences in the manifest file, recommended segment size, etc.
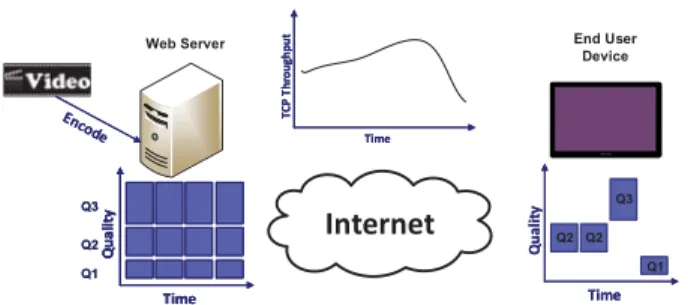
A. CONCEPT OVERVIEW
Figure 4 illustrates the basic concept behind HAS appli-cations. The video file is encoded at different representa-tion levels (spatial/temporal/quality, see Secrepresenta-tionIV-B) and then divided into chunks (also referred to as segments) of equal durations (often 2, 4 or 10 seconds, but depends on the standard/implementation) which are then stored on a server. The reverse process of first segmenting and then encoding can also be used, as currently done by most of the Over-the-top (OTT) providers to speed up the encoding process. When a first request for the video file is made by the client, the server sends the corresponding manifest file (e.g., .mpd for DASH, .m3u8 for HLS) which consists of the
FIGURE 4. HAS Schematic (Q3, Q2 and Q1 denote high, medium and low quality level respectively).
details about the video file such as video duration, segment size, available representation levels, codec, etc. The client then requests for video chunks based on its rate adapta-tion logic. The client’s rate adaptaadapta-tion logic can be broadly categorized into throughput-based, buffer-based and hybrid approach. For a comprehensive survey of the rate adaptation methods for HAS, we refer the readers to the survey paper of Kuaet al.[55]. Figure4illustrates the concept of streaming assuming a throughput-based rate adaptation method. It can be observed that the client, based on its network condition, adapts the quality of the video to provide a smooth streaming experience to the end user.
B. QUALITY SWITCHING DIMENSIONS
Videos can be encoded at different bitrates (quality levels) by adjusting any/two/all of the following parameters: spatial resolution, frame rate and QP. A bitrate decrease usually indi-cates lower quality but the reverse does not necessarily holds true, i.e., increasing the bitrate after a certain threshold (which depends on the video content type) does not necessarily result in higher (perceived) quality videos. Figure5illustrates the adaptation dimensions for video encoding, described in the following:
1) Spatial Adaptation: The videos are encoded at different resolutions, hence decreasing the number of pixels in the vertical and/or horizontal dimensions.
2) Temporal Adaptation: The temporal resolution of the video is decreased by dropping some of the frames, i.e., encoding a lower number of frames per second, hence reducing the encoded bitrate.
3) Compression Quality Adaptation (Switching): Increas-ing (decreasIncreas-ing) QP values results in an allocation
FIGURE 5. Video quality switching dimensions.
of less (more) bits per pixel, hence resulting in lower (higher) bitrate values.
The actual dimensions of adaptation will depend on the application type and also on the content type. For most content types, compression based quality is considered the most important dimension. For similar bitrate values, spa-tial resolution reduction is perceived better than frame rate reduction (the actual impact of upscaling depends on the specific player used for video playback at the end user device), hence resolution is one of the most widely used adaptation dimensions [56]. For smaller screen sized devices such as mobile, tablets, etc., spatial resolution plays an impor-tant role in QoE. In general, in HAS, adaptation in multi-ple dimensions is perceived better than a single dimension adaptation [57] and hence is widely used by major OTT providers.
HAS is one of the most popular streaming technologies for video delivery over the Internet, currently used by the primary OTT providers such as Netflix and YouTube, with both together consisting of more than 50% of the total peak Internet traffic for fixed access networks in North America and Latin America [58]. The success of HAS can be attributed to the following advantages it offers over traditional stream-ing technologies:
1) Scalability: Since HTTP based progressive download solutions already existed, no special streaming server infrastructure is required allowing for the reuse of exist-ing infrastructure.
2) Reliability: HAS uses reliable transport protocols (mostly TCP, recently QUIC) with guaranteed packet delivery and congestion control mechanisms. Hence network impairments such as packet loss do not cause any artifacts such as blurring, motion jerkiness, etc., as the lost/corrupted packets are retransmitted. 3) Runs natively over HTTP: HAS uses HTTP, which is
firewall friendly and avoids Network Address Transla-tion (NAT), leading to easier access to HAS services to the end users.
4) Stateless protocol: In HAS, the server does not store any information related to the client and/or the requests. This is useful from a network point of view (e.g., load balancing) as now each request is treated individually, hence can be handled by any of the servers, without keeping track of which server is serving which request. Some of the challenges in the implementation of HAS include:
1) Increased overhead: In general, for a good streaming performance, TCP throughput of approximately twice of the video bitrate is required, which points to a major drawback of HAS applications [59].
2) Increased storage and encoding costs: Due to the creation of multiple quality representations for the same video/audio content, HAS solutions need much higher storage requirements compared to other tradi-tional streaming solutions. While the costs of storage have considerably decreased over the recent years, new 30837
video formats such as 4k and HDR results in huge file sizes. Hence, the high storage costs are still a concern for OTT providers, especially because a typical OTT provider includes millions of video contents.
3) Quality switching: The rate adaptation algorithm switches video quality depending on the network con-dition and/or buffer status. While quality switching is an important feature of HAS which helps in minimizing the number of stalling events, frequent quality switch-ing might result in increased user annoyance.
4) Live streaming: During the initial years, HAS was exclusively used for VOD/Offline streaming applica-tions. While many services currently use HAS for real-time applications, encoding videos in multiple rep-resentations in real-time remains a big challenge. 5) Full segment download: For most of the HAS
applica-tions, full segment download is required before play-back of the segment can start. Such requirement can lead to increased cases of stalling events during video playback.
V. HAS QoE MODELING
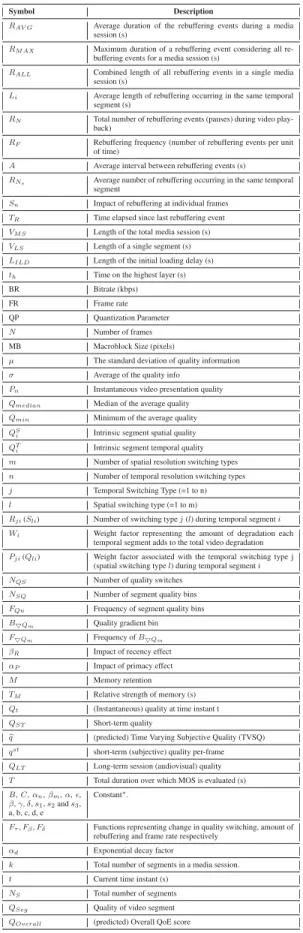
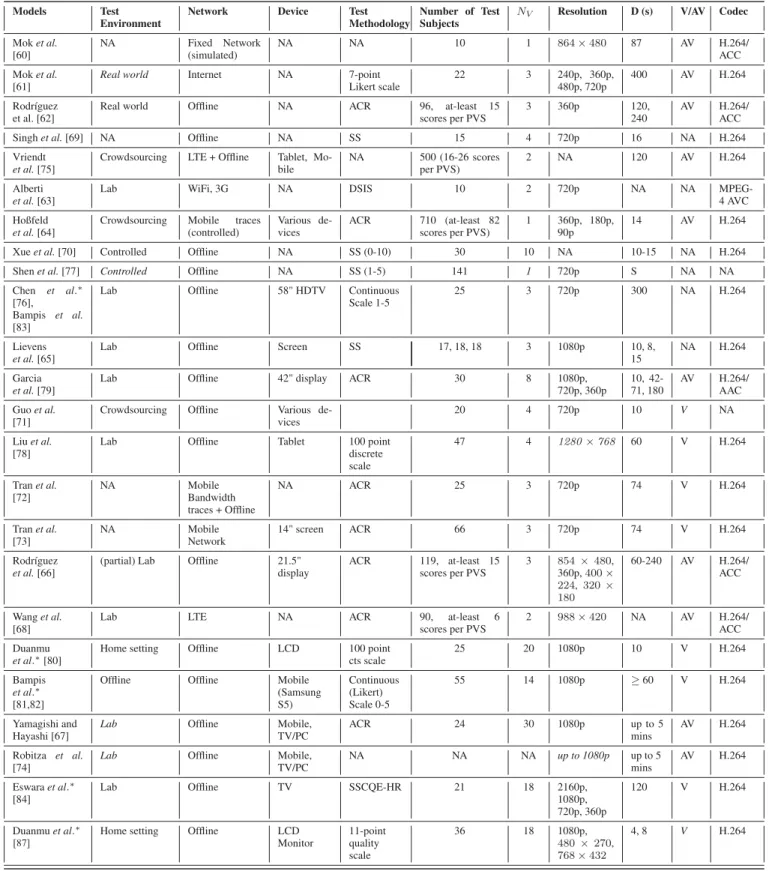
In this section, we review the work related to models which predict the subjective quality (e.g., MOS) for HAS applica-tions. Table2presents a comprehensive overview of all the models (26 models in total) reviewed in this work. The mod-els are classified into three categories depending on their type. The table describes the various IFs considered by the models, along with the modeling method and the main observations as reported by the model proponents. It is important to note that in this review we limit the scope only to models proposed for HAS applications. For a more generic overview of models for QoE prediction, we refer the reader to the survey paper by Juluriet al.[11].
We start in Section V-Awith a discussion of definitions and terminology along with a common set of symbols so as to have a more comprehensive understanding of the models discussed later in Section V-B. The models are presented and discussed based on their classification as described in Table2.
A. SYMBOLS AND TERMINOLOGY
We introduce here the terminology we use for the description of the models: for simplicity and easier comparison of the models later, our goal is to use consistent terminology and symbols for all the models described.
• Media Session: Media session indicates video/ audiovisual playback from the start till the end of the video and includes the effects of initial loading delay, rebuffering events and quality switching if any. Hence, in the presence of any of these events, the media session length will be longer than that of total video/audiovisual playback length.
• Rebuffering: Rebuffering refers to the event when there is no data in buffer, hence video playback is stalled
(frame freezing occurs). Such events in video streaming are usually represented by a loading sign or a spinning wheel, or sometimes just the current frozen frame, and occur because of the video packets arriving late. • Total duration of rebuffering: It refers to the combined
length of all rebuffering events in a single media session. • Frequency of rebuffering: Frequency of rebuffering refers to the number of rebuffering events per unit of time.
• Temporal location of rebuffering: Temporal location of rebuffering indicates the time instant when a rebuffering event starts.
• Quality switching: Quality switching, also referred to as rate adaptation or quality adaptation, refers to the change of quality over the duration of the media playback.
• Quality switching frequency: It refers to the rate of change of the quality during the media playback. • Quality switching magnitude: It refers to the ‘‘gap’’
between the levels of quality switching.
• Down-switching: Quality switching from a higher qual-ity level to a lower qualqual-ity level.
• Up-switching: Quality switching from a lower quality level to a higher quality level.
• Time on the highest layer: Time on the highest layer indicates the percentage of time the media playback is at the highest quality.
• Initial Loading Delay: Also known as initial buffering, initial loading delay is the time duration between the request for video playback by the client and the actual start of the video playback.
• Encoding Quality: It refers to the quality of the com-pressed video/audio sequence due to loss of data follow-ing the encodfollow-ing process. This is typically expressed in terms of an objective quality metric (e.g., PSNR, SSIM, VMAF). Some authors characterize the encoding quality in terms of bit-rate or QP value.
• Primacy and Recency Effects: The psychological phe-nomena according to which experiences which occurred recently (recency), and experiences that occurred at the very start of the session (primacy) affect more the expe-rience quality.
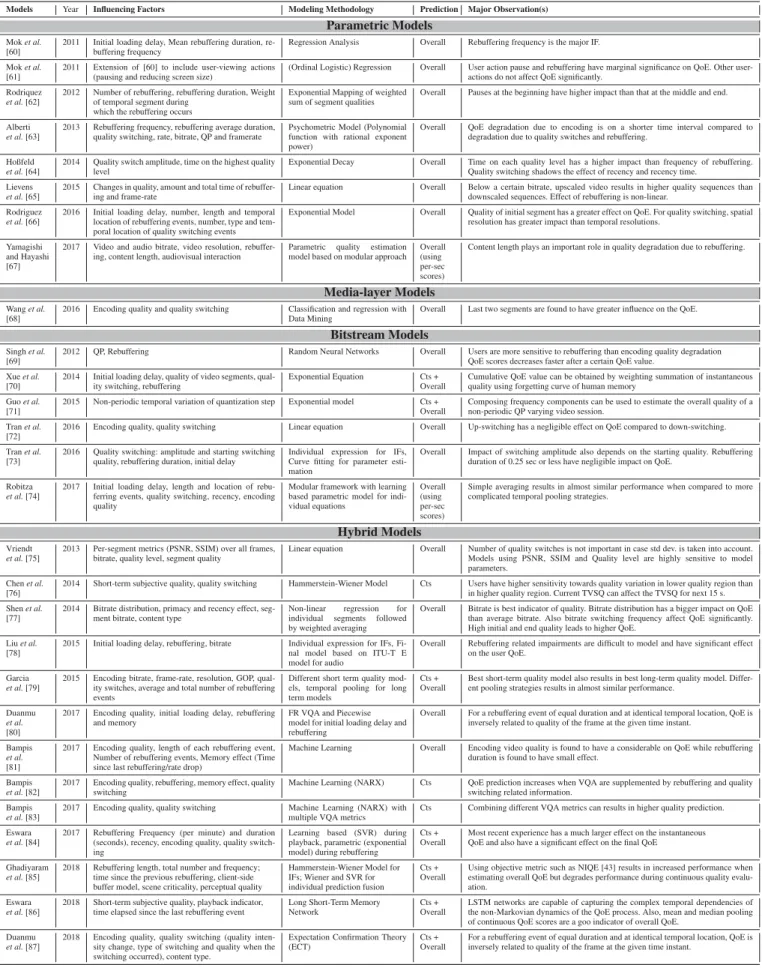
Table1describes the parameters and corresponding sym-bols used in this review. In addition we useIQS,IILD&IRB
to denote the impairment due to quality switching, initial loading delay and rebuffering respectively.3
B. HAS QoE MODELS
Here we present and discuss the QoE models in detail. We start with a discussion of the proposed parametric models, followed by a discussion of bitstream and hybrid mod-els. We classify the models based on the discussion in SectionIII-C.
3I
ILD,IRBandIQSrefer only to the respective type of impairment and not necessarily to how they are actually calculated
TABLE 1. Summary of symbols used in this review. 1) PARAMETRIC MODELS
One of the earliest works towards building a QoE model for HAS applications was presented by Mok et al.[60]. This model quantifies QoE for HAS applications using network and application layer QoS parameters. Based on analytical models, empirical evaluation, and (subsequent) subjective tests, Moket al.quantified the predicted MOS as a simple equation as:
MOS =4.23−0.0672Lti−0.742Lfr−0.106Ltr (1)
whereLti,LfrandLtrare the levels (1, 2 or 3 corresponding to
low, medium and high levels) of initial loading delay (LILD),
rebuffering frequency (RN) and rebuffering duration (RAVG)
respectively. The rebuffering frequency is found to be the main IF. While this work has the advantage of proposing a simple linear equation mapping application QoS metrics to QoE, the subjective assessment used to perform the regres-sion analysis to obtain the proposed model was limited to only a single video (single content type) rated by 10 users and limited to a single resolution, which is not realistic for most HAS applications. An evaluation of the proposed model on a subjective database of new data is missing. Also, the work assumes constant network bandwidth, Round Trip Time (RTT) and Packet Loss Rate (PLR), which is not always true for the real networks and also leaves out one of the major IFs of HAS: quality switching. The authors conducted further studies to correlate QoE with network QoS, and it is observed that the rebuffering frequency increases due to decreased network throughput by packet loss and RTT. One of the major advantages of this model is the fact that content-related information is not used, hence the model can be used for encrypted traffic quality estimation by stakeholders such as network provider of third-party OTTs.
An extended version of this model is presented in [61] which takes into account user actions such as pausing and forward/backwards seeking, leading to a better model fit and an increase in its explanatory power. Video impairments may lead to various user reactions such as pausing the video, resizing, etc. and hence such factors need to be considered in the model design for a more realistic QoE model. Among all the models reviewed in this paper, this is the only work which considers user action. Based on the model, it is found that while some user actions such as pause show a marginal effect on the final QoE, other user actions such as switching the screen size have no significant impact on the final QoE score. While the proposed model is an improvement over the previous model [60] taking into account more content types, more test subjects and multiple resolutions, it is still limited by the network parameters taken into consideration and also does not take into account quality switching related impairments. Also, the performance evaluation of the model is missing.
Rodríguezet al.[62] model the effect of location of pauses depending on their position in the video. They propose video
Streaming Quality Metrics (VsQM) as: VsQM = k i=1 RNLiWi VLS (2) where k, RN, Li, Wi and VLS are the number of temporal
segments of a video, number of rebuffering events, average length of the pauses, weight factor representing the degree of degradation and length of each segment respectively. Based on the subjective scores, this is then mapped into 5-point MOS scale as:
VsQMMOS =C exp k i=1 RNLiWi VLS (3) where C is a constant and all other factors are as defined in (2). Based on the subjective assessment results, it was found that the first segment has higher impairment weight compared to middle or end segments, based on which the authors conclude that the pauses, in the beginning, are more important and hence will have a higher impact on the final QoE value for streaming scenarios. This is in contradiction to other works which consider therecencyeffect to have a high impact on the QoE. The authors also propose some guide-lines for subjective test assessment methodologies such as considering longer duration sequences which is more typical of HAS applications and to allow multiple viewing of the test sequences as desired by the test subjects.
An extension of this model is presented by Rodríguezet al.[66]. Here temporal interruptions (number, location and length of the rebuffering events) during a video session, initial loading delay and quality switching (number and location) are considered to propose a new quality metric, VsQMDASH. The effect of initial loading delay is modeled as:
IILD=5−B exp(αdLILD/VL) (4)
whereLILD,α,VLand B are initial buffering delay (seconds),
exponential decay factor, total video length and constant respectively. For quality switching events, the authors observe that for the same frequency of rebuffering, compared to tem-poral resolution changes, spatial resolution changes have a more significant effect on users’ QoE. The final QoE model, VsQMDASH, modeled using 5-point ACR MOS scores is:
VsQMDASH =C exp k i=1 Wi VLS RNsLi + n j=1 PjiRji+ m l=1 QliSli −IILD (5)
whereCis a constant,i,jandlindicates the current segment, temporal switching type and spatial switching type respec-tively,kis the total number of segments in a media session, RNs andLi are number and average length of pauses in the same temporal segment,mandnare number of spatial and temporal resolution switching types respectively,Wi,Pjiand
Qliare weight factors andSliis the number of switching type
andIILDis the effect of initial loading delay as defined in (4).
It was observed that the quality of the initial temporal segment has a greater influence on the QoE and for switching events, the spatial resolution affects the quality more than the tempo-ral resolutions. The model is shown to be of low complexity in terms of processing and energy consumption and hence suitable for devices such as mobile phones and tablets which have limited power and processing capabilities. The proposed parametric model uses only application-level parameters and hence is suitable for QoE monitoring of encrypted traffic, specifically at the network side. The model validation is done using similar types of patterns as used for model design, and also considers a fixed number (four) of segments, hence leaving an open question about the performance of the model on unknown dataset employing different playout patterns and of different video length.
Albertiet al.[63] present a parametric QoE model which maps the QoS parameters to estimate QoE as:
eMOS=
N−1
i=0
aixiki (6)
where x0. . .xN−1 are measured values of parameters such
as video bitrate, frame rate, QP, rebuffering frequency, aver-age rebuffering duration and quality switching rate, whereas a0. . .aN−1 and k0. . .kN−1 are tunable parameters. The authors report that QoE degradation due to encoding quality is on a shorter time interval compared to QoE degradation due to IFs such as rebuffering and quality switching. The model parameter estimation and design are done using sub-jective tests consisting of two video sequences and taking into account various QP, rebuffering and quality switching factors. The authors report high prediction accuracy with 0.5 MOS difference for the worst case when compared to MOS scores obtained by subjective tests. In the absence of the model validation and performance estimation (e.g., regarding the correlation of the predicted MOS with the actual MOS), the actual performance of the model remains an open question.
Hoßfeldet al.[64] investigate the effect of five IFs: qual-ity switching amplitude, last qualqual-ity level, recency time for the different number of switches, the frequency of quality switching and time on the highest quality level. The authors found that quality switching shadows the effect of recency and also recency time (total duration of high-quality play-back after the last quality switch) does not affect the QoE. Also, it was observed that the time on each quality level has a more significant impact than that of the frequency of rebuffering. Discarding other IFs (based on statistical anal-ysis), the authors propose a simple QoE model, considering only two IFs, which take into account the effect of amplitude (the difference between the two quality levels) and time on the highest level using an exponential relationship as:
y(th)=0.003e0.06th+2.498 (7)
wherey(th) is the predicted MOS, andthis the time on the
highest level. The effect of switching amplitude is quantified by bounding the MOS values to the quality levels. The pro-posed model only proposes a parametric equation using sub-jective test results using a single content type and considers only two quality levels and lacks performance validation.
Lievenset al.[65] propose a MOS predictor,PQM, based on user evaluations as:
PQM(T)= 1 T+γRALL T Qfidelityt−Fτ∂fidelity∂t (t) −εαFβ∂freezes∂t (t) −F δ∂framerate∂t (t) (8) whereFτ,Fβ,Fδ,T andRALLare functions which represent
quality switching, amount of rebuffering events, frame rate, total duration over which MOS is evaluated and total time of rebuffering event, respectively.α, γ andεare constants and Qis the encoder-side MOS for a givenfidelity(quality level). Based on the subjective assessment using three Full HD (FHD) video sequences and various encoding and rebuffering conditions (not described in the paper) the authors observe an increase of MOS with an increase in resolution or bitrate. Below a specific bitrate, upscaled lower resolution video is found to be of higher quality compared to higher resolution video encoded at the same bitrate. On the temporal scale, no significant difference was found in between 50fps and 25 fps video while lower frame rate video (below 25fps) was rated lower with the video having quality changes rated lower than that of constant quality. Effect of rebuffering was observed to be non-linear depending on the individual duration of each event and frequency of rebuffering. The work presents only a parametric equation taking into account the various IFs but does not report the performance of the model using subjective assessment.
Yamagashi and Hayashi [67] present a quality model which was submitted as part of the competition for the ITU-T Rec. 1203. The model follows the framework used in Para-metric Non-intrusive Assessment of TCP-based multimedia Streaming quality (P.NATS) consisting of an audio qual-ity estimation module and video qualqual-ity estimation module which output per-second respective quality scores which are then integrated into per-second audiovisual coding quality scores in the audiovisual-integration/temporal module. The overall QoE is defined as:
QOverall=1+(QST −1)S (9)
which integrates the short term (per-second) audio-visual coding quality,QST, with other IFs factors as:
S=exp(−RN s1 )exp(− RALL/VL s2 )exp(− A/VL s3 ) (10) whereRN is the number of rebuffering events,RALL is the
total length of rebuffering events, Ais the average interval between rebuffering events,VL is the length of the content
ands1,s2ands3are constants with positive values.
The MSQ is modeled and evaluated in terms of 5-point ACR. The proposed model parameter selection and validation are performed by using well designed and defined subjective assessment using a total of thirty 1-min audiovisual SRCs and eleven 3-minute audiovisual source sequences. While, as discussed by the authors, the test design ‘‘hides’’ the effect of source quality on the QoE, in terms of the reported RMSE and PLCC values, the overall model performance still looks quite promising, especially considering the fact that the model does not use any media bitstream information, result-ing in a low complexity model which is suitable for encrypted QoE monitoring. The authors report that the model performs quite well for video sequences without rebuffering and also with some specific sequences with rebuffering (where the rebuffering occurs at the point where the compression quality is worse). This leads to the observation that the amount of QoE degradation due to rebuffering is dependent on the qual-ity of the video frame where the rebuffering occurs. Hence results from other works which take into account the temporal location of pauses (e.g., [62]) can be used to further improve upon this work. Unlike most of the other works, Yamagashi and Hayashi discuss the limitations of their work such as ver-ification of the model for the H.264 high profile (which is still the preferred and widely used profile for TV sets), validation of the model for small screen devices, performance evaluation of individual quality estimation modules, etc. Future work in this direction may include addressing these shortcomings and also the possible inclusion of other IFs such as initial loading delay, etc.
2) MEDIA-LAYER MODELS
While the most used video quality metrics (e.g., Peak Signal to Noise Ratio (PSNR), Structural Similarity (SSIM), Video Multimethod Assessment Fusion (VMAF)) are in this cate-gory, we focus here only on the metrics specifically developed for adaptive streaming over HTTP.
Taking into account the multi-segment and multi-rate fea-tures of HAS applications, Wanget al.[68] present two QoE models based on regression and classification. Using regres-sion they propose an evolved PSNR (ePSNR) model based on average, maximum, minimum and standard deviation of differential PSNR (dPSNR), wheredPSNRis defined as:
dPSNR=PSNR−PSNRref (11)
where PSNRref is the PSNR of the available highest rate
segment andPSNRis the PSNR of the segment under con-sideration.ePSNRis then defined as:
ePSNR=[a b c d]×Q+e (12) where a,b,c,d,eare constant values and Q is the vector defined as: Q= mean j (qij) maxj (qij) minj (qij) stdj (qij) T (13) whereqijrepresents thedPSNRof theithvideo scene andjth
operation. The classification method model uses weighted k-nearest neighbor (WkNN) based on segment bitrate and video segment position to predict QoE. Both models are eval-uated using subjective tests consisting of two videos using a real-world LTE network testbed. Both regression and classi-fication based methods are shown to provide high correlation with subjective MOS. Based on the correlation results, the last two segments have been found to have more effect than the other segments. In terms of PLCC results, the classification based model is found to have higher performance compared to the regression method, but in terms of complexity the ePSNRmodel is found to be of lower complexity.
3) BITSTREAM MODELS
Singh et al.[69] propose a bitstream model for QoE pre-diction by considering QP and frequency (RN), average
(RAVG) and maximum duration (RMAX) of rebuffering events.
Considering H.264/AVC as the encoder, for QP estimation, the authors use the average of QP values over all macroblocks in all video frames. The playout interruptions are modeled as a function ofRN, RAVG and RMAX using the cumulative
distribution function,F(x), of the delay as:
F(x)= ⎧ ⎪ ⎪ ⎪ ⎨ ⎪ ⎪ ⎪ ⎩ αx RAVG, ifx≤RAVG (1−α) x−RAVG RMAX−RAVG, ifx∈RAVG,RMAX 1, otherwise (14) whereα=1− RAVG
RMAX andRMAX andRAVGare maximum and average values of the individual rebuffering events during the video playback. Pesudo-random values distributed uniformly on [0,1] and the inverse function ofF(x) are used to obtain the playout interruption duration values based on which pauses of that duration are then inserted in the videos. The authors observe that compared to video quality due to higher QP values, users are more sensitive to rebuffering events with higher rate of drop of QoE with increase in RMAX, which
saturates after a certain value (6-8 seconds). In contrast, initial increase in QP results in slower QoE degradation with rapid fall in QoE at higher QP values. The 3-layer RNN model is validated using RMSE using subjective test scores. Since the model uses bitstream level information, the model suffers from inherent drawbacks of bitstream models such as limited scope of applications and also limited applicability to single codec. The proposed model was evaluated using only four content types of short duration (16 secs).
Xue et al.[70] propose a QoE model which com-bines instantaneous qualities and cumulative quality taking into account video segment quality, quality switching and rebuffering events. The instantaneous perceptual quality is evaluated using a linear model using QP values, and instan-taneous rebuffering related degradation is modeled as the opposite of the weighted intensity of the interrupted frame. Initial loading delay related degradation is assumed to be constant and is modeled using the initial QP value which
approximately represents the average quality of the video. The instantaneous qualities are then pooled using exponential decay temporal pooling (which takes into account the end user attention memory) to obtain the final QoE estimation. The model is shown to be of low complexity and stable with reasonable performance results. Since the subjective tests for model parameter estimation and subsequent validation are done using only two QP values, we will see later that, in the presence of multiple resolutions and QP values, the model performance is not that satisfactory.
Guoet al.[71] propose a model which estimates the overall quality using a linear combination of median and minimum of the instantaneous quality as:
QOverall =αQmedian+βQmin (15)
where α andβ are constants (0.68 and 0.33 respectively),
andQmedian andQmin are the median and minimum of the
average quality. The instantaneous quality is obtained from QP values using the normalized quality vs. inverted nor-malized quantization stepsize (NQQ) model in [88]. Based on this work, the authors also observe that the qualities of the composing frequency components of a non-periodic QP varying video session can be used to estimate the overall quality of the video. Among all these frequency components (of the instantaneous qualities), the one with the worst quality has the highest impact on the final quality.
Tranet al.[72] present a QoE estimation model consid-ering encoded video quality and quality variation as the IFs. The quality of the encoded video is calculated for each segment considering the average QP which is then used to model the effect of encoding quality and quality variation using the histogram of bins of segment qualities and segment quality gradients respectively. The overall session quality is modeled as: QOverall= NSQ n=1 αnFQn+ 1 m=−M βmFQm (16)
where αn and βm are model parameters, NSQ(= 5 in this
work),FQn andFQm are number of segment quality bins, frequency of segment quality bins and frequency of quality gradient bin respectively. Segment quality bins represent the encoded video quality while quality gradient bins represent quality variations. Model parameter estimation and valida-tion are done using subjective assessment for three videos of 74 seconds consisting of 2-second length segments and nine quality levels. A comparison with previously discussed models [71] and [75] for the given dataset shows a superior performance of the proposed model in terms of PLCC and Root Mean Square Error (RMSE). As in [78], the authors conclude that the effect of quality up-switching has a neg-ligible impact on the overall QoE compared to that of quality down-switching. IFs such as rebuffering events, initial load-ing delay and quality switchload-ing of startload-ing quality values are not taken into account in their model. The authors also assume that various representations are of the same resolution and 30843
frame-rate which is the case in many popular HAS applica-tions which use multi-resolution video representation in their applications.
An extension of the previous model [72] is presented in [73], where the authors, in addition to quality degradation due to encoding and quality switching, also consider the effect of different initial quality, initial loading delay and rebuffering related impairments. The overall QoE is esti-mated as:
QoEOverall =IQS−IRB−IILD (17)
where IQS is the impairment factor due to varying quality
modeled using the switching amplitude and the initial qual-ity value, IRB is the impairment factor due to rebuffering
duration, and IILD is the impairment factor due to initial
delay modeled using a logarithmic function. The authors find that the impact of switching amplitude depends not only on switching amplitude but also on the starting quality. For example, for equal switching amplitude, down-switching in a low-quality region is worse than down-switching in the higher quality region. Also, rebuffering duration of 0.25 seconds or less have a negligible effect on the final QoE value, while rebuffering durations of more than 2 seconds can lead to extreme QoE degradation.
Robitza et al.[74] describe another candidate model for ITU-T Rec P.1203 competition. It follows a similar mod-ular approach where the pooled audiovisual per second scores, representing the media quality (QLT) and degradation
due to initial loading delay (IILD) and rebuffering events
(IRB), are combined to obtain the final Audiovisual MOS
(MOSAVFinal) value as:
MOSAVFinal=QLT−(IILD+IRB). (18)
The model considers quality variations over time, recency effect, length and location of rebuffering events and encoding quality and is designed for sequences up to 5 minutes in length. The authors use simple averaging of the per-second scores into the final session quality score as other temporal pooling methods did not seem to provide increased perfor-mance gains. A similar observation was also reported in [18]. While the authors claim the model to be video or audio codec agnostic, the performance results for the proposed model is reported only for the mode using full bitstream information (Mode 3), hence leaving an open question about its per-formance for other modes (Mode 0, Mode 1 and Mode 2). Parameter selection based on the manual count of quality changes and exhaustive brute-force optimization procedure, as used by the authors, may lead to an over-fitting of the model parameters for the given test conditions and hence the performance of the same for other datasets can help in the evaluation of the actual performance gains of the model for possible real-world applications. Also, the model perfor-mance was only evaluated on PC/TV databases and its per-formance for mobile video streaming scenario still remains an open question.
4) HYBRID MODELS
Vriendt et al.[75] propose the following relationship for MOS prediction
Mpred =αμ−βσ−γRQS+δ (19)
where α, β, γ and δ are tunable parameters, and μ, σ and RQS represent the average of the quality of the chunks,
the standard deviation of quality information and frequency of switches respectively. Depending on how the parameter values are estimated, equation (19) can be used to obtain four different models (bitrate, objective quality (PSNR/SSIM), chunk-MOS and quality level). The chunk-MOS model uses MOS values associated with each quality level which can be estimated during the parameter tuning process, as is done for other parameters, or can be assumed to be uniformly spaced between a maximum and minimum value (which is equivalent to the quality level model). The parameter estimation is per-formed based on RMSE values using subjective MOS scores. Based on the results obtained in terms of RMSE, PLCC and SROCC values considering mobile phone and tablet devices, the general chunk-MOS model was found to perform better than others. As discussed by the authors, the results are limited to a single content type and a particular rate decision algorithm.
Chenet al.[76] model the Time Varying Subjective Qual-ity (TVSQ) of HAS rate-adaptive video streams using a Hammerstein-Wiener (H-W) model with input and output functions as: u[t]=β3+β4 1 1+exp(−(β1qst[t]+β 2)) (20) and q[t]=γ3+γ4 1 1+exp(−(γ1v[t]+γ2)) (21) whereqis the predicted TVSQ,βandγ are model parame-ters,qstis the Short Term Subjective Quality (STSQ) andv[t] is the output of the linear filter of the form
v[t]=bTu t−r:t+fTv t−r:t−1 (22) where b = (b0, . . .br)T and f = (f0, . . .fr)T are
model parameters. Temporal distortions such as mosquito effects, jerkiness, etc., are captured using Video-RRED STSQ predictor [89]. The proposed model, while achieving good performance and providing valuable insights into the TVSQ optimization problem, does not take into account playback interruptions such as rebuffering, which limits the model application for more realistic cases. Also, the H-W model implementation as used by the authors is not suitable for videos of different durations [82].
Shen et al.[77] present a QoE model which takes into account segment quality, primacy and recency effects and quality switching (using bitrate distribution) as IFs. Each seg-ment of the video is assumed to be of Constant Bitrate (CBR) and the respective encoded video quality of each segment is
calculated as:
QSeg=γ
BR
MV+δ (23) whereBR is the bitrate, γ,δ are constants, andMV is the motion parameter calculated as:
MV = 1 N−1 N f=2 stdspace|y(f,w,h)−y(f −1,w,h)| (24)
wherey(f,w,h) is the pixel value at position (w,h) of the f −thframe. The primacy and recency effects are modeled as:
f(t)= αP 1+αP2t2 +
βR
1+βR2(t−T)2, 0≤t ≤T (25) where αP and βR correspond to the effect of primacy and recency respectively. The overall adaptive streaming QoE is given by:
QOverall=IQS−→S−→WT (26)
where IQS represents the impact of quality switching, −→S
is a vector consisting of the QoE of each segment as esti-mated using (23) and−→W is the weight vector for taking into consideration memory related factors (primacy and recency) using (25). The authors observe that at a particular aver-age bitrate, down-switching achieves higher QoE than up-switching. Also, video sequences with high startup and end quality receive higher ratings due to primacy and recency effect, with the primacy effect decreasing for long video sequences. Bitrate distribution is found to be the major IF. The model was evaluated using only a single content type and also limited to the test conditions with different average bitrates. Hence the performance of the model for real-world applica-tions remains an open question, mainly because the model does not take into account rebuffering related impairments.
Liuet al.[78] propose a no-reference QoE model consider-ing both temporal and spatial quality and takconsider-ing into account IFs such as initial delay, rebuffering and quality switching. The proposed overall QoE model is adapted from the ITU-T E-model [48] as:
DASH−MOS =1+0.035R+7×10⁻⁶R(R−60)(100−R) (27) whereRis estimated based on impairment due to initial delay (IILD), stalling (IRB) and quality switching (IQS) as:
R=100−IILD−IRB−IQS +αIILD IRB+IQS+β IRB∗IQS. (28)
Hereαandβare estimated using subjective assessment (as 0.15 and 0.82 respectively). Based on the subjective assess-ment, the authors find that the initial loading delay related impairment is linear and hence is modeled using a linear equation. Impairments due to rebuffering, which are more complicated to estimate and have more dependent variables, are modeled using a combination of a number of rebuffering
events, total rebuffering duration, and video motion content of the video. Quality switching related impairments are mod-eled using the VQM [19] metric by taking into account both encoding related impairments and impairments due to quality switching. Based on their tests, the authors observe that, for a fixed number of rebuffering events, the impairment increases monotonically with the rebuffering duration, while for a fixed rebuffering duration, the impairment due to rebuffer-ing frequency does not increase monotonically. Also, higher frequency of rebuffering leads to higher impairment. While the model was designed and evaluated using 1-minute long video sequences, a preliminary investigation by the authors shows that it performs quite well for video sequences of up to 10 minutes duration.
Garciaet al.[79] present an interesting modular approach of pooling short-term quality models for long-term quality estimation which then are combined with rebuffering related information to obtain the overall media session quality. Such a modular approach leaves out the interdependencies, leading easier integration and development. The proposed model can be summarized as:
Q=QLT−IRB (29)
where QLT is obtained by pooling short-term audiovisual
quality scores and IRB is the quality degradation due to
rebuffering. Six different models are used to estimate the short-term audiovisual quality scores:VQMAV is the general
VQM model, PSNRAV is the PSNR averaged per segment,
DT0 is the frame-based model based on ITU-T Rec series [8], DT1 andDT2 are variants ofDT0 and Dummy is 5-point scale quality levels.degStalis calculated as defined in ITU-T Rec series [90]. Irrespective of the pooling method used, the performance of short-term quality models is found to be a good representative of the long-term quality model perfor-mance. It is observed that the best short-term quality models also perform best for long-term models, withDT2 resulting in the best performance in terms of RMSE values.
Duanmuet al.[80] present a QoE model (referred to as Streaming Quality Index (SQI)) considering the combined effect of initial loading delay, rebuffering and encoding qual-ity. The overall quality is computed from the instantaneous quality in a moving average fashion where the instantaneous quality at each time unit, Qn, is considered to be a linear
combination of instantaneous video presentation qualityPn
estimated at the server side by frame-level VQA model and impact of rebuffering at individual framesSnas:
Qn=Pn+Sn. (30)
Based on the assumption that each rebuffering event is addi-tive and independent, the authors model the memory decline of memory retention due to rebuffering (based on Hermann Ebbinghaus forgetting curve [91]) as:
M =exp(− t TM
) (31)
whereM,t andTM represent memory retention, the current
time instant and relative strength of memory respectively, 30845
![FIGURE 3. QoE model classification for streaming applications (adapted based on input from [30]).](https://thumb-us.123doks.com/thumbv2/123dok_us/10133503.2914324/5.918.476.838.482.706/figure-model-classification-streaming-applications-adapted-based-input.webp)