Procedia Engineering 154 ( 2016 ) 601 – 608
1877-7058 © 2016 Published by Elsevier Ltd. This is an open access article under the CC BY-NC-ND license (http://creativecommons.org/licenses/by-nc-nd/4.0/).
Peer-review under responsibility of the organizing committee of HIC 2016 doi: 10.1016/j.proeng.2016.07.558
ScienceDirect
12th International Conference on Hydroinformatics, HIC 2016
Assessment of High Resolution Topography Impacts on
Deterministic Distributed Hydrological Model in Extreme
Rainfall-runoff Simulation
Qiang MA
a,*, Elodie ZAVATTERO
a, Mingxuan DU
a,
Ngoc DUONG VO
b, Philippe GOURBESVILLE
aaInnovative CiTy lab. Polytech Nice Sophia / Nice Sophia Antipolis University, 1-3 Boulevard Maître Maurice Slama, 06200 Nice, France bFaculty of Water Resource Engineering, University of Science and Technology, the University of Da Nang, Viet Nam
Abstract
To represent the extreme rainfall-runoff events, the deterministic distributed hydrological modeling is gaining interest both with the increase of the computation facilities and the availability of data especially the topography inputs. The experience has demonstrated the key role of the topographic resolution within the development of the deterministic distributed hydrological models by achieving the impacts on the characteristics of the basin especially the slope distribution and the representation of the stream network. To define the suitable topography resolution applied in the deterministic distribution hydrological models is one of the key pre-processes before the modelling analysis. Thus, in this paper, the simulation results of four deterministic hydrological models with different topography resolution – 300m, 150m, 75m - for the Var basin, France (2800km2) are analyzed
in order to evaluate the influences on the simulation accuracy. The results of sensitivity analysis indicate the threshold value of the topography resolution on the model simulation with the consideration of both the sufficient accuracy and the reasonable simulation time to cover the extreme rainfall-runoff event in 1994.
© 2016 The Authors. Published by Elsevier Ltd.
Peer-review under responsibility of the organizing committee of HIC 2016.
Keywords: High resolution topography, sensitivity analysis, deterministic hydrological model, extreme rainfall-runoff, Var Basin.
* Corresponding author. Tel.: +33 695822195. E-mail address: [email protected]
© 2016 Published by Elsevier Ltd. This is an open access article under the CC BY-NC-ND license (http://creativecommons.org/licenses/by-nc-nd/4.0/).
considered and simulated followed partial differential equations of conversation of mess, energy and motion [1]. However, the power of the physical deterministic distributed model is as same as its weakness, as the data requirements of setting up this kind of model are relatively high. With the huge amounts of data inputs that some parameters could be over or under-estimated in the modelling set-up, the model uncertainty is increased at the same time.
The topography input as one of the main inputs of this model which directly influenced the river network and slope distribution, has significant impacts on the model simulation. One of the main factors defined the data quality is the data resolution. As we know that keeping increasing the resolution of the topography may improve the simulation results [2], but considering the geomorphology characteristics of the study area and the modelling computation time, the higher resolution topography input (e.g. 5m × 5m resolution) may not efficient in the model strategies. Hence, in this study, four topography scenarios of different resolution in Var Basin (2800km2), France were assessed, to define the suitable inputs resolution for simulating the extreme rainfall-runoff events.
1.2.Physical behaviors of the study area
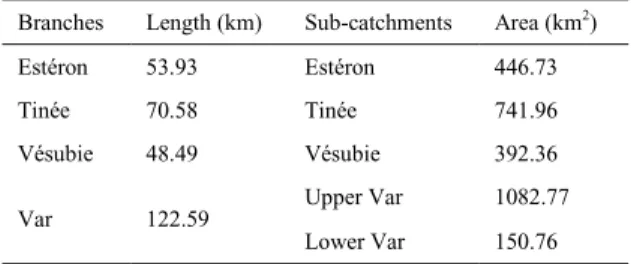
The Var catchment is located at the southeast part of France with the control area of 2800km2 which is the largest river basin in the French Mediterranean Alps region. The elevation variation in this region is conspicuous. The basin raise from 0m above the sea level until 3100m above the sea level with the steep slope distributed along the branches located in the middle and upper area of the catchment. There are four main tributaries (Var, Estéron, Vésubie, Tinée) cross five main sub-catchments in this basin (Table 1) (Fig. 1.). The alluvial aquifer is one of the main drinking water resources for the local population. The exchange between the groundwater and surface water at the lower part of the basin is frequently [3].
Table 1. The sub-catchments and main branches in Var Basin. Branches Length (km) Sub-catchments Area (km2)
Estéron 53.93 Estéron 446.73 Tinée 70.58 Tinée 741.96 Vésubie 48.49 Vésubie 392.36 Var 122.59 Upper Var 1082.77
Fig. 1. Topography of Var catchment, France.
The climate condition in this basin is the typical Mediterranean climate has hot dry summers and cool wet winters. The annually precipitation in this catchment is around 815mm, concentrated in 65-80 days per year. The surface discharge is contributed by instance rainfall, snow melting and exchange with the soil and the shallow aqua aquifer. The floods occur in this region mainly appeared at the spring season with the rainfall combined with snow melting from the mountain and in the winter time coursed by the extreme precipitation events. From the discharge records at the Napoléon III Bridge (1985-2014) located at the outlet of the catchment, the annually average discharge of this catchment is around 50m3/s. However the discharges from each tributary contributing to the main branch in the Var Basin are not clear as no measurements are available.
1.3.Extreme rainfall-runoff event at 1994
The flood occurred at 5th November 1994 as one of the most spectacular hydrological events recorded in the Var valley [2]. During this event, several dikes at the downstream part of the basin is overlapped and a number of national and departmental roads were destroyed (Fig. 2.). Some small bridges were completely washed away and the flood entered international airport of NICE caused it closed for around one week. Fortunately, there were no lives lost but the estimated damages of this hazard are around 23 ×106€.
Fig. 3. The hourly gauging station available for flood 1994 (data from Météo France)
During this event, most amount of the rainfall were recorded at the station Roquesteron and station St Martin Vésubie with 168.2mm and 164.2mm respectively and limited around 95.9mm closed to the coastal line (station Carros). The highest altitude among these six stations is 1064m above sea level (station Vésubie) that defines the data limitation of unknown rainfall information above this elevation.
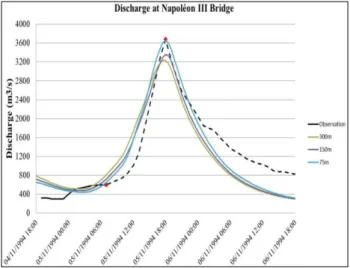
The peak discharge at the downstream part is estimated around 3680m3/s appeared at 18:00 5th November 1994.
However this value should be considered critically, as this value is above the ability of the measurement tool and the highest records that are around 600m3/s (Fig. 4.). From the rising time which the last records around 600m3/s at 7:00 5th November 1994, all the records are estimated by the analysis after the event.
Fig. 4. Hydrograph recorded at the Napoléon III Bridge, Nice (from DIREN PACA & CEMAGREF 1996 [3]).
The topography data with different resolution applied in this study are collected from the GIS department of Métropole Nice Côte d'Azur. In Table 2, it indicates with the variation of the data resolution, the higher resolution data could produce bigger study domain, but all the other geomorphology factors of the catchment is decreasing with the raise of the resolution. For instance, change the resolution from 300m to 150m (twice increased), the study area decreases 2.32km2, but the total river length increase 108.89km. Then with the resolution grew up until 25m,
the control area doesn’t shown a big change, but the total river length, maximum and average slope of the catchment
raise almost twice more than the 300m resolution data. However, the difference between 5m and 25m resolution data is not obvious, which could be claimed that in the Var catchment, France, the 25m resolution topography data already has the ability to well represent the topography reality.
Hence, with the increasing of the topography resolution, the data will be more closed to the reality. However, there should be one threshold value of the data quality for different study area depends on the geo-characteristics of the catchment which indicate that when this value is achieved, the improvement of continuing to increase the data resolution is less. In this case study, the threshold value of the topography data resolution could be between 75m and 25m.
Table 2. The topography data with different resolution.
Data Resolution A (km2) TRL (km) MAX_S (°) MIN_S(°) AVG_S(°) STD (°)
5m×5m 2814.58 2045.91 85.49 0.00 27.60 11.95 25m × 25m 2814.67 2021.51 80.79 0.00 26.74 11.23 75m × 75m 2816.49 1954.82 70.97 0.00 24.39 10.18 150m × 150m 2817.38 1896.98 58.38 0.00 21.55 9.36 300m × 300m 2819.70 1788.09 44.86 0.03 18.08 8.21
N.B. A: Area (km2); TRL: Total River Length (km); MAX_S: Maximum Slope (°); MIN_S: Minimum Slope (°); AVG_S: Average slope (°);
STD: Standard deviation (°)
2.2.Model description and set-up strategies
In this study, the physical deterministic distributed hydrological model MIKE SHE is selected to test the topography impacts on the simulations of the extreme event 1994. The model of MIKE SHE is developed by DHI since mid-1980s’which has the capability to integrated consider multiple processes in the hydrological cycle (e.g. evapotranspiration, rainfall-runoff, etc.).
may not be taken into account in MIKE SHE. The more refined MIKE SHE cell resolution, the more accurately the river network can be represented [4].
Fig. 5. MIKE 11 branches and H-points in a MIKE-SHE Grid with River Links [4].
To assess the impacts of the topography inputs on the modelling results, four hydrological models with different topography data resolutions (300m, 150m 75m and 25m) are built in the study. Since the links between MIKE SHE and MIKE 11 have significant impacts on the final results, to make sure the river network of those models can well present the reality, the drainage lines used in this study are abstracted based on the highest resolution topography data (5m × 5m). The simulation period is from 13:00 3rd to 18:00 6th November 1994 which covered the whole flood event included the first intense rainfall to fully fill the domain. 80 hours rainfall records from 6 hourly gauging stations are applied as the main source of the model. As mentioned before, the soil condition during this event is already fully filled, so the infiltration process is ignored in the model simulation. Also, because of the high intensity of the precipitation, the interception is not included.
3.Results Discussion
Because of the big uncertainty of the peak value, the model calibration is more focused on rising time and value and the peak time of the flood. The sensitivity analysis has to be focused on the factors and variables that are directly affecting the runoff process [5]. For the extreme flood, as the big amount of the precipitation fell on the land surface and produced the surface discharge immediately, the width of the river cross section is changed a lot [6].
There is a big doubt on the roughness of the river channel and the overland area during the extreme rainfall-runoff event. Hence, in the sensitivity analysis of the model calibration, the Strickler coefficients for the river channel and the overland are the main factors to be analyzed. With the certain resolution topography (300m), the peak time is
highly influenced by the Strickler value of the river channel, and the Strickler value of the overland doesn’t have big
effects on the peak as in the channel, but it will slightly have the impacts on the peak value (Table 3).
Table 3. The sensitivity analysis of the MIKE SHE calibration Strickler Value (m1/3/s)
Peak time Peak value (m3/s)
Overland River 40 20 05/11/1994 15:30 3662.99 30 20 05/11/1994 15:30 3657.81 20 20 05/11/1994 15:30 3647.08 10 20 05/11/1994 16:00 3611.93 20 10 05/11/1994 17:00 3352.78 20 5 05/11/1994 19:30 2891.30 8.5 8.5 05/11/1994 18:00 3237.32
Then, the same parameters are applied for the other different resolution topography inputs. The results in Fig. 6 shown with the increasing of the topography resolution, the peak value of the flood simulation in improved. This could be mainly because of the improvement of the topography quality especially the slope distribution. Beside, with the higher resolution topography input, the river network in the catchment is better presented. The coupling between the MIKE SHE and MIKE 11 has the impacts on the final result. With the higher resolution that applied the finer cell size in the model calculation, the link between the MIKE SHE and MIKE 11 is more clearly presented in the model. This could be one explanation of why the higher resolution model produces higher peak value.
Fig. 6. The hydrography of the simulation with different topography resolution
Moreover, even though the higher resolution will produce the better simulation results, the computation time of different is exponentially increasing. The running time for the 300m and 150m resolution model is quite same, just several minutes. But for the 75m resolution, the computation time raise up to several hours. For the 25m resolution model, the model will have to run for several weeks. Hence, as the 75m model results are already good enough to represent the event, finally, the 25m model result is not presented in this paper.
5.Acknowledgment
This research is currently developed within the AquaVar project with the support of Metropole Nice Côte d'Azur, Agence de l'Eau Rhone Mediterranéen, Conseil Départemental 06 and Meteo France. This work benefited from the data provided by the Metropole Nice Côte d'Azur and by Météo France. The results were provided by DHI Software (MIKE SHE). Then, DHI is acknowledged for the sponsored MIKE Powered by DHI licence file.
References
[1] L. Feyen, R. Vázquez, K. Christiaens, O. Sels, J. Feyen, Application of a distributed physically-based hydrological model to a medium size catchment, Hydrology and Earth System Sciences Discussions, European Geosciences Union, 2000, 4 (1), pp.47-63.
[2] V. Guinot, P. Gourbesville, Calibration of physically based models: back to basics? Journal of Hydroinformatics, 05.4, 2003. [3] M.X. Du, E. Zavattero, Q. Ma, O. Delestre and P. Gourbesville, 3D hydraulic modeling of a complex alluvial aquifer for groundwater resource management, Submitted to International Conference on Hydroinformatics 2016.
[4] MIKE SHE user manual, MIKE by DHI 2014.
[5] N.D. Vo, P. Gourbesville, Application of deterministic distributed hydrological model for large catchment: a case study at Vu Gia Thu Bon catchment, Vietnam, Journal of Hydroinformatics Mar 2016, DOI: 10.2166/hydro.2016.138.
[6] E. Zavattero, M. Du, Q. Ma, O. Delestre and P. Gourbesville, 2D Sediment transport modelling in high energy river – application in Var river, France, Submitted to International Conference on Hydroinformatics 2016.


![Fig. 4. Hydrograph recorded at the Napoléon III Bridge, Nice (from DIREN PACA & CEMAGREF 1996 [3])](https://thumb-us.123doks.com/thumbv2/123dok_us/10093882.2909727/5.816.235.581.94.362/hydrograph-recorded-napoléon-bridge-nice-diren-paca-cemagref.webp)
![Fig. 5. MIKE 11 branches and H-points in a MIKE-SHE Grid with River Links [4].](https://thumb-us.123doks.com/thumbv2/123dok_us/10093882.2909727/6.816.233.583.383.649/fig-mike-branches-points-mike-grid-river-links.webp)