Write-aware replacement policies for
PCM-based systems
R. Rodr´
ıguez-Rodr´
ıguez, F. Castro, D. Chaver, R.
Gonzalez-Alberquilla, L. Pi˜
nuel, F. Tirado
ArTeCS Group, Facultad de Informatica, University Complutense of MadridEmail: {rrodriguezr,fcastror,dani02,rgalberquilla,lpinuel,ptirado}@ucm.es
The gap between processor and memory speeds is one of the greatest challenges that current designers face in order to develop more powerful computer systems. In addition, the scalability of the Dynamic Random Access Memory (DRAM) technology is very limited nowadays, leading to consider new memory technologies as candidates for the replacement of conventional DRAM. Phase-Change Memory (PCM) is currently postulated as the prime contender due to its higher scalability and lower leakage. However, compared to DRAM, PCM also exhibits some drawbacks, like lower endurance or higher dynamic energy consumption and write latency, that need to be mitigated before it can be used as the main memory technology for the next computers generation. This work addresses the PCM endurance constraint. For this purpose, we present an analysis of conventional cache replacement policies in terms of the amount of writebacks to main memory they imply and we also propose some new replacement algorithms for the last level cache (LLC) with the goal of cutting the write traffic to memory and consequently to increase PCM lifetime without degrading system performance. In this paper we target general purpose processors provided with this kind of non-volatile main memory and we exhaustively evaluate our proposed policies in both single and multi-core environments. Experimental results show that on average, compared to a conventional Least Recently Used (LRU) algorithm, some of our proposals manage to reduce the amount of writes to main memory up to 20-30% depending on the scenario evaluated, which leads to memory endurance extensions up to 20-45%, reducing also the energy consumption in the memory hierarchy up to 9%
and hardly degrading performance.
Keywords: PCM, endurance, failing cells, cache replacement policies
1. INTRODUCTION
The current trend of increasing the number of cores in a single chip allows various threads or applications to execute simultaneously, which increases the demand on the main memory system to retain the working set of all the concurrently executing streams. This leads to the requirement of a larger main memory capacity in order to maintain the expected performance growth. However, although DRAM has been the prevalent building block for main memories during many years, scaling constraints have been observed when DRAM is used with small feature sizes. Moreover, the increase in memory size makes its leakage current to grow proportionally, and as a result, its energy consumption has become a major portion of the overall energy consumption in the system. Consequently, current research is focused on exploring new technologies for designing alternative memory systems in response to these energy and scaling constraints observed in DRAM technology. Among these technologies, Phase-Change
Memory (PCM) is clearly the prime contender. PCM is a low-cost and non-volatile memory technology that almost removes the static power consumption and provides higher density and therefore much higher capacity within the same budget than DRAM. Nevertheless, several obstacles restrict the adoption of PCM as main memory for the next computer generation: long write access latency, high write power and limitedendurance.
The endurance is related with the amount of writes that a cell is likely to sustain before it fails, and in PCM technology this number is significantly lower than in DRAM. Specifically, a PCM cell fails after around 108
writes while a DRAM cell supports over 1015 writes. After a cell fails, it is not possible to change its value anymore and consequently the corresponding block and even the whole page it belongs to must be discarded. A natural solution is to cut the write traffic to PCM in order to extend the lifetime of PCM-based systems. For this purpose, several architectural techniques have been proposed recently [1, 2, 3, 4].
In this paper, which extends our previous work [5], we deal with the PCM endurance problem at a cache controller level by focusing on the LLC replacement policy. Conventional policies make their replacement decisions with the only objective of increasing the hit rate in the cache. Our goal is to redesign these policies so that they report a satisfactory trade-off between the memory lifetime and performance. We first analyze the behavior of classical and current performance-oriented
cache replacement policies [6, 7, 8, 9] regarding the write traffic to memory that they entail. Then, we propose several newwrite-awarepolicies, based on the previous performance-oriented ones. We evaluate all these policies in a single-core environment using the SPEC CPU2006 suite and also in a multi-core scenario using the PARSEC parallel applications suite and multiprogrammed workloads. The results obtained in the single-core system reveal that some of our proposed policies significantly reduce the number of writes to main memory, thus improving memory endurance, and also the energy consumption in the memory hierarchy with respect to a conventional LRU, while they suffer a negligible performance drop. Furthermore, in the multi-core system our proposals behaves similarly and in some cases even better than in the single-core environment. We have directly ported our proposals to the multi-core system without any change, which suggests that it still remains opened a broad avenue for improvement.
Notably, in this paper we make the following contributions:
• We evaluate some representative performance-oriented cache replacement policies regarding the amount of dirty blocks evicted from the LLC (i.e. the number of writes transmitted to main memory).
• We propose several modifications to these
performance-oriented policies, aimed to cut down the write traffic to main memory and consequently to extend the memory lifetime.
• We qualitatively and quantitatively compare, in single and multi-core environments, our write-awarereplacement algorithms to both classical and recent performance-oriented policies, as well as to otherwrite-awarepolicies recently proposed. • We quantitatively compare the write traffic
reduction ability of our proposed write-aware
policies with that of an optimal policy, in order to estimate how far we are from the maximum reduction feasible.
The rest of the paper is organized as follows: Section 2 outlines the main concepts of PCM operation and also recaps some related work. Section 3 presents the algorithms proposed to increase the lifetime of PCM-based systems. Section 4 describes other write-aware
policies previously proposed. Sections 5 and 6 detail the experimental framework used and the obtained results respectively. Finally, Section 7 concludes.
2. BACKGROUND
Before addressing our main goal of improving PCM endurance by delaying the failure of the cells, we must briefly describe their operation.
Top Electrode Bottom Electrode Chalcogenide Heater (a) tamorph t christal Temper a tu re Time (b)
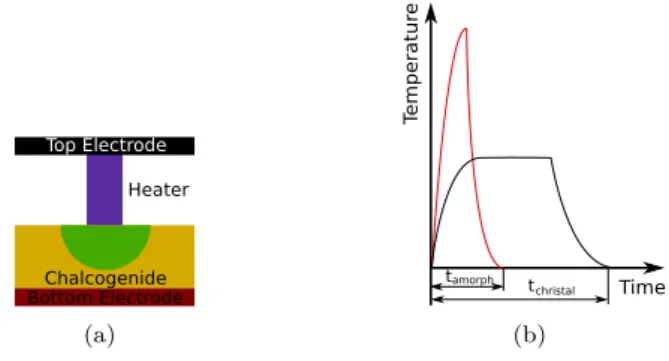
FIGURE 1. (a) PCM cell. A heating element (purple) is attached to a chalcogenous material (yellow/green), and enclosed between the two electrodes. The bit of material attached to the heater forms the programmable volume (green), i.e. the part of material that will experiment the phase change, (b) Heat pulses used to set and reset.
A PCM cell consists of two enveloping electrodes, a thin layer of chalcogenide and a heating element as Figure 1(a) illustrates. This heater is just a material that produces Joule heat when an electrical current is driven through, warming the chalcogenous material. In order to write a logical value in the cell, the heating element is employed to apply electrical pulses to the chalcogenide, which changes the properties of the material resulting in two different physical states:
amorphous (high electrical resistivity) and crystalline
(low resistance). Notably, if a high-intensity current pulse is applied, the material reaches over 600oC and melts. Then, it is cooled down quickly, making it amorphous (RESET process). If the pulse is longer and with lower intensity, the material goes through an annealing process allowing the molecules to re-crystallize, lowering the electrical resistance (SET process). Thus, the chalcogenide switches easily, rapidly and in a reliable way between both states. Figure 1(b) shows graphically the heat pulses used to set and reset a PCM cell.
The process for reading the stored value just consists in applying a low current to the cell in order to measure the associated resistance. The limited endurance of PCM relies on the fact that after a certain number of writes on a PCM cell (around 108), the heating
element is detached from the cell as a consequence of the continuous expansions/contractions derived from the writing process, leaving the cell in a stuck at failure
state. From that moment on, although the cell is still readable, the stored valued can not be changed anymore.
Next we briefly describe some of the most representa-tive proposals oriented to extend the PCM lifetime by reducing the number of writes.
• Eliminating redundant bit writes [1, 10, 11]: In a conventional DRAM write access, all bits in the row must be updated. However, a great portion of these writes are redundant (i.e. the bit before and after the write remains unchanged). Hence, taking advantage of the fact that in PCM reads are much faster and less power consuming than writes, every write is preceded by a read and a bitwise comparison, writing only those bits that have changed.
• Flip-N-Write [2]: Before performing a write to PCM, both the data to write and its bitwise inverse are compared with the data stored in the row, writing the one that involves less bit flips. The row incorporates an extra bit to indicate whether the stored data is the original one or its opposite. • Hybrid memory [3, 4, 12, 13]: The idea here is
to combine PCM with other technology not so sensible to writes (for example, DRAM). Thus, in [3] the authors combine a large PCM storage with a fast and small DRAM memory which acts as a cache for main memory. In [12], the same memory combination is studied in a Digital Signal Processor (DSP), whereas in [13], the scenario is quite different: CMPs with local Scratch Pad Memories (SPM) and PCM as main memory. Finally, in [4], the authors propose to combine DRAM and PCM in a large and flat memory and migrate pages between them, allocating in DRAM those pages that are most frequently written. All these techniques pursue our same goal of extending the PCM lifetime by reducing the amount of writes performed to PCM, but through quite different avenues. Although there are also some other recent works much more closer to ours [14, 15, 16, 17], we have postponed the corresponding descriptions to Section 4, since we consider that the reader will much better understand these proposals after reading Section 3. 3. PROPOSED POLICIES
As stated above, it becomes essential to restrict the number of writes performed to memory in order to improve the PCM lifetime. Writes can reach the memory via two channels: from the upper level in the hierarchy (the disk) for loading the code or data, or from the lower level in the hierarchy (the LLC) for updating those blocks that have been modified by the processor. This work focuses on the second type of writes.
The observed LLC-to-memory write pattern is very dependent on the memory updating policy employed: if a write-through policy is used, every time a block is modified in the LLC it is also updated in the main memory level; conversely, if a write-back policy is employed, a block is updated in memory only when it leaves the LLC in a dirty state. In this paper we will employ the latter policy, which is the most frequently used in real systems due to its better
tolerance to high memory latency and lower bandwidth requirements than the former one. Moreover, the write-back policy implies a significantly lower amount of writes to memory, which makes it even more adequate to our scenario.
In awrite-backpolicy, a block can be modified several times in cache before eviction. Our aim is to coalesce as many modifications to a block as possible in the LLC. For this purpose we focus on the cache replacement policy, which mainly determines the lifetime of the blocks inside the cache. When a cache miss implies the eviction of a block, the replacement algorithm decides which block must be replaced/victimized. Conventional policies –conceived for systems with several cache levels backed up by a DRAM main memory– make their decisions with the only goal of increasing the cache hit rate and hence the system performance. However, in our PCM scenario, the replacement policy for the LLC should not only aim to improve performance but also to reduce the number of writes to memory that it implies. For developing such write-aware replacement policy we should pay attention to the following general considerations:
1. First, a clean block leaving the LLC can simply be discarded, generating no writeback at all. Therefore, awrite-awarereplacement policy should give a higher priority to the eviction of clean blocks over dirty ones.
2. Second, among dirty blocks, we should distinguish whether they will be modified again in the future or not. A block that will be modified later again should stay in cache in order to merge future modifications with the previous ones into a single writeback. Conversely, a block that will never be modified again will not be able to reduce the amount of writebacks even though staying in the LLC. Consequently, our policy should give a higher priority to the eviction of the latter blocks. 3. Finally, among dirty blocks that will be modified
in the future, we should consider the following two aspects:
• First, based on Belady’s conclusions [18], the evicted block should be the one that will be modified again furthest in the future, given that this is the block with the lowest probability of merging the future modifications with the preceding ones into the same writeback.
• Second, based on the fact that a dirty block may have from only one to all its words modified, the evicted block should be the one with the least amount of modified words, since this is the block with the lowest probability of overwriting a dirty word in the next write to the block.
The first issue is quite easy to accomplish, since the dirtiness information of blocks is available in the cache.
However, the two remaining points are more complex to achieve, as they require extra hardware and some knowledge about the future. Besides, the third issue takes into account two conflicting aspects. Hence, as done in other similar situations, and in particular in conventional cache replacement policies, the solution in this case will be to build a prediction based on the previous behavior/state of the blocks.
Obviously, we have to take into account that an appropriate block replacement policy is essential to guarantee a high hit rate in the cache, and if we only pay attention to writeback reduction we can severely impact performance. Therefore, we must look for a satisfactory trade-off between performance and writes reduction.
Prior to detailing our proposedwrite-aware replace-ment policies, in the next subsection we describe sev-eral conventional algorithms –only oriented to improve performance– in which our proposals are based.
3.1. LLC performance-oriented replacement policies
When an incoming block implies an eviction, the cache replacement policy must decide which block to replace. In general, as B´el´ady established in [18], the best decision –in terms of performance– is to choose the block that will not be referenced again for the longest time. Since knowing the future in advance is not possible, the different policies proposed in the literature try to identify andvictimizesuch a block by gathering information at different points during the lifetime of the blocks (specifically insertion and promotion). Each block has a state associated for collecting this information. Thus, the cache replacement algorithms can be split into three different sub-policies:
• Insertion sub-policy: This sub-policy determines the initialstateto assign to a block when it is filled into the cache.
• Promotion sub-policy: This sub-policy determines how to update the state of a block when it experiences a hit (due to a miss in the next level closer to the processor).
• Victimization sub-policy: This sub-policy chooses the victim block when a replacement is required, by comparing thestates of the candidate blocks. The access pattern to the various cache levels is different. For example, in the lowest level a strong temporal locality is observed for most applications, which leads to replacement policies trying to exploit such locality. However, when a block reaches the LLC, the temporal locality has been almost totally filtered by the lower levels, so that the replacement policy must also exploit other features. Although many LLC replacement algorithms have been proposed recently, we next describe only those directly related with our work:
3.1.1. Least Recently Used (LRU)
It constitutes the baseline algorithm to which every proposal compares to, being implemented in most commercial systems under different simplified versions. LRU arranges blocks using a recency stack, in which the block that occupies the LRU position is the furthest referenced block in the past, while the one at the MRU (Most Recently Used) position is the nearest referenced block in the past.
• Insertion sub-policy: a new block is inserted into
the recency stack as the MRU block, moving
the remaining blocks one step closer to the LRU position.
• Promotion sub-policy: a block experiencing a hit is moved to the MRU position inside the recency stack.
• Victimization sub-policy: the block occupying the LRU position is selected for eviction, under the philosophy that, due to temporal locality, it is also the block that will not be required again for the longest time.
3.1.2. Pseudo Last In First Out (peLIFO)
This policy [8] builds on a LIFO (Last In First Out) replacement policy [6], in which, making use of a Fill Stack, the last block entering the cache is the candidate for replacement. With this scheme, some blocks will remain at the bottom part of the stack, being able to exploit long-term reuses. In peLIFO the bottom part of the Fill Stack is reserved forlong-term reuses as well. However, unlike LIFO, peLIFO selects dynamically intermediate stack positions (called Escape Points) for replacement, that guarantee thatshort-term reuses are also fulfilled.
3.1.3. Static, Bimodal and Dynamic Re-Reference In-terval Prediction (SRRIP, BRRIP and DRRIP, respectively)
These are the algorithms [7] in which the best of our proposals are based on, so we will next explain them in detail: each block has an associated state that represents the prediction of how far in the future it will be referenced again (Re-Reference Interval Prediction, or RRIP). This state is codified with M bits, that represent 2M different RRPVs (Re-Reference Prediction
Values). A block with RRPV=0 is predicted to be referenced again soon (near-immediateRRIP), whereas a block with RRPV=2M-1 is predicted to be referenced
again far in the future (distant RRIP). Based on this state information, the insertion, promotion and
victimization sub-policies of SRRIP operate as follows: • Insertion sub-policy of SRRIP: on cache fills SRRIP assigns to the new block an intermediate prediction state of RRPV=2M-2 (denoted as long
RRIP).
• Promotion sub-policy of SRRIP:on re-reference of a block, there are two different options: HP (Hit
RRPV=0 RRPV=1 RRPV=2 RRPV=3 b0 b1 b2 b3 Hit tob1 (FP) (a) RRPV=0 RRPV=1 RRPV=2 RRPV=3 b0 b1 b2 b3 Hit tob1 (HP) (b)
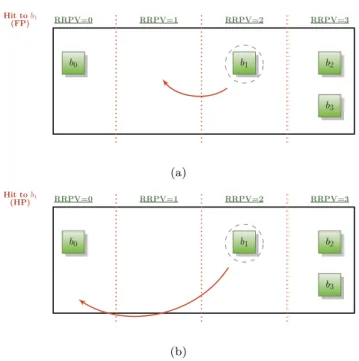
FIGURE 2. SRRIP promotion schemes: (a) SRRIP-FP, (b) SRRIP-HP.
Priority) that sets the RRPV of the block to zero and FP (Frequency Priority) that decrements it by one. Figure 2 illustrates an example of both promotion schemes for blockb1using M=2.
• Victimization sub-policy of SRRIP: for eviction, SRRIP selects one block with a distant RRIP (RRPV=2M-1). If there is not such a block, SRRIP increments the RRPV of all the blocks in the set and repeats the search. Figure 3 illustrates the victimization process when using M=2. In some cases, for example when the re-reference interval of all the blocks is larger than the available cache size, SRRIP utilizes the cache inefficiently. In such scenarios, SRRIP generates cache thrashing and results in no cache hits at all. To avoid this situation, the authors propose BRRIP, that modifies theinsertion sub-policy of SRRIP:
• Insertion sub-policy of BRRIP: it inserts majority of cache blocks with adistant RRIP (RRPV=2M
-1) and infrequently inserts new blocks with along
RRIP (RRPV=2M-2).
This policy helps to preserve some of the working set in cache, improving performance under such scenario. However, for non-thrashing access patterns, always using BRRIP can significantly hurt cache performance. In order to be robust across all kind of cache access patterns, the author also propose a third policy (DRRIP) which follows an insertion sub-policy that combines those of SRRIP and BRRIP:
• Insertion sub-policy of DRRIP: it includes a
Set Dueling mechanism [19] that identifies which
RRPV=0 RRPV=1 RRPV=2 RRPV=3 b0 b1 b2 b3 Evict one block with RRPV=3
FIGURE 3. SRRIP Victimization.
insertion policy among SRRIP and BRRIP –based on the current miss rates reported– is best suited for the application (Figure 4).
RRPV=0 RRPV=1 RRPV=2 RRPV=3 b0 b1 b2 b3 Set Dueling b4 New block Long
Insertion DistantInsertion 4-way
cache\\ set i
FIGURE 4. DRRIP Insertion.
3.1.4. Signature-based Hit Predictor (SHiP)
This proposal [9] is not a policy per se, but a predictor for the insertion of new blocks that can be used in conjunction with any other policy. SHiP associates each cache reference with a distinct signature, learns dynamically the re-reference interval of each one, and employs this information in the insertion sub-policy. The authors incorporate a Signature History Counter Table (SHCT) of saturating counters to learn the re-reference behavior of each signature. Every time a block is re-referenced (hit), the corresponding counter is incremented. If a block is never re-referenced during its residency in cache, the corresponding counter in SHCT is decremented when the block leaves the cache. The authors evaluate SHiP in conjunction with an SRRIP replacement policy: when a new block enters the cache, SHiP assigns it adistant RRIP if the associated counter is zero; otherwise along RRIP is assigned.
3.2. Proposed LLC write-aware replacement policies
Before delving into our write-aware LLC replacement policies, we first evaluated (Section 6.1) all conventional algorithms described in the previous sub-section in order to determine how they impact the writeback account. Given that all assessed algorithms report quite
poor results for our considered PCM-based scenario, we studied several modifications looking for a reduction in the amount of writes to memory.
We have proposed many policies based on the conventional ones by modifying them in several ways. However, DRRIP-based policies proved to achieve the best trade-off between writeback reduction and performance, so hereafter we stick to these. Below we detail those changes to DRRIP insertion, promotion
andvictimizationsub-policies, that demonstrated to be efficient enough. Note that we always use 2-bit DRRIP (RRPV ranges between 0 and 3).
1. Changes to the insertion sub-policy of DRRIP:
the only change that reveals as satisfactory deals with the set-dueling mechanism, which decides the policy to employ in each insertion (SRRIP or BRRIP). This mechanism makes the decision by comparing the number of misses that each policy generates in a few dedicated sets. Specifically, for the insertion, some cache sets always follow SRRIP while other cache sets always follow BRRIP; the remaining sets (follower sets) use the policy determined by the mechanism, so that the block is inserted according to the scheme reporting a lower amount of misses at that moment. Our proposal is to change the metric employed to make the decision: instead of using the number of misses (which is reasonable for a performance-oriented policy), we compare the number of writebacks to memory that both SRRIP and BRRIP generated in the dedicated sets, inserting the block according to the policy currently exhibiting a lower number of writebacks. We will refer to this change as SD. 2. Changes to the promotion sub-policy of DRRIP:we
make the following three proposals:
• PL (Promotion Low-aggressiveness): as explained before, clean blocks leaving the LLC are not harmful at all for PCM, whereas dirty blocks cause a writeback to main memory when evicted from the LLC. Consequently, we propose to promote more aggressively a dirty block than a clean one. Notably, PL promotes clean blocks using the FP option (decrementing the RRPV), while dirty blocks are promoted using the HP option (setting the RRPV to 0). Note that a more aggressive approach would be not to promote clean blocks at all; however, according to our experiments this leads to an excessive performance drop, due to not exploiting whatsoever the temporal locality of clean blocks. Summarizing:
– Clean Blocks→FP promotion. – Dirty Blocks→HP promotion.
• PM (Promotion Medium-aggressiveness) and PH (Promotion High-aggressiveness): based
on both the second and third general considerations previously detailed and the temporal locality principle, we propose to promote a block that experiences a write hit1 with a very aggressive policy under the
intuition that, if a block is written, it will probably be written again soon. Notably, in both PM and PH, blocks experiencing a write hit promote under the HP option. However, whereas PM promotes a block that experiences a read hit using the FP option in order to not impact performance in excess, PH does not promote a block at all under a read hit, for giving even more protection to writes at the cost of some performance degradation. To sum up: PM: – Read→FP promotion. – Write→HP promotion. PH: – Read→RRPV unchanged. – Write→HP promotion.
3. Changes to the victimization sub-policy of DRRIP:
for eviction, the only extra issue (with respect to DRRIP) to which we will pay attention is the dirtiness of the blocks. According to the first general consideration previously described, we propose the following three modifications:
• VL (Victimization Low-aggressiveness): at first, only clean blocks with a distant RRIP are considered to replacement2. In the event
that the policy is unable to find such a block, a dirty block with adistantRRIP is victimized. As in the original DRRIP policy, if no blocks with a distant RRIP exist, VL increments the RRPV of all the blocks and repeats the same process. For the sake of clarity, Figure 5 illustrates the flow chart of VL policy. • VM (Victimization Medium-aggressiveness):
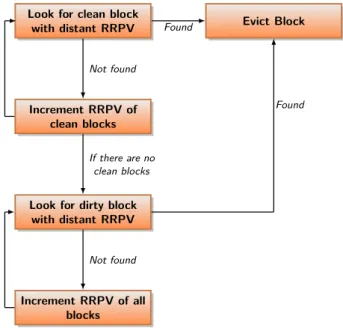
we can view this policy as a two-stage process. At the first stage, only clean blocks are considered for the replacement, so that the clean block with the highest RRPV is victimized. Notably, when no clean block with adistant RRIP is found, the policy augments the RRPV of clean blocks. In the event that VM is unable to find clean blocks in this first stage, a second stage takes place, in which a conventional search is performed considering
1Note that, unlike L1, LLC reads and writes do not correspond directly to program loads and stores respectively. In our system, the LLC is written to only when a dirty block is evicted from L2, which can take place both due to a load or a store in the processor. Conversely, LLC is read when L2 misses, which again can occur both due to a load or a store.
2Note that, as done in original DRRIP, our three victimization sub-policies break ties by always starting the victim search from a fixed location (the left in our studies).
Look for clean block
with distant RRPV Evict Block
Look for dirty block with distant RRPV Increment RRPV of all blocks Not found Found Found Not found
FIGURE 5. VL Flow Chart.
all blocks in the set. Figure 6 shows the flow chart of VM policy.
Look for clean block with distant RRPV
Increment RRPV of clean blocks
Evict Block
Look for dirty block with distant RRPV Increment RRPV of all blocks Not found Found If there are no clean blocks Found Not found
FIGURE 6. VM Flow Chart.
• VH (Victimization High-aggressiveness): this is also a two-stage process. At the first stage, as in the case of VM, only clean blocks are considered for the replacement, so that the clean block with the highest RRPV is victimized. However, when no clean block with a distant RRIP is found, the policy maintains the RRPV of all blocks unchanged during this first stage. When no clean blocks exist in the set, a second stage starts, in which a conventional search is performed considering all blocks in the set. Figure 7 illustrates the flow chart of VH policy.
As a result of all the possible combinations of the 7 proposed sub-policies, we introduce a full set of LLC replacement policies, denoted by the the names of the sub-policies they consist of. Although we have evaluated all of them, in the evaluation section and for
Look for the clean block with the highest
RRPV
Evict Block
Look for dirty block with distant RRPV Increment RRPV of all blocks If there are no clean blocks Found Found Not found
FIGURE 7. VH Flow Chart.
the sake of simplicity we only show results for those providing a satisfactory trade-off among PCM lifetime and performance.
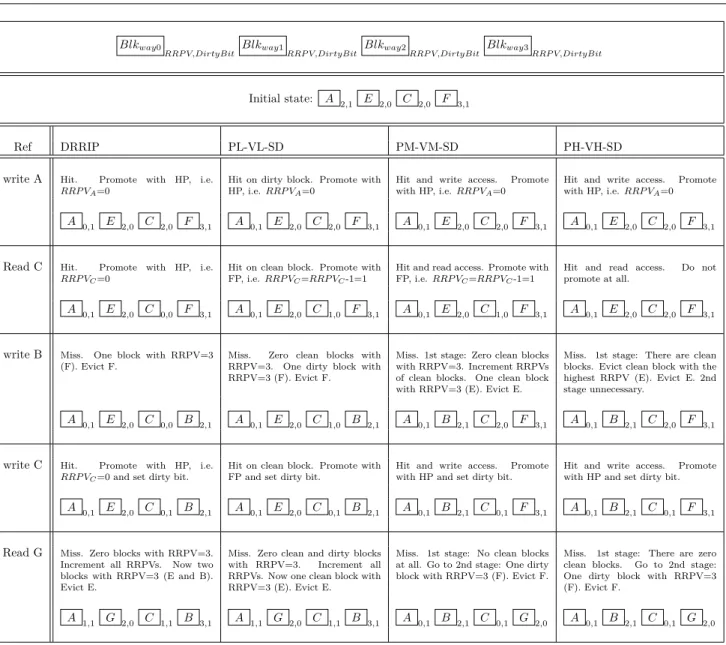
In order to further clarify our proposals, Figure 8 illustrates an example of the operation of three of our policies (PL-VL-SD, PM-VM-SD, PH-VH-SD) and original DRRIP. For simplicity, we make several assumptions: first, we consider a 4-ways LLC and that all accesses are mapped to the same set. Second, a write-back updating policy is used. Third, in the sub-insertion policy, the SD mechanism is supposed to always select SRRIP (i.e. blocks inserted with RRPV=2). Finally, HP is employed as the promotion sub-policy for DRRIP.
We should highlight that our proposal stacks on top of any other technique applied at main memory level, making it even more appealing in the presence of other techniques to extend the lifetime of a PCM device.
3.2.1. Endurance model
The policies proposed in the previous section are con-ceived with the aim of extending the lifetime/endurance of a PCM main memory without sacrificing too much performance. For achieving such a goal, we modified conventional performance-oriented replacement policies trying to reduce the number of LLC-to-memory write-backs. Note that the lifetime extension of the device is closely related to the reduction of writes, assuming the presence of wear leveling mechanisms, both at page level and inside each cache block, to prevent hot memory lo-cations to wear memory unevenly, as [1, 20, 21, 22, 23]. This claim holds in the reasoning that if we write to memory, e.g. half often, then each cell is worn half as much, which translates directly into twice (1/0.5 = 2) the memory lifetime.
There is a caveat though; any conventional PCM-based memory would implement the redundant bit writes technique [1, 10, 11], based on which only those bits that have changed need to be updated. Therefore, we cannot just look at the amount of writebacks to memory we reduce, because that could artificially make our results look better than they are, but we need to
Blkway0
RRP V,DirtyBit Blkway1RRP V,DirtyBit Blkway2RRP V,DirtyBit Blkway3RRP V,DirtyBit
Initial state: A 2,1 E 2,0 C 2,0 F 3,1
Ref DRRIP PL-VL-SD PM-VM-SD PH-VH-SD
write A Hit. Promote with HP, i.e. RRP VA=0
Hit on dirty block. Promote with HP, i.e.RRP VA=0
Hit and write access. Promote with HP, i.e.RRP VA=0
Hit and write access. Promote with HP, i.e.RRP VA=0
A 0,1 E 2,0 C 2,0 F 3,1 A 0,1 E 2,0 C 2,0 F 3,1 A 0,1 E 2,0 C 2,0 F 3,1 A 0,1 E 2,0 C 2,0 F 3,1
Read C Hit. Promote with HP, i.e.
RRP VC=0
Hit on clean block. Promote with FP, i.e.RRP VC=RRP VC-1=1
Hit and read access. Promote with FP, i.e.RRP VC=RRP VC-1=1
Hit and read access. Do not promote at all.
A 0,1 E 2,0 C 0,0 F 3,1 A 0,1 E 2,0 C 1,0 F 3,1 A 0,1 E 2,0 C 1,0 F 3,1 A 0,1 E 2,0 C 2,0 F 3,1
write B Miss. One block with RRPV=3 (F). Evict F.
Miss. Zero clean blocks with RRPV=3. One dirty block with RRPV=3 (F). Evict F.
Miss. 1st stage: Zero clean blocks with RRPV=3. Increment RRPVs of clean blocks. One clean block with RRPV=3 (E). Evict E.
Miss. 1st stage: There are clean blocks. Evict clean block with the highest RRPV (E). Evict E. 2nd stage unnecessary.
A 0,1 E 2,0 C 0,0 B 2,1 A 0,1 E 2,0 C 1,0 B 2,1 A 0,1 B 2,1 C 2,0 F 3,1 A 0,1 B 2,1 C 2,0 F 3,1
write C Hit. Promote with HP, i.e. RRP VC=0 and set dirty bit.
Hit on clean block. Promote with FP and set dirty bit.
Hit and write access. Promote with HP and set dirty bit.
Hit and write access. Promote with HP and set dirty bit.
A 0,1 E 2,0 C 0,1 B 2,1 A 0,1 E 2,0 C 0,1 B 2,1 A 0,1 B 2,1 C 0,1 F 3,1 A 0,1 B 2,1 C 0,1 F 3,1
Read G Miss. Zero blocks with RRPV=3. Increment all RRPVs. Now two blocks with RRPV=3 (E and B). Evict E.
Miss. Zero clean and dirty blocks with RRPV=3. Increment all RRPVs. Now one clean block with RRPV=3 (E). Evict E.
Miss. 1st stage: No clean blocks at all. Go to 2nd stage: One dirty block with RRPV=3 (F). Evict F.
Miss. 1st stage: There are zero clean blocks. Go to 2nd stage: One dirty block with RRPV=3 (F). Evict F.
A 1,1 G 2,0 C 1,1 B 3,1 A 1,1 G 2,0 C 1,1 B 3,1 A 0,1 B 2,1 C 0,1 G 2,0 A 0,1 B 2,1 C 0,1 G 2,0
FIGURE 8. Example of different policies operation: original DRRIP and three of our proposals.
take into account how many bits are affected by each writeback. Given the size of the task, we have relaxed the model slightly as follows:
• Whenever a cache block is written to main memory, we account for how many of the 64-bit words within the block have been modified. Unmodified do not wear off PCM cells.
• We assume that when a word is modified half of its bits are flipped and the other half preserves its value. This assumption is based on the fact that we use both integer and FP applications; on the one hand control variables have a small variability, on the other hand pointers to the heap and FP-numbers have much larger variability. Therefore, we take 0.5 as a general, broad approximation. Based on this reasoning, we can derive the following equations, which we will employ in the evaluation section for calculating endurance results.
First, we need to account for how many bits in the block are affected by each writeback. In other words, the probability of each bit to flip, denoted as BFP (Bit Flip Probability). This is needed because reducing the number of writes to main memory could has the side effect of increase the dirtiness of a block and increase the probability of bits being flipped.
BFP=P M BW ∗BW∗
PW B
n=1n∗N W M Mn
N W M M ∗BB (1)
where:
PMBW = Percentage of Modified Bits per Word.
Recall that our relaxed model assumes PMBW=0.5.
BW = Bits per Word. In our scenario, BW=64.
WB = Words per Block. In our scenario,
WB=8.
n = Number of words modified within
a written-back block.
In our scenario,n can be an integer from 1 to 8.
NWMM = Total Number of Writebacks to Main Memory.
N W M Mn = Number of Writebacks to Main Memory withn words modified.
BB = Bits per Block. In our scenario,
BB=512).
Based on the fact that memory wear is proportional to NWMM corrected with BFP, and that memory endurance is inversely proportional to memory wear, we can derive the wear reduction and endurance extension (denoted as WR and EE respectively) achieved by a
policy with respect to lru algorithm when running a particular application (we are using the relation WB=BB/BW): 1 W Rpolicy/lru =EEpolicy/lru= 1 BF Ppolicy BF Plru ∗ N W M Mpolicy N W M Mlru = 1 PW B n=1 n W B∗N W M Mn,policy PW B n=1 n W B∗N W M Mn,lru (2)
Note that this equation is perfectly coherent with the reasoning from this section and the assumptions of our model: it weights each write to main memory with the percentage of dirty words that the written-back block contains. Note also that, due to the normalization vs LRU, the EE obtained in Equation 2 is independent of the constant factors we assumed above (PMWB, BB, BW and WB).
4. OTHER WRITE-AWARE POLICIES Recently, some other works have also addressed the PCM endurance constraint at the LLC controller level by redesigning the LLC cache replacement policy. Next we recap two distinguished proposals:
• CLean-Preferred victim selection policy (CLP) [14]: Like us, CLP aims to maintain dirty blocks in the cache to increase the probability that writes were coalesced. It implements a modified LRU that gives preference to clean blocks when choosing a victim. The authors propose a family of clean-preferred replacement policies, called N-Chance. The N parameter reflects how much preference is given to clean blocks3. The algorithm selects as 3In our paper, although we have evaluated CLP with different N values, we just report data of CLP with N equal to the cache associativity, since it is the policy achieving the highest writes reduction maintaining also a satisfactory trade-off with the performance delivered.
victim the oldest clean block among the N least recently used ones. If such a block does not exist, the LRU block is used.
• Read-Write Aware (RWA) and Improved RWA (I-RWA) [16]: These policies are based on SRRIP-HP and they both use RRPV values of log2assoc
bits, being assoc the associativity of the cache. RWA modifies neither the victimization nor the
promotion sub-policies with respect to SRRIP-HP, but theinsertionsub-policy is modified as follows: when a read misses in the LLC, the RRPV of the inserted block is set to assoc−2; when a writeback from L2 to the LLC misses, the RRPV of the inserted block is set to 0. Conversely, I-RWA distinguishes between single and multiple-use dirty lines, trying to protect multiple-multiple-use lines. The SRRIP-HP victimization sub-policy is not modified, but the insertion sub-policy is changed so that any read miss sets the RRPV of the filled block to assoc−2 while a write miss sets it to
assoc−3. Besides, the promotion sub-policy is changed so that a read hit sets the RRPV of the block to a medium value –instead of 0 as done in SRRIP-HP– while a write hit sets it to 0.
Also [15] shares our same objective of reducing the number of LLC-to-memory writebacks at the LLC controller level. However, in this case, the solution has to do with the partitioning algorithm for sharing the cache among multiple applications. Notably, the authors accomplish the goal by adapting [24] to a PCM scenario.
Finally, in [17], a new write-aware replacement policy is presented, but in this case not for the replacement of LLC blocks but for the swapping of memory pages between PCM and DRAM in a hybrid main memory architecture. The authors propose a new memory management policy, based on the well-known CLOCK algorithm [25], that predicts if memory pages will receive future write references soon or not, and depending on that prediction maps the pages either to DRAM or to PCM.
5. EXPERIMENTAL FRAMEWORK
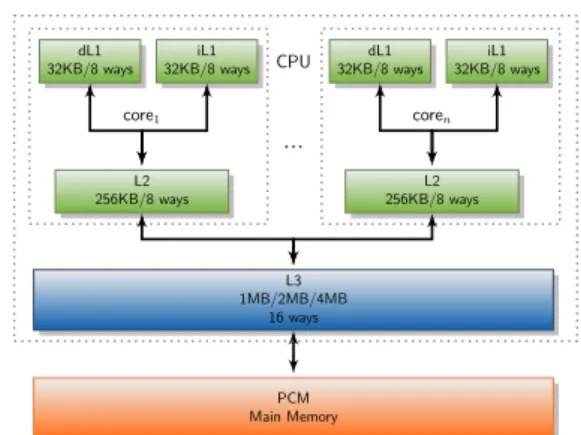
For our main experiments we use gem5 [26]. We use the classic memory model provided by the simulator and we modify it by including a new cache level (L3) and encoding the proposed cache replacement policies. We simulate both a single and a multi-core scenario, using the simulator in its Syscall Emulation mode (SE) or Full System mode (FS) respectively. For the sake of a better accuracy in both execution modes, an O3 processor type (detailed mode of simulation) was used. The cache hierarchy is modeled after that of an Intel i7 [27], formed by three cache levels, being L2 and L3 non-inclusive/non-exclusive. In the case of the multi-core scenario we model 2 and 4-core CMPs, with private L1 and L2, and a shared L3.
Figure 9 illustrates the experimental system used in both single-core and multi-core scenarios. Recall that for the evaluation of our proposed policies we implement them in the L3 while L1 and L2 use both a classical LRU algorithm. For modeling the PCM main memory we use DRAMSIM2 [28]. The integration between DRAMSIM2 andgem5 is done using the patch developed for gem5 [29]. We adapt the read and write latencies according to the PCM target. We consider a PCM main memory with 1 channel with 2 ranks of 8 banks each. Each bank has a 8-entry read queue and a 32-entry write queue for pending requests. When a writeback of a cache line from the LLC occurs, a write request is sent to the PCM, which is queued at a write queue. The application progresses without delay if the write queue has available entries since the writebacks are not on the critical path. Otherwise, the application stalls. Both lantencies and buffers size were selected according to the system used in [15].
dL1 32KB/8 ways iL1 32KB/8 ways L2 256KB/8 ways core1 ...
CPU 32KB/8 waysdL1 32KB/8 waysiL1
L2 256KB/8 ways coren L3 1MB/2MB/4MB 16 ways PCM Main Memory
FIGURE 9. Simulated system, for all caches a 64 bytes/block is used.
Since we target both uniprocessor and multi-processor architectures, our experiments make use of the SPEC CPU2006 [30] and the PARSEC [31] benchmark suites. When using the former suite in a single core scenario (L3 1MB size) we employ
train inputs –we also tried with reference inputs, obtaining very similar results but at the expense of huge simulation times– and we simulate 1 billion instructions from the checkpoint determined using PinPoints [32]. Note that results from 9 out of 29 benchmarks are not considered in the evaluation section due to experimental framework constraints. We also report results of 12 multiprogrammed mixes using SPEC CPU2006 programs (Table 1) in a 4-CMP system with a 4MB L3. In this case, we fast forward 100M instructions, warm up caches for 200M instructions and then report results for 1B instructions. Finally, when the PARSEC workload is employed, we uselargeinputs, which exhibit memory footprints much more similar to those of train inputs for SPEC applications than
smallones, and each simulation run is fast forwarded to the predefined checkpoint at the code region of interest (ROI), warmed-up by 100 million instructions, and then
simulate 1 billion instructions for all threads or to ROI completion, whichever comes first.
For selecting the multiprogrammed mixes from Table 1, we employ the following methodology: we execute each benchmark alone, using an L3 of 1MB and an LRU replacement policy for all cache levels, and we measure the amount of LLC-to-memory writebacks that it generates. We then obtain for each benchmark the writebacks to main memory per instruction ratio (WPI). Based on these values, we include each benchmark into the high, medium or low category. Specifically, the high category includes benchmarks with a WPI higher than 3∗10−3, themediumthose with
a WPI satisfying 3∗10−3 < W P I <10−3 and finally, in the low category we include the programs with a WPI lower than 10−3. Table 2 shows this classification. Based on this classification, and as we will further detail in Section 6.3.1, we build some mixes with high WPI, some with medium WPI, some with low WPI, and some combining applications from different WPI categories.
We should also highlight here that gem5 supports both x86 and Alpha ISAs. However, given that we found restrictions when using the FS mode for x86, we only simulated the PARSEC suite compiled for the Alpha ISA. In the case of SPEC CPU2006 suite, we run the simulations with the benchmarks compiled for both architectures, but since reported results were in the same ballpark, we chose to only show those corresponding to the x86 architecture.
Memory endurance simulator: Although gem5
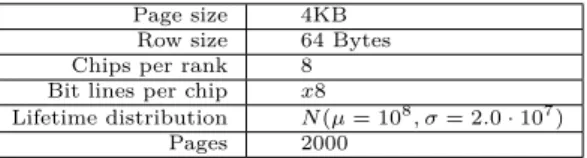
yields the values required to estimate the memory endurance extensions according to the model detailed in Section 3.2.1, we also employ a statistical simulator in order to plot the available memory (#alive pages) under each evaluated policy as time passes. Doing faithful, cycle accurate simulation is unfeasible due to the amount of time PCM requires to experience stuck-at faults. Therefore, we have developed an in-house montecarlo simulator following the description in [33]. Table 3 recaps the main parameters employed in this simulator.
Each proposal is simulated by creating a number of memory pages (#starting pages). Each bit inside every page is created with a lifetime randomly distributed according to a Gaussian distributionN(µ= 108, σ = 2.0 · 107). The simulator uses as input
parameters for each proposal the following (provided by the gem5 simulator): the average BFP, the total number of writes and the average write reduction vs LRU. Initially, the wear rate w is calculated as a function of BFP and the number of pages in the system, as Equation 3 shows. The BFP expresses how much each bit is worn per-write, and the part involving the number of pages expresses how much extra wear alive pages have to absorb on behalf of those faulty pages
Mixes Applications Mixes Applications MIX0 lbm, mcf, milc, soplex MIX1 lbm, mcf, milc, GemsFDTD MIX2 mcf, milc, soplex, GemsFDTD MIX3 bzip2, zeusmp, cactus, leslie3d MIX4 zeusmp, cactus, leslie3d, gobmk MIX5 cactus, leslie3d, gobmk, calculix MIX6 perlbench, gcc, gromacs, namd MIX7 hmmer, h264ref, omnetpp, astar MIX8 lbm, mcf, gromacs, sphinx3 MIX9 mcf, milc, perlbench, h264ref MIX10 cactus, hmmer, h264ref, lbm MIX11 mcf, cactus, hmmer, h264ref
TABLE 1. SPEC 2006 multiprogrammed mixes
High Medium Low
lbm, mcf, milc, soplex, bzip2, zeusmp, cactus, leslie3d perlbench, gcc, gromacs, namd, gemsFDTD gobmk, calculix hmmer, h264ref, omnetpp, astar, sphinx3
TABLE 2. Writes to PCM per instruction categories
Page size 4KB Row size 64 Bytes Chips per rank 8 Bit lines per chip x8
Lifetime distribution N(µ= 108, σ= 2.0·107)
Pages 2000
TABLE 3. Memory endurance simulator parameters.
that have been discarded from the system.
w=BF P ·#starting pages
#alive pages (3)
Then, according to the characterization obtained from
gem5, we start simulating writes to the cells. At some point in timeta cell will wear out, the page containing it is discarded, the simulator updates the #alive pages
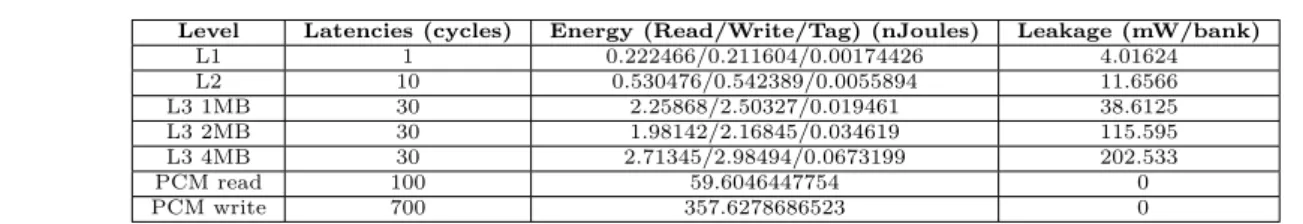
and the wear rate accordingly, and the simulation proceeds until all pages are discarded. As a result of this simulation, a curve is generated that shows the amount of memory available (expressed in percentage of available pages) as a function of the number of writes. Energy model: Finally, we should mention that in the evaluation section we will show results about energy consumption in the memory hierarchy4, following
a model that includes both dynamic and static contributions. The static component is calculated using CACTI 6.5 [34, 35], which reports a leakage number for each cache level. In the case of the main memory, as it is built with PCM technology, the static power can be considered as negligible. Thus, adding the power contributions of each cache level, we obtain the total static power consumed in the memory hierarchy. Finally, we multiply that number by the execution time of the program to obtain the total static energy consumed in the execution of that application. In the case of the dynamic component, we again use CACTI 6.5 for determining the dynamic energy consumption per access to each cache level, whereas for computing
4In the energy consumption analysis we do not account for the implementation overhead of the replacement policies, which, according to the analysis from Section 6.4.2, constitutes a reasonable approximation. In any case, including this overhead in the energy study would be beneficial to our interests.
the dynamic energy consumption associated with the accesses to main memory we follow [15], employing 1J/GB and 6J/GB per PCM read and PCM write respectively (Table 4 includes data regarding latencies and energy consumption per memory hierarchy level). Then, the equation employed to determine the dynamic energy consumption in the memory hierarchy is:
Dynamic Energy= n X i=1 (RHLi∗RELi+W HLi∗W ELi+ (RM Li+W M Li)∗(T ELi+W ELi))+ +RP CM∗REP CM+W P CM∗W EP CM
wherenis the amount of cache levels, RHLiand WHLi
denote the number of read and write hits in cache leveli, RMLi and WMLi denote the number of read and write
misses in cache level i, RPCM and WPCM correspond to the amount of reads and writes to PCM, REPCM and WEPCM denote the energy consumption per read and write to PCM and finally RELi, WELi and TELi
correspond to the energy consumption of a read, a write and a tag array consult in cache leveli.
6. EVALUATION
This section is divided into four parts. In Section 6.1 we evaluate how classicalperformance-orientedpolicies behave in terms of the amount of writes they involve. Sections 6.2 and 6.3 assess the effectiveness of our proposed LLC replacement policies and that of other
write-awarepolicies in cutting the write memory traffic and extending the memory lifetime in single-core and multi-core environments respectively. Finally we also report some additional results in Section 6.4. Note that throughout this section, when providing results about writes, we refer to LLC-to-memory writebacks (recall that we do not deal with writes from the disk to memory) at a block-level. Note also than the y-axis in all charts displayed in this section does not start from 0. Instead, we opted to start it from other different values in order to properly explode the differences among the various policies evaluated.
Level Latencies (cycles) Energy (Read/Write/Tag) (nJoules) Leakage (mW/bank) L1 1 0.222466/0.211604/0.00174426 4.01624 L2 10 0.530476/0.542389/0.0055894 11.6566 L3 1MB 30 2.25868/2.50327/0.019461 38.6125 L3 2MB 30 1.98142/2.16845/0.034619 115.595 L3 4MB 30 2.71345/2.98494/0.0673199 202.533 PCM read 100 59.6046447754 0 PCM write 700 357.6278686523 0
TABLE 4. Latencies and Energy Consumption
6.1. Performance-oriented policies
In this section we evaluate the behavior of conventional and recently proposed performance-oriented cache replacement policies when applied to the LLC regarding the number of dirty blocks evicted from this level, which corresponds to the amount of writes to main memory that each algorithm involves. Notably, we evaluate LRU, RANDOM, SRRIP, DRRIP, SHiP – in combination with SRRIP, as done in the original paper [9]– and peLIFO policies using the SPEC CPU2006 benchmark suite. Figure 10 illustrates the corresponding amounts of writes to memory normalized to the LRU baseline. Note that the figure shows results per benchmark as well as the geometric mean obtained. From the figure we observe that DRRIP ranks only second to LRU as the policy that on average delivers the lowest number of writes to main memory, although DRRIP outperforms LRU for most applications. 6.2. Write-aware policies in a single-core
scenario
In this section we deeply analyze the behavior of our proposed LLC replacement policies and other algorithms in a PCM-based system within a single-core scenario. First, we explore the isolated contribution of each of our proposals and, based on this evaluation, we justify the decision of reporting results from just some of our policies, which we consider as representative, along this section. Then, we report data about the number of writes to memory and endurance that each evaluated proposal involves as well as the performance delivered. Besides, being energy consumption one of the main motivations for adopting PCM as main memory technology, we also include results about the involved energy consumption in the memory hierarchy according to the model detailed in Section 5. Finally, we expose a brief discussion about the trade-off between the memory endurance and the performance that the evaluated policies deliver.
6.2.1. Contribution of each proposed change
The various modifications we have proposed over original DRRIP impact the write memory traffic differently. Figure 11 quantifies this impact for each change isolated and also when we combined them. First, we observe that modifying the insertion sub-policy by changing the criteria that rules the Set Dueling
mechanism (SD label) reports low reductions (around 1%) in the amount of writes to memory. Second, the impact of our promotion sub-policies is also limited. The low, medium and high-aggressive versions (PL, PM and PH respectively) only manage to cut the write traffic to memory between 0.5 and 1.5% with respect to DRRIP. Third, thevictimizationsub-policies clearly report the major benefits. Notably, VL, VM and VH are able to reduce the amount of writes generated by original DRRIP by around 10, 24 and 32% respectively. Therefore, we arrange our proposals into
high-aggressive, medium-aggressive and low-aggressive
categories depending on whether they include the VH, VM or VL label respectively. It is worth to note that when different sub-policies are combined, in some cases the writes reduction achieved is higher than that we would expect considering their isolated contributions.
Next we explain the criteria followed to choose the most representative policies across the board (highlighted in Figure 11 with green bars and north-east lines). First, we discarded all policies that do not reduce the write traffic to memory with respect to conventional LRU. We also ruled out most of the algorithms that achieve modest writes reductions at the expense of performance drops. Finally, among those policies reporting similar results in both amount of writes to memory and performance, we pick one of them within each group. As a result, we choose just one algorithm from each class of victimization sub-policies (i.e., VH, VM and VL) combined with one of the three possible promotion sub-policies (the best performing one in each case, either PH, PM or PL) and with the SD insertion sub-policy. Notably, we choose PM-VH-SD, PM-VM-SD and PL-VL-SD.
From now on, in all the following figures and for each evaluated policy we report the geometric mean of the normalized metrics (writes reduction, endurance, performance and energy consumption in the memory hierarchy) with respect to LRU considering both all the benchmarks (we labeled asAll) and only the most memory-intensive programs (we labeled as memory-intensive). The rationale behind including this group of applications with high memory footprints is twofold: first, to reveal potential biased values in the All
numbers due to programs in which the amount of writes is so low that minimal writes reductions in absolute values lead to high percentage numbers, polluting the All number, and second, to stress the benefits
400.p erlb enc h 401.bzip2 403.gcc 429.mcf 433.milc 434.zeusmp435.gromacs 436.cactusADM
437.leslie3d444.namd445.gobmk450.soplex454.calculix456.hmmer 459.GemsFDTD 464.h264ref 470.lbm 471.omnetpp 473.astar 482.sphinx3 gmean 0.8 1 1.2 1.4
DRRIP peLIFO Random SRRIP SHiP
FIGURE 10. Writes to main memory normalized to LRU for performance-oriented policies: SPEC CPU2006 suite. hmmer
andastar applications report numbers ranging between 7 and 16x for most policies.
DRRIP PM-VLVL-SDPL-VL VL VH-SDPH-VH PM-VH PM-VH-SD PL-VH PL-VH-SD VH PH-VL PH-VM PH-SD PH PM-VL-SD PM-VM PM-SD PM VM-SD PH-VM-SD VM SD PL-SD PL-VM PL-VM-SD PL PL-VL-SD PH-VH-SD PM-VM-SD PH-VL-SD 0.7 0.8 0.9 1
FIGURE 11. Amount of writes to main memory normalized to LRU: contribution of each proposed policy.
derived from our techniques over those applications that, performing high amounts of writes to memory, are more harmful to PCM lifetime. In order to define this second group of applications, we sort all the programs according to the WPI values exhibited in the baseline policy, and, starting from the benchmark with the highest WPI, we pick applications until the accumulated WPI of the selected programs reaches at least the 75% of the total WPI obtained when considering all applications. In the experimental setting we employ in this section, thememory-intensivegroup is conformed bylbm,mcf,milc andsoplex.
Note that in this scenario we also report the geometric mean of the evaluated metrics when all the applications except thesphinx3 program are considered (we label this group asAll w/o sphinx3). The reason for this is that this application exhibits an special behavior that may lead the evaluated metrics to be somehow biased. Notably, while for the rest of applications the evaluated policies are able to reduce the amount of writes to memory by a factor ranging from 1 to 2X, forsphinx3 many policies under evaluation are able to cut the write traffic to memory in an unusually large
fashion (up to a hundredth part, 100X).
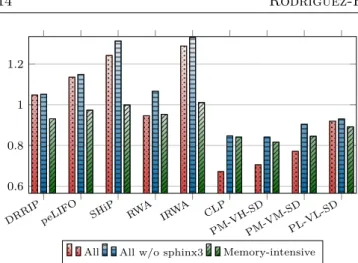
6.2.2. Amount of writes and Endurance
Figure 12 illustrates the number of writes to main memory generated by different proposals: from left to right we show results of some performance-oriented
policies (DRRIP, peLIFO and SHiP), some previously proposed write-aware approaches (RWA, IRWA and CLP) and –ordering by decreasing aggressiveness– our chosen algorithms.
First, as shown, all our proposals significantly outperform original DRRIP. Second, they also exhibit higher ability in cutting the write traffic to main memory than other write-aware policies (RWA and IRWA and similar to that of CLP). The rationale behind the deficient behavior of both RWA and IRWA is twofold: 1) they are based on SRRIP instead of DRRIP, which implies a higher number of writes as Figure 10 illustrates, 2) they do not modify the SRRIP victimization sub-policy, that, as demonstrated in Section 6.2.1, constitutes the sub-policy with the highest impact (Section 6.2.1). CLP reduces the amount of writes by around 33% and
CLP IRW A peLIF O RWA SHiP DRRIP PM-VM-SDPL-VL-SD PM-VH-SD 0.6 0.8 1 1.2
All All w/o sphinx3 Memory-intensive
FIGURE 12. Amount of writes to main memory normalized to LRU: SPEC CPU2006 suite.
15.3% when sphinx3 is considered or not respectively, while the best-performing of our proposals (PM-VH-SD) reaches the 30 and 16% respectively. Third, the three performance-oriented policies augment the number of writes compared to LRU. Fourth, zooming into thememory-intensive programs, we observe that, although the results follow a similar tendency, the differences among policies get reduced5. Besides, our
most aggressive policy even improves CLP for these applications.
Next, according to the model detailed in Sec-tion 3.2.1, we show how the achieved reducSec-tions in writes to memory translate into extensions of the PCM lifetime for each evaluated proposal. Notably, Table 5 illustrates the memory lifetime improvement (percent-ages) with respect to LRU.
As shown, the trends observed in the values of memory lifetime extension closely follow those observed for the writes reduction numbers when considering all applications. This is due to the fact that the ratios between the BFP of each evaluated policy and that of LRU, which modulates the contribution of the writes reduction factor to the memory endurance extension number as shown in Equation 2, are very similar across the board. Notably, the average of dirty words per writeback when considering all applications ranges between 5.95 in SHiP and 5.62 in PM-VM-SD, exhibiting LRU a value of 5.86, which implies BFPs ratios in the range 1.02-0.95. This makes the writes reduction number the major contribution to the memory improvement obtained. However, those policies exhibiting a BFP value lower than that of LRU obtain an additional memory lifetime improvement. Thus, PM-VM-SD, reducing 6% less memory writes than CLP when considering all applications except
sphinx3, is able to almost match its endurance extension (17.1% vs 17.6%) since the geomean of the ratios between BFP and the BFP of LRU is 0.94 in our
5The percentages of writes reduction exhibited by most
write-aware policies decrease for the memory-intensive programs (as
analyzed in Section 6.4.1, this occurs even for an optimal policy).
proposal while it is just 1.0 in CLP. When considering the memory-intensive programs, the memory lifetime improvements observed are further below from the values of writes reductions than when all applications are considered. This is due to the fact that the ratios obtained between the BFPs of the evaluated policies and that of LRU are higher than 1 across the board (up to 1.06 in the case of CLP), hence reducing the memory endurance extensions achieved. For these programs the average of dirty words per writeback is moderately lower, ranging from 3.9 in LRU to 4.17 in CLP.
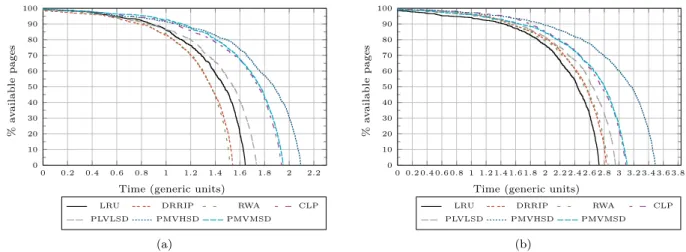
In order to visually observe the memory lifetime improvements achieved, we use the memory endurance simulator detailed in 5, which reports the amount of memory available (expressed in percentage of available pages) as a function of the number of writes. We apply the change of variable in the x-axis from number of writes to time (expressed in generic units). Figure 13 illustrates the curves obtained when considering both all the applications except sphinx3 and the
memory-intensive programs. We observe how in
both cases our PM-VH-SD policy reports the highest amount of memory available for a given time. For instance, when considering all applications except
sphinx3, after 1.8 billions of programs execution PM-VH-SD maintains around 58% of pages surviving while CLP just maintains around 42%. Note that for the sake of clarity we omit some proposals (peLIFO, SHiP and IRWA) that do not provide satisfactory results according to Table 5.
Note also that the time reached for the memory-intensive programs until the whole memory fails is higher than that of all the applications, since, although the amount of writes performed is higher, the average of dirty words that exhibit the writebacks in this kind of applications is significantly lower than when considering all applications.
6.2.3. Performance
Although our prime goal is to extend the PCM lifetime, it is clear that a proposal meeting this requirement could not be adopted if it comes at the expense of a significant performance drop. In order to further evaluate the benefits that each policy reports, Figure 14 shows the performance (execution time) delivered.
First, we observe that most of our DRRIP-based proposals almost match the execution time of original DRRIP and even some of our algorithms –those including a medium-low victimization sub-policy (VM or VL)– manage to outperform it. Second, all our proposals outperform the other write-aware policies (especially RWA and IRWA, which significantly degrade performance, 4.1 and 10.2% over LRU respectively).
Third, the two most aggressive policies in reducing the amount of writes to memory (CLP and PM-VH-SD) do provide a moderately satisfactory trade-off with performance since they all penalize it around 1-2%,
Benchs/Policies DRRIP peLIFO SHiP RWA IRWA CLP PM-VH-SD PM-VM-SD PL-VL-SD
All/All w/o sphinx3 -5.9/-6.3 -11.5/-12.2 -20.9/-24.9 5.4/-7.2 -23.1/-25.1 49.1/17.6 41.4/19.0 36.3/17.1 7.4/6.5
Memory-intensive 2.0 0.9 -3.7 3.6 -4.2 11.9 16.1 11.6 5.8
TABLE 5. Memory lifetime improvements (percentages) with respect to LRU: SPEC CPU2006 suite.
0 0.2 0.4 0.6 0.8 1 1.2 1.4 1.6 1.8 2 2.2 0 10 20 30 40 50 60 70 80 90 100
Time (generic units)
%
a
v
ailable
pages
LRU DRRIP RWA CLP PLVLSD PMVHSD PMVMSD (a) 0 0.2 0.4 0.6 0.8 1 1.2 1.4 1.6 1.8 2 2.2 2.4 2.6 2.8 3 3.2 3.4 3.6 3.8 0 10 20 30 40 50 60 70 80 90 100
Time (generic units)
%
a
v
ailable
pages
LRU DRRIP RWA CLP PLVLSD PMVHSD PMVMSD
(b)
FIGURE 13. Available memory vs time for SPEC CPU2006 suite: (a) All, (b) Memory Intensive.
CLP IRW A peLIF O RWA SHiP DRRIP PM-VM-SDPL-VL-SD PM-VH-SD 0.95 1 1.05 1.1
All All w/o sphinx3 Memory-intensive
FIGURE 14. Execution Time normalized to LRU: SPEC CPU2006 suite.
depending on considering the sphinx3 program or not. Intuitively, we would expect that this performance penalty was higher. Therefore, it is worth to note the key factors that may affect the performance delivered by the variouswrite-aware approaches. Note that two opposing factors turn up:
1)Our proposed replacement algorithms are mainly focused on reducing the amount of dirty blocks evicted, being partially unaware of the consequent impact on performance, so it would be expected to lead to an increase on the number of read misses, hence augmenting the amount of accesses to main memory and hurting performance. However, our results reveal that for the PM-VH-SD policy –our algorithm achieving the highest reduction of writes to memory– the amount of LLC read misses in 8 out of 20 benchmarks decreases with respect to LRU. In fact, in the original DRRIP
algorithm (the policy our schemes are based on) more than half of the benchmarks exhibit a lower amount of LLC read misses than LRU. The rationale behind this decrease in the amount of LLC read misses is that the temporal locality has been almost totally filtered at the LLC by the lower cache levels, thus a policy focusing only on temporal locality exploitation, like LRU, may provide poor results at this level of the hierarchy for some applications. Overall, the total amount of read misses in L3 considering all applications (and hence the events of read queue filling) has slightly increased in our proposals compared to LRU. This makes the net contribution on performance essentially negligible for our proposals.
2) Conversely, reducing the number of writes to memory reduces the pressure over the write queues, which leads to performance improvements (as explained in Section 5, once the corresponding write queue is full, the application stalls when a writeback from the LLC occurs). As for the write queues filling, our results illustrate that in the LRU baseline only in 8 out of 20 programs some write queue fills up at least once. For these 8 benchmarks, PM-VH-SD is able to significantly reduce the chances of filling up write queues and therefore mostly cancel the performance drops associated with the higher LLC read misses observed in 6 of these programs. For the remaining two applications (soplex andh264ref), as the amount of LLC read misses is also lower than that of the baseline, performance improvements of 16 and 5% respectively are delivered.
Fourth, among the performance-oriented policies, DRRIP and peLIFO provide satisfactory results (as expected) while SHiP surprisingly exhibits the second