Consumers’ Expectation and Perception toward Mobile
Telecommunication Usage in Bangladesh
Md. Ashraful Alam
1*, Debashish Roy
2, Rehana Akther
31Lecturer, Department of Human Resource Management, University of Chittagong, BANGLADESH 2Assistant professor, Department of Business Administration, Metropolitan University, BANGLADESH 3Lecturer, Department of Business Administration, BGC Trust University, BANGLADESH
*E-mail for correspondence: [email protected]
Received: Mar 9, 2016 Accepted: Mar 16, 2016
ABSTRACT
Recently telecommunication sector like the mobile phone has made a revolution in the world. For the last few years, it has become part and parcel of our daily life. Business, commerce, and society cannot go out without the use of mobile phone. With the continuous diversification, the use of mobile is not only limited to talking, but its use ranges from using internet, sending messages, listening to music, to organizing various works are comfortably completed in time. City Cell Company introduced the use of mobile phone in Bangladesh in the middle of 1989 .Now with the lapse of time; another five operators have in the market. The mobile operators need to understand well, the perceptions of service quality of customers and their expectations. The study “Consumers’ expectations and perception toward mobile telecommunication usage in Bangladesh” attempts to analyze the gap in telecom sector regarding customers’ expectations and perceptions. It is important to investigate the differences which may provide scope for improvement of mobile service operators. Descriptive analysis, cross tabulation, Chi-square, frequency distribution was used to test the collected data and hypotheses of the research study. The study concludes that, given the severe competition in the business arena where mobile operators have to stay alive and breed by pricing strategy, network facilities, and promotional activities. Telecom companies will have to focus on the reduction of the gap in customer expectations and perceptions about their service quality if they are to race internationally. Hence, mobile operators should continually assess and reassess how customers perceive their services and to implement appropriate corrective action for retaining the existing customers and getting new customers.
Keywords: Mobile telecommunication, Consumers’ Perception, Consumers’ expectation, price, promotion
I
NTRODUCTIONBangladesh is one of the poorest, most densely populated, least developed countries in the world. Apart from its lowly economic status, major impediments to growth have included frequent cyclones and floods and the slow implementation of much-needed economic reforms. The country also has a reputation for the inefficiency of its state-owned enterprises. Growth of the mobile internet customer base is expected to continue into 2016 and 2017. Present scenario of mobile phone subscribers in Bangladesh is like follow:
The total number of Mobile Phone Subscribers is as follow at the end of January, 2016
The Mobile Phone subscribers are listed below:
Operator Subscriber
(in Millions)
Grameen Phone Ltd. (GP) 56.204
Banglalink Digital Communications Limited 32.368
Robi Axiata Limited (Robi) 27.795
Airtel Bangladesh Limited (Airtel) 10.510
Pacific Bangladesh Telecom Limited (Citycell) 0.867
Teletalk Bangladesh Ltd. (Teletalk) 4.211
Total 131.956
Source: www.btrc.gov.bd * Subscribers in Million
**The above subscribers' numbers are declared by the mobile operators
For the month of January, 2016
Customer perception defines the way that customer usually view or feed about certain services and products. It relates to customer satisfaction which is the expectation of the customer towards the product/service. Telecommunication services providers are of paramount importance to both developed and emerging economic in the world. With stiff competition between the mobile operators, customer satisfaction is a necessity for survival in the market. Many telecommunication services providers are offering various products and services in the market. Customer perception is a personal feeling of either pleasure or disappointment resulting from the evaluation of service provided by an organization to an individual about expectations.
Meeting and exceeding expectations of clients and customers that means delighting, is a viewpoint that has gained most attraction. This concept is all inclusive and cuts across service domains, but expectations change and
experiences with alternate service providers could shape the customers’ expectations. The research gap here is attaining customers’ expectation towards a particular service. A gap is a difference, imbalance or disparity which is determined to exist between customers’ perception of firm performance and their prior expectation.
Rahman Sabbir, Haque Ahasanul, Ahmad Mohd Ismail Sayyed (2011), in their study “Choice Criteria for Mobile Telecom Operator: Empirical Investigation among Malaysian Customers” investigated the choice criteria for a mobile phone operator in the Malaysian Mobile Telecom market by the customers. The outcome of this research shows a comprehensively integrated framework in which to understand the close relationships among several dimensions of service quality, price, and brand image to have a handful idea on the consumers’ perceptions.
Rahman Dr. Muhammad Sabbir, (2012), in his study “Service quality, corporate image and customers’ satisfaction towards customers perception: An exploratory study of telecom customers in Bangladesh” aimed at the determinants that are significantly influencing telecom customers’ in Bangladesh. The study revealed that most of the telecom customers are highly concerned about service quality followed by corporate image
O
BJECTIVES OF THES
TUDYThe prime purpose of the research is to identify consumers’ expectation and perception from mobile phone companies in Bangladesh. To emerge the objective some other supporting objectives are:
To investigate the nature influencers in the selection of mobile operators.
To appraise the impact of promotional offers.
To justify the impact of network facility on consumers’ expectation.
To see a relation between satisfaction on network availability and connection type.
L
ITERATURER
EVIEWLeisen B, Vance C,(2001), in their research paper “Customer satisfaction, Globalization, International Trade, Service Quality, Strategy, Telecommunication Industry” examined the strategic implications of service quality dimensions about customer satisfaction in a cross- cultural study of telecommunication service provision in Germany and the USA. Significant differences found between the two countries regarding the relative importance of particular service dimensions.
According to Leisen and Vance (2001), service quality helps to create the necessary competitive advantage by being an effective differentiating factor. Service quality was initiated in the 1980s as the worldwide trend when marketers realized that only a quality product could not be guaranteed to maintain competitive advantage (Wal et al., 2002). However, competitive advantage by firms is a value-creating strategy; simultaneously potential competitors were not able to implement it (Barney, 1991). As a result, service quality can be used as a competitive advantage
which is related to customers’ satisfaction and also leads to consumer loyalty and future purchase (Johnson and Sirikit, 2002).
In particular customers prefer service quality when the price and other cost elements are held constant (Boyer and Hult, 2005). It has become a distinct and significant aspect of the product and service offering (Wal et al., 2002). Moreover, according to them, a competitive advantage also sustained when other companies are unable to duplicate the benefits of this strategy. Service quality is essential for a telecommunication service provider company to ensure the quality service for establishing and maintaining loyal and profitable customer (Zeithaml, 2000; Leisen and Vance, 2001). Conversely, Johnson and Sirikit (2002) state as service delivery systems has the ability to allow managers of the company to identify the real customer feedback and satisfaction on their telecommunication service. Quality reflects the customers’ expectations about a product or service. Lovelock (1996) stated that this customer driven quality replaced the traditional marketing philosophies which were based on products and process. Service quality is different from the quality of goods. Since, services are intangible, perishable, produced and consumed simultaneously and heterogeneously (Zeithaml and Bitner, 2000).
Lehtinen & Lehtinen (1991) suggest that quality cultivates during two-way interaction between service providers and customers. According to them, there are three dimensions: physical quality includes the tangible aspect of the service; the corporate quality which involves the company’s image and interactive quality which originates from an interaction between customer and service provider. (Lehtinen & Lehtinen 1991) Has observed that service quality has two dimensions – process and output. Process quality emphasizes in the way service is catered to a consumer and output quality is judged once service is provided. Evaluation of service process plays a vital role in building the perception of consumers. Process quality is evaluated while the service is being provided and the outcome is evaluated once it is provided.
Perceived quality is a kind of attitude that results from a comparison of expected service with perceived service. It is a consumer’s verdict developed about the superior performance of the service (Gi-Du Kang, 2006). Expected service originates from the word of mouth communication, personal needs, and past experiences. Expected services are the desires, wants of a consumer i.e. what they feel that service should offer rather than would offer. A perceived service is the outcome of external communication to consumer and service delivery process. According to Parasuraman et al. (1985), service quality depends on the incongruity between expected services and perceived services.
Price plays a vital role in telecommunication market especially for the mobile telecommunication service providers (Kollmann, 2000). It includes not only the buying price but also the call and rental charges. A price-dominated mass market leads to customers having more choices and
opportunities to compare the pricing structures of diverse service providers. A company that offers lower charges would be able to attract more customers committing themselves to the telephone networks, and hence, a significant number of “call minutes” might be achieved. According to Kollmann (2000), income from the number of call minutes determines the commercial success for the network providers. He also added that the success of the telecommunication sector in a market largely depends on continuing usage and pricing policies, which need to be considered on several levels. Draganska and Jain (2003) stated that a strategy for a company extending their product or service is to differentiate their offerings vertically. In this era of information age, price competition has become cutthroat in the mobile telecommunication industry. Trebing (2001) mentioned that there are three sets of strategies for pricing behavior. The first is entry limit pricing, which is used for protection of the market position of the firm; a second is the high access charges for new entrants, and the third one is tie-in sales to write off the old plant or standard tie-investment against captive customers. According to the author, entry limit pricing involves setting low prices in highly flexible markets to attract or retain large customers with monopolistic buying power, while maintaining high prices in inelastic markets. Consumer research over the past three decades has documented the persistent impact that price has on consumer perceptions of a product (Janakiraman et al., 2006; Vanhuele et al., 2006). Customers in telecommunication industry have preconceived notions about the price and value of telecommunications services. Customers have historically complained about the level of local charges, more than they have about long distance; although, local service is frequently offered at a price lower than actual cost. When long-distance service is priced well over cost, and local service is priced well under cost, customers expect to pay very low prices for local services and apparently do not mind that long distance could be less expensive but is not (Strouse, 1999)
Consumer’s perception of product quality is always an important aspect of a purchasing decision and market behavior. Consumers regularly face the task of estimating product quality under conditions of imperfect knowledge about the underlying attributes of the various product offers with the aid of personal, self-perceived quality criteria (Bedeian, 1971 adapted by Sjolander, 1992). According to Sjolander (1992), the consumer behavior in the modern market is different from the theoretical case of consumer decision making in free markets. Generally, free and competitive markets are composed of buyers and sellers each of whom must possess perfect information about all possible products and their respective utilities; a well defined and explicit set of performances; the ability to determine optimal combination of various products given their budget constraints; a knowledge of prices, which does not affect the subjective wants or satisfaction of the consumer (Monroe and Petroshius, 1973 adapted by Sjolander, 1992). It is necessary to define quality in the first place before it can be measured. There is no global
definition of quality exists (Sebastianelli and Tamimi, 2002), it can be defined in varieties of ways. Yoon and Kijewski (1997) pointed out that quality can be categorized into two perspectives. One is the marketer’s perspective, which is product-based or manufacturing-based and the other one is consumer’s perspective, which is user-based or value-based. Product quality from the marketer’s perspective is associated with feature, function or performance of a product. On the other hand, product quality from the consumer’s perspective is associated with the capacity of a product to satisfy consumer needs (Archibald et al., 1983). According to Lambert (1980), consumers often attribute the quality to branded products on the basis of price, brand reputation, store image, market share, product features and country of manufacture. So, price is an indicator to measure the product quality, which is based on the theory that quality is a measure of the utility, or the want-satisfying capacity of products (Sjolander, 1992). The author has also added that the more the quality a product possesses, the more the utility it contains, and the higher the price it will obtain in an open market exchange. This means that similar products offered to the market at different prices, contain different amounts of utility, and that there is a direct relationship between quality and price. The actual price-quality relationship is a complex interaction between price, brand name, store image, product features, and brand awareness (Lambert, 1980; Gerstner, 1985). Oliver (1993) identified a few major elements that differentiate between service quality and satisfaction. It was suggested that, the dimensions that comprise quality judgments are quite specific to the service delivered. As for satisfaction, it can be determined by a broader set of factors including those which are outside the immediate service delivery experience (e.g. a mobile phone subscribers satisfaction depend on his/her mobile phone operators may be influenced by whether his/her need; mood on that particular day when that consumer want to purchase a line). Ting (2004) indicated that perceptions of service quality do not depend on experiences with the service environment or service providers, while judgments of satisfaction depend on past experiences. He also mentioned that quality is believed to be determined more by external cues (e.g. price, reputation) whereas satisfaction is more driven by conceptual cues (e.g. equity, regret).
M
ETHODOLOGY OF THES
TUDYPopulation and sampling design: The data were collected
from different areas of Dhaka, Sylhet, Rajshahi, and Chittagong divisions from December, 2015 to February, 2016. The sample size was 150 and sampling method adopted was a combination of Judgmental and Simple Random Sampling.
Sample characteristics: The respondents were chosen irrespective of gender, age, income, education, occupation, religion, location. All the interviewed respondents were the subscriber of different mobile phone operators.
Instrumentation: The instrument used for data collection
was a questionnaire developed to assess consumers’ expectation and perception toward telecommunication usage. To measure the responses of the respondents a five- point scale of strongly agree (5), Agree (4), Neutral (3), Disagree (2) Strongly disagree (1) were used.
Data analysis: Cross tabulation, Chi-square, and
frequency distribution were used for analyzing the data. For, sharp outcome of those analyses, Statistical software, SPSS was used.
Reliability: Cronbach's alpha is a measure of internal
consistency, that is, how closely related a set of items
are as a group. It is considered to be a measure of scale reliability. In this study, the alpha value was found 0.739 which is a good indicator.
H
YPOTHESES OF THES
TUDYH1: There is no relationship between gender of the
respondents and influencer in mobile operator selection
H2: There is no relation between factors affects mobile
phone subscription and gender of the respondents H3: There is no relationship between connection type
and price based satisfaction
H4: There is no relation between internet related service
satisfaction and connection type
H5: There is no relation between satisfaction on network
facility and connection type
H6: There is no significant relationship between
connection type and promotional offers based satisfaction
D
ATAA
NALYSIS ANDS
URVEYF
INDINGSTable 1: Demographic information of the respondents
Frequency Percent Valid Percent Cumulative Percent
Gender male 106 70.7 70.7 70.7 female 44 29.3 29.3 100.0 Total 150 100.0 100.0 Age 15-20 years 19 12.7 12.7 12.7 21-25 years 98 65.3 65.3 78.0 26-30 19 12.7 12.7 90.7 30-35 9 6.0 6.0 96.7 36-40 5 3.3 3.3 100.0 Total 150 100.0 100.0
Monthly family income less than tk. 10,000 15 10.0 10.0 10.0 Above tk. 10,000-20,000 21 14.0 14.0 24.0 above tk. 20,000-30,000 41 27.3 27.3 51.3 above tk. 30,000-40,000 26 17.3 17.3 68.7 above tk. 40,000-50000 18 12.0 12.0 80.7 above tk. 50,000 29 19.3 19.3 100.0 Total 150 100.0 100.0 Marital status single 117 78.0 78.0 78.0 married 33 22.0 22.0 100.0 Total 150 100.0 100.0 Educational level primary 5 3.3 3.3 3.3 secondary 3 2.0 2.0 5.3 higher secondary 32 21.3 21.3 26.7 graduate 94 62.7 62.7 89.3 post graduate 15 10.0 10.0 99.3 others 1 .7 .7 100.0 Total 150 100.0 100.0 Occupation business 26 17.3 17.3 17.3 service 15 10.0 10.0 27.3 student 103 68.7 68.7 96.0 house wife 4 2.7 2.7 98.7 others 2 1.3 1.3 100.0 Total 150 100.0 100.0
Table 2: Satisfaction level of the respondents
Satisfaction level means Std.
Deviation
Percentage of response
Highly
dissatisfied Dissatisfied Neutral Satisfied Highly satisfied By price (SIM price, call/
video call charges, etc.) 3.2133 .87919 5.3% 8 12% 18 40.7% 61 40% 60 2% 3 By internet packages,
charges and services 2.9800 .99306 10% 15 18% 27 38% 57 32% 48 2% 3 By network facilities 3.3733 .76454 3
2% 8.7% 13 42% 63 44.7% 67 2.7% 4 By customer care service 3.3267 .77283 1
0.7% 12.7% 19 44% 66 38.5% 58 4% 6 By various promotional offers 3.3067 .80223 5
3.3% 8.7% 13 44.7% 67 40.7% 61 2.7% 4 Table-2 shows the satisfaction levels of respondents on
the basis of different criteria. It is found that satisfaction level on the basis of price is almost moderate (mean value 3.2133). The amount of highly dissatisfied or highly satisfied is not noteworthy. 40% respondents implied that they were satisfied with the SIM price, voice and video call charges where as 40.7% respondents took a neutral position.
The internet is now the part and parcel of mobile phone subscription. While examining the satisfaction level of respondents for internet packages, charges, and service, the mean value of the responses was found 2.9800 which indicate that respondents are merely dissatisfied in regarding of internet service provided by the operators.
The reasons for that were identified by researchers through focus group discussion with respondents. The prominent reason are- unclear promotional messages, high price, and slow network speed.
Respondents’ satisfaction level is relatively high in case of network facilities. 42% provided neutral response where 44.7% respondents stated that they are satisfied with current network facilities. Focus group discussions revealed that increased competition among the service providers is the dominant factor for improved network facility.
Respondents’ customer care service experience is also pleasing. Though 44% took a neutral position, 38.5% were satisfied, and 4% were highly satisfied with customer care services. Only 12.7% of the respondents were dissatisfied with customer care service. A negligible 0.7% was highly dissatisfied.
All mobile operators provide different promotional offers to attract and retain their customers. It is found in the study that a significant number of respondents were satisfied with those promotional offers. Focus group discussion with respondents identified that due to severe competition most of the operators give different innovative and attractive promotional offers.
Table 3: influencer in mobile operator Selection
Factors influenced you in choosing mobile phone operator Family Total Chi-Square
members friends relatives Advertisement dealers/ retailers Gender Male 29 55 10 7 5 106 Value-13.870S (Sig 0. 008) 27.4% 51.9% 9.4% 6.6% 4.7% 100.0% Female 54.5% 24 38.6% 17 .0% 0 6.8% 3 .0% 0 100.0% 44 Total 35.3% 53 48.0% 72 6.7% 10 6.7% 10 3.3% 5 100.0% 150 S=significant
Table 3 shows the influence of respondents’ mobile operator selection. It is found in the study that females (54.5%) are more influence by family members than male (27.4%) respondents. Male respondents are mainly influenced by their friends (51.9% of the total male respondents). The overall influences of dealers/retailers
are little (only 3.3%). Since P-value is found 0.008 at 5% level of significance researchers reject the H01 and came to a conclusion that there is a relationship between gender of the respondents and influencer in mobile operator selection.
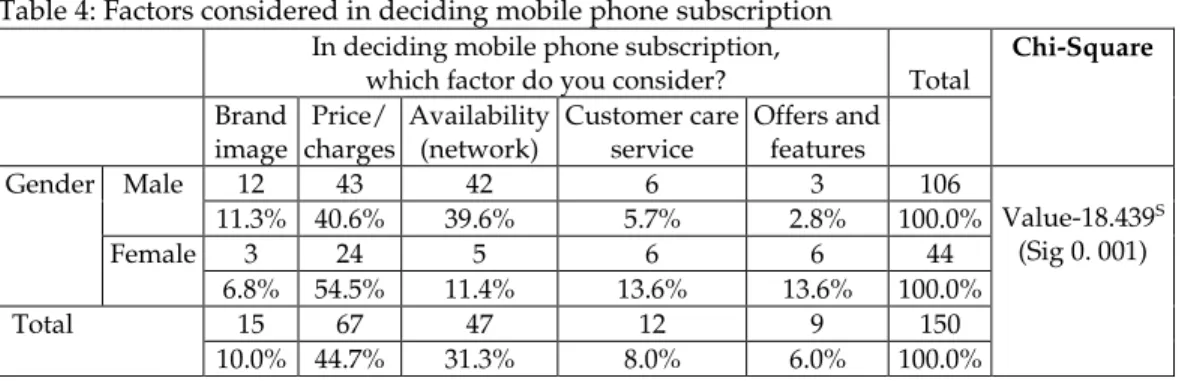
Table 4: Factors considered in deciding mobile phone subscription In deciding mobile phone subscription,
which factor do you consider? Total
Chi-Square
Brand image charges Price/ Availability (network) Customer care service Offers and features Gender Male 12 43 42 6 3 106 Value-18.439S (Sig 0. 001) 11.3% 40.6% 39.6% 5.7% 2.8% 100.0% Female 6.8% 54.5% 3 24 11.4% 5 13.6% 6 13.6% 6 100.0% 44 Total 10.0% 44.7% 15 67 31.3% 47 8.0% 12 6.0% 9 100.0% 150 S=significant
Customers consider various factors in deciding mobile phone subscription. Table-4 shows that 44.7% of total respondents consider the price (call rate or SIM) for selecting their subscription. It is found in the study that female respondents more about customer care services and offers, features than male. However male
respondents pay attention to network availability after price. The p-value is found for Chi-square test is 0.001 at 5% level of significance that is why H02 is rejected. Researchers accepted the alternative hypothesis and concluded that gender of the respondent and mobile subscription factors are related.
Table 5: Price based satisfaction and Connection type (cross tabulation) Your satisfaction level, by price (SIM price,
call/video call charges, etc.) Total
Chi-Square dissatisfied Dissatisfied Neutral Satisfied Highly satisfied Highly
Connection Type Prepaid 7 17 51 53 3 131 Value-2.078NS (Sig 0.721) 5.3% 13.0% 38.9% 40.5% 2.3% 100.0% postpaid 5.3% 1 5.3% 1 52.6% 36.8% 10 7 .0% 100.0% 0 19 Total 5.3% 8 12.0% 18 40.7% 40.0% 61 60 2.0% 100.0% 3 150 NS= not significant
It is found in the study that prepaid subscribers are more satisfied than post paid subscribers (Table 5). None of the post paid customers were found highly satisfied whereas a majority of the post paid customers took a neutral
position (52.6%). The H03 (there is no relationship between connection type and price based satisfaction) is accepted since p-value is found 0721 at 5% level of significance.
Table 6: Internet service satisfaction and connection type (cross tabulation) Your satisfaction level, by internet packages,
charges, and services
Total
Chi-Square Highly
dissatisfied Dissatisfied Neutral satisfied satisfied Highly Connection
Type Prepaid 14 21 50 44 2 131 Value-4.698NS
(Sig 0.320) 10.7% 16.0% 38.2% 33.6% 1.5% 100.0% Postpaid 5.3% 1 31.6% 6 36.8% 7 21.1% 4 5.3% 100.0% 1 19 Total 15 27 57 48 3 150 10.0% 18.0% 38.0% 32.0% 2.0% 100.0% NS= not significant
Table 6 shows the cross-tabulation between internet service satisfaction and connection type. It is also found here that prepaid customers are more satisfied regarding internet facilities than the post paid customers. A significant portion of the postpaid customers (31.6%) was
found dissatisfied in the study. By performing Chi-square test, researchers accepted the H04 since the p-value is found 0.320 and concluded that connection type and internet service satisfaction are not linked.
Table 7: Satisfaction with network facilities and connection type (cross tabulation) Satisfaction level by network facilities. Total
Chi-Square dissatisfied Dissatisfied Neutral Satisfied Highly satisfied Highly
Connection Type Prepaid 3 12 52 60 4 131 Value-2.913NS (Sig 0.573) 2.3% 9.2% 39.7% 45.8% 3.1% 100.0% Postpaid 0 1 11 7 0 19 .0% 5.3% 57.9% 36.8% .0% 100.0% Total 2.0% 3 8.7% 13 42.0% 44.7% 63 67 2.7% 100.0% 4 150 NS= not significant
In examining satisfaction level of respondents regarding network facilities, it is found that majority of the respondents are satisfied with current network facilities (Table 7). Nearly 11% provided a negative approach
toward network facilities. Since the p-value was found 0.573 researchers accept the H05 at 5% level of significance and conclude that there is no relation between satisfaction on network facility and connection type.
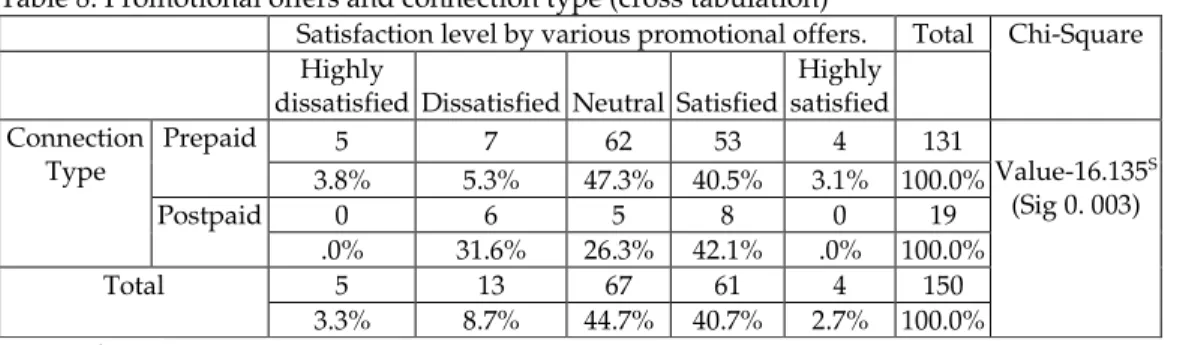
Table 8: Promotional offers and connection type (cross tabulation)
Satisfaction level by various promotional offers. Total Chi-Square dissatisfied Dissatisfied Neutral Satisfied Highly satisfied Highly
Connection
Type Prepaid 5 7 62 53 4 131 Value-16.135S
(Sig 0. 003) 3.8% 5.3% 47.3% 40.5% 3.1% 100.0% Postpaid 0 6 5 8 0 19 .0% 31.6% 26.3% 42.1% .0% 100.0% Total 3.3% 5 8.7% 13 44.7% 40.7% 67 61 2.7% 100.0% 4 150 S=significant
Table 7 shows the respondents’ satisfaction regarding various promotional offers provided by the operators. In the case of prepaid connection, subscribers provided almost positive attitude (47.3% were neutral, and 40.5% were satisfied). It is found in the study that a number of dissatisfied customers is more in post paid connection than prepaid. The null hypothesis (H06) is, there is no significant relationship between connection type and promotional offers based satisfaction. Since the p-value is found, 0.003 researchers reject the null hypothesis at 5% level of significance.
C
ONCLUSIONThis study was undertaken to examine and understand the consumers’ expectation and perception toward telecommunication usage in Bangladesh. Researchers have found that there is relationship between gender of the respondents and influencer in mobile operator selection, gender of the respondent and mobile subscription factors are related, there is no relationship between connection type and price based satisfaction, connection type and internet service satisfaction are not linked, there is no relation between satisfaction on network facility and connection type. There is no significant relationship between connection type and promotional offers based satisfaction. The operators should also focus on the smooth flow of network coverage, customer care services, and the speed of internet services as well as corporate social responsibilities. They should be aware about the
abuses of the mobile phone. The operators themselves may generate new ideas, initiatives by which they can delight the customers.
R
EFERENCESArchibald RB, Haulman CA, Moody CE Jr (1983). “Quality, price, advertising, and published quality ratings,” J. Consum. Res., 9(3): 347-56.
Barny JB (1991). “Firm Resources and Sustained Competitive Advantage”, J. Manage. 17(3): 99-120.
Bedeian AG (1971). “Consumer Perception of Price as an Indicator of Product Quality,” MSU Business Topics, Summer, pp. 59-65,
Boyer KK, Hult GT (2005). “Customer Behavior in an Online Ordering Application: A Decision Scoring Model”, Dec. Sci., 36(4): 569-598.
Cato Iacob, Garden Daniel Adrian,( 2010) “Romania Consumer perception towards mobile marketing campaigns, ” Annales Universitatis Apulensis Series Oeconomica, 12(2), Draganska M, Jain DC (2003). “Consumer Preferences and
Product line Pricing Strategies: An Empirical Analysis”, Conference Paper, Marketing Science Conference,
Maryland, Available at: /
http://facultygsb.stanford.edu/draganska/PDF_Files/1li nelength_FL61.pdf,
Gerstner E (1985). “Do higher prices signal higher quality?” J. Mark.Res., 22(5): 209-15.
Janakiraman N, Meyer RJ, Morales AC (2006). “Spillover effects: how consumers respond to unexpected changes in prices and quality,” J.Consum. Res., 33(3): 361-72.
Johnson WC, Sirikit A (2002). “Service Quality in the Thai Telecommunication Industry: A Tool for Achieving a Sustainable Competitive Advantage,” Manage. Dec. 40(7): 693-701.
Kang, Gi-Du. (2006). The Hierarchical Structure of Service Quality: Integration of Technical and Functional Quality. Managing Service Quality, 16(1), 37-50.
Kollmann T (2000). “The Price/Acceptance Function: Perspectives of a Pricing Policy in European Telecommunication Markets,” Eur. J.Innov. Manage. 3(1): 7-14.
Lambert DR (1980). “Price as a quality signal: the tip of the iceberg,” Econ. Inq., 18(1): 144-50
Lehtinen, J.R., & Lehtinen, U. (1991). Two approaches to service quality dimensions. The Service Industries Journal, 11(3), 287-303 Leisen B, Vance C (2001). “Cross-national Assessment of Service
Quality in the Telecommunication Industry: Evidence from the USA and Germany,” Manag. Ser. Qual., 11(5); 307-317 Lovelock CH (1996). Services Marketing, 3rd Edition,
Prentice-Hall, Upper Saddle River, NJ. pp. 47-82.
Parasuraman, A., Zeithaml, Valarie .A., & Berry, Leonard. L. (1985). A Conceptual Model of Service Quality and its Implication for Future Research. Journal of Marketing, 49, 41-50
Rahman Dr.Muhammad Sabbir(2012) “ Service quality, corporate image, and customer’s satisfaction towards customer perception: An exploratory study of telecom customers in Bangladesh.”
Rahman Sabbir, Haque Ahasanul, Ahmad Mohd Ismail Sayyed (2011) “Choice Criteria for Mobile Telecom Operator:
Empirical Investigation among Malaysian Customers” International Management Review Vol. 7 No. 1
Sjolander R (1992), “Cross-cultural Effects of Price on Perceived Product Quality”, Eur. J. Mark. 26(7): 34-44.
Ting DH (2004). “Service quality and satisfaction perceptions: curvilinear and interaction effect,” Int. J. Bank Mark., 22(6): 407-420.
Trebing HM (2001). “Emerging Market Structures and Options for Regulatory Reform in Public Utility Industries,” Telecom Reform: Principles, Policies and Regulatory Practices, Editor William H.Melody, Reprint 2001, Schultz DocuCenter, Denmark.
Vanhuele M, Laurent G, Dreze X (2006). “Consumers’ immediate memory for prices,” J. Consum. Res., 33(2): 163-74.
Wal RWE, Van der PA, Bond C (2002). “Service Quality in a Cellular Telecommunications Company: A South African Experience”, Managing Serv. Q., 12(5): 323-335.
Yoon E, Kijewski V (1997). “Dynamics of the Relationship between Product Features, Quality Evaluation, and Pricing,” Pricing Strat. Pract., 5(2): 45-60.
Zeithaml VA (2000). “Service Quality, Probability and the Economic Worth of Customers: What We Know, and What We Need to Learn,” J. Acad. Mark. Sci. 28(1): 67-85. Zeithaml VA, Bitner MJ (2000). Services Marketing: Integrating
Customer Focus Across the Firm, 2nd Edition, McGraw Hill, New York, NY.
0
--Publish Online and Print Version Both Online ISSN: 2305-8730
Online Archive: http://journals.abc.us.org/index.php/abr/issue/archive
Indexed Archive Links OCLC WorldCat: http://goo.gl/vhQzla
Google Scholar: https://goo.gl/t23FeQ
abcGATE: http://goo.gl/E6WdgA