Open Access
Methodology article
Effects of DNA mass on multiple displacement whole genome
amplification and genotyping performance
Andrew W Bergen*
1, Ying Qi
2,3, Kashif A Haque
2,3, Robert A Welch
2,3and
Stephen J Chanock
1,2,4Address: 1Division of Cancer Epidemiology and Genetics, National Cancer Institute, National Institutes of Health, Bethesda, MD, USA, 2Core Genotyping Facility, National Cancer Institute, National Institutes of Health, Gaithersburg, MD, USA, 3Intramural Research Support Program, SAIC-Frederick, NCI-FCRDC, Frederick, MD, USA and 4Section on Genomic Variation, Pediatric Oncology Branch, National Cancer Institute, National Institutes of Health, Bethesda, MD, USA
Email: Andrew W Bergen* - [email protected]; Ying Qi - [email protected]; Kashif A Haque - [email protected]; Robert A Welch - [email protected]; Stephen J Chanock - [email protected]
* Corresponding author
Abstract
Background: Whole genome amplification (WGA) promises to eliminate practical molecular genetic analysis limitations associated with genomic DNA (gDNA) quantity. We evaluated the performance of multiple displacement amplification (MDA) WGA using gDNA extracted from lymphoblastoid cell lines (N = 27) with a range of starting gDNA input of 1–200 ng into the WGA reaction. Yield and composition analysis of whole genome amplified DNA (wgaDNA) was performed using three DNA quantification methods (OD, PicoGreen® and RT-PCR). Two panels of N = 15 STR (using the AmpFlSTR® Identifiler® panel) and N = 49 SNP (TaqMan®) genotyping assays were performed on each gDNA and wgaDNA sample in duplicate. gDNA and wgaDNA masses of 1, 4 and 20 ng were used in the SNP assays to evaluate the effects of DNA mass on SNP genotyping assay performance. A total of N = 6,880 STR and N = 56,448 SNP genotype attempts provided adequate power to detect differences in STR and SNP genotyping performance between gDNA and wgaDNA, and among wgaDNA produced from a range of gDNA templates inputs.
Results: The proportion of double-stranded wgaDNA and human-specific PCR amplifiable wgaDNA increased with increased gDNA input into the WGA reaction. Increased amounts of gDNA input into the WGA reaction improved wgaDNA genotyping performance. Genotype completion or genotype concordance rates of wgaDNA produced from all gDNA input levels were observed to be reduced compared to gDNA, although the reduction was not always statistically significant. Reduced wgaDNA genotyping performance was primarily due to the increased variance of allelic amplification, resulting in loss of heterozygosity or increased undetermined genotypes. MDA WGA produces wgaDNA from no template control samples; such samples exhibited substantial false-positive genotyping rates.
Conclusion: The amount of gDNA input into the MDA WGA reaction is a critical determinant of genotyping performance of wgaDNA. At least 10 ng of lymphoblastoid gDNA input into MDA WGA is required to obtain wgaDNA TaqMan® SNP assay genotyping performance equivalent to that of gDNA. Over 100 ng of lymphoblastoid gDNA input into MDA WGA is required to obtain optimal STR genotyping performance using the AmpFlSTR® Identifiler® panel from wgaDNA equivalent to that of gDNA.
Published: 16 September 2005
BMC Biotechnology 2005, 5:24 doi:10.1186/1472-6750-5-24
Received: 28 March 2005 Accepted: 16 September 2005 This article is available from: http://www.biomedcentral.com/1472-6750/5/24
© 2005 Bergen et al; licensee BioMed Central Ltd.
This is an Open Access article distributed under the terms of the Creative Commons Attribution License (http://creativecommons.org/licenses/by/2.0), which permits unrestricted use, distribution, and reproduction in any medium, provided the original work is properly cited.
Background
The potential for the molecular analysis of human genetic material has increased enormously with the availability of the human genome sequence, SNP identification efforts and the development of high-throughput genotyping platforms [1]. The expanding demand for single nucle-otide polymorphism (SNP) genotyping is a consequence of the recognition that many SNPs will need to be ana-lyzed to characterize the effects of genes on complex dis-orders [2], especially when performing whole genome association studies [3]. With notable exceptions [4], total DNA requirements for genotyping will increase as the number of loci investigated expands, despite increased efficiency of individual genotyping assays. Whole genome amplification (WGA) is an in vitro procedure to amplify a genomic DNA (gDNA) sample to generate amplified DNA (wgaDNA) for further molecular genetic analyses, and has
been considered by some as a potential solution to the problem of limiting gDNA availability. While PCR-based methods of WGA have been under continuous develop-ment for over a decade [5,6], recent application of a highly processive φ29 DNA polymerase [7], has enabled multiple displacement amplification (MDA) WGA, an isothermal, hyperbranching amplification method, with a low level of locus or allelic bias [8]. Dean [8] and Lovmar [9] have evaluated the genotyping performance of MDA WGA using a range of genomic DNA inputs (0.3, 3, 30 and 300 ng, and 0.003, 0.03, 0.3 and 3 ng, respectively). Both authors focused attention in their evaluation of genotyp-ing performance on genotypgenotyp-ing wgaDNA derived from 3 ng of genomic DNA template. Lasken and Egholm [10] have recommended 10–100 ng of undegraded gDNA tem-plate in the MDA WGA reaction to avoid stochastic ampli-fication. The present study has characterized the yield,
Yield of DNA components of wgaDNA by gDNA input into WGA Figure 1
Yield of DNA components of wgaDNA by gDNA input into WGA. Mean ("+"), Median (middle bar), lower and upper quartile (lower and upper end of box), and minimum and maximum of BRCA1 locus equivalents, ssDNA, dsDNA and total DNA.
composition and genotyping performance of wgaDNA produced from lymphoblast gDNA templates of 1, 10, 25, 50, 100 and 200 ng. Three DNA quantification methods, two genotyping methods, and adequate numbers of gen-otyping assays and DNA samples were used to detect sig-nificant differences in the yield, composition and genotyping performance of the wgaDNA produced from this range of gDNA inputs and to provide additional rec-ommendations on the amounts of gDNA template to be used in the MDA WGA reaction.
Results
WGA reaction yield
The yield of H. sapiens PCR-amplifiable (hereafter "RT-PCR") DNA, ssDNA, dsDNA and total DNA in wgaDNA by gDNA input mass is presented in Figure 1. RT-PCR DNA yield increased significantly as gDNA input increased at each level (all p values ≤ 0.02), where the pro-portion of the total wgaDNA represented by the RT-PCR DNA increased from 20% to 46%, at 1 to 200 ng gDNA input into the WGA reaction, respectively. The yield of ssDNA decreased, and that of dsDNA increased, as the gDNA input into the WGA reaction was increased. The variability in wgaDNA yield by wgaDNA component was least for total DNA and dsDNA yield, greatest for RT-PCR yield, and intermediate for ssDNA yield.
Genetic profiling with AmpFlSTR® Identifiler® assay (N =
15 STR and AMEL)
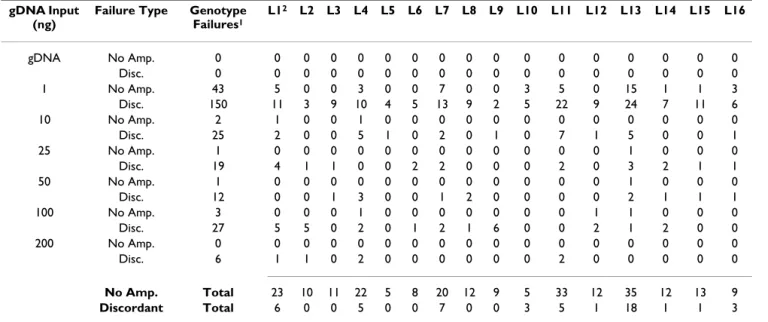
gDNA exhibited STR genotype completion and concord-ance rates of 100%, which were significantly greater than the completion rate exhibited by wgaDNA produced from 1 ng gDNA input and the wgaDNA concordance produced from all gDNA inputs, respectively (Table 1). wgaDNA produced from 1 ng gDNA input exhibited significantly lower STR genotype completion and concordance rates than did wgaDNA produced from other gDNA inputs,
while wgaDNA produced from 200 ng gDNA input exhib-ited STR genotyping completion and concordance rates similar, but not identical to gDNA. 98% of wgaDNA STR genotypes discordant with gDNA genotypes were homozygote genotypes, reflecting loss of heterozygosity. There was a trend for preferential loss of shorter alleles (129 short alleles/232 total alleles, p = 0.088), but only for wgaDNA produced from 1 ng of gDNA was this signif-icant (90 short alleles/145 total alleles, p = 0.0037). Peak heights were significantly and negatively correlated with discordance for all gDNA inputs, and for 1, 10 and 100 ng gDNA inputs separately (Spearman r = -0.58, -0.64, -0.55 and -0.62, with p values <0.0001, = 0.008, = 0.025 and = 0.001, respectively, data not shown), and peak height ratios of concordant heterozygote wgaDNA genotypes (from wgaDNA produced from 1 and 50 ng gDNA inputs) were significantly higher than those from gDNA geno-types (Wilcoxon's p values ≤ 0.03, data not shown). The rate of no amplification and discordant genotypes per STR locus was 0.8% and 4%, respectively. Five STR loci (TPOX, FGA, D7S820, D13S317 and D18S51) accounted for the majority of STR no amplification failures (82%) and discordant (56%) genotypes following WGA (Table 2). The discordance rate for AMEL genotypes for all wgaDNA strata was 0.15%, but was 0.73% for wgaDNA produced from 1 ng gDNA input (Table 2). Composite genotype quality (GQ) scores for gDNA heterozygote and homozygote concordant genotypes were significantly bet-ter (fewer genotypes in the poorer quality categories) than for concordant wgaDNA heterozygote genotypes at all gDNA input levels and for concordant wgaDNA homozy-gote genotypes produced from 1, 100 and 200 ng gDNA input levels, respectively (Table 3). wgaDNA heterozygote and homozygote concordant genotypes produced from 1 ng gDNA input exhibited significantly reduced GQ scores compared to wgaDNA heterozygote and homozygote Table 1: STR genotyping performance
gDNA Input (ng) Completed1 % Completion No Amplification GQ<0.252 Concordant % Concordance Discordant Genotypes % Discordance gDNA 864 100.03 0 13 851 100.04 0 0.0 1 821 95.0 43 70 638 80.1 150 19.0 10 862 99.8 2 9 830 97.1 25 2.9 25 863 99.9 1 22 823 97.7 19 2.3 50 863 99.9 1 15 836 98.6 12 1.4 100 861 99.7 3 11 826 96.8 27 3.2 200 864 100.0 0 0 858 99.3 6 0.7
1N = 27 gDNA or wgaDNA samples were genotyped in duplicate using the AmpFlSTR® Identifiler® assay for N = 864 attempted genotypes/sample. 2A Genotype Quality Score (GQ) of <0.25 indicates a STR genotype with a Genotype Quality Score beloew the calling threshold of GeneMapper
v3.0 software. 3gDNA exhibited significantly greater STR genotype completion rate than did 1 ng gDNA input (p < 0.001). 4gDNA exhibited
significantly greater STR genotype concordance rates compared to wgaDNA (p < 0.0001, except for 50 ng gDNA input, with p = 0.001, and 200 ng gDNA input, p = 0.03).
concordant genotypes produced from all other gDNA input levels, except for wgaDNA homozygote concordant genotypes produced from 200 ng gDNA (Table 3). GQ scores of discordant homozygote wgaDNA genotypes were significantly worse than those for concordant homozygote wgaDNA genotypes at all gDNA input levels except 50 ng (p = 0.02 for 25 ng gDNA input, all other p < 0.0001, data not shown).
SNP genotyping with the TaqMan® assay (N = 49 SNPs)
Results of genotyping using N = 49 TaqMan® SNP
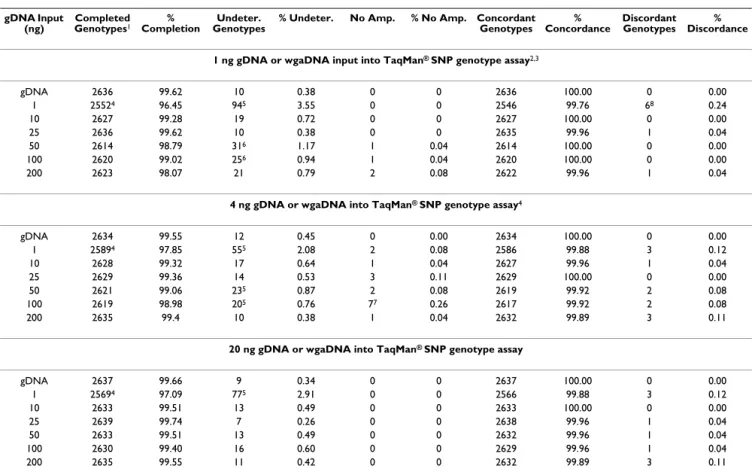
geno-typing assays with 1, 4 and 20 ng of gDNA and wgaDNA using 1, 10, 25, 50, 100 and 200 ng of gDNA input into the WGA reaction are summarized in Table 4. We observed a TaqMan® SNP genotype completion rate of
>99.55%, an undetermined rate of <0.45%, zero discord-ant genotypes and zero "no amplification failures" in 7938 attempted TaqMan® SNP genotypes using gDNA
template in the TaqMan® SNP assay. No significant
differ-ences in genotyping performance between gDNA tem-plate inputs into the TaqMan® SNP assay were observed
(Table 4). In pairwise tests, gDNA exhibited a significantly higher TaqMan® SNP genotype completion rate due to
sig-nificantly decreased undetermined TaqMan® SNP
geno-types, compared to wgaDNA produced from 1 ng of gDNA input for all wgaDNA template inputs into Taq-Man® SNP genotyping, and when compared to wgaDNA
produced from 50 and 100 ng of gDNA input when using 1 or 4 ng of wgaDNA template input into the TaqMan®
SNP assay. Over all gDNA and wgaDNA strata, we
observed significantly reduced SNP genotyping perform-ance when using 1 ng of gDNA or wgaDNA in TaqMan®
SNP genotyping assays with respect to completion rate, due to a significant increase in the undetermined geno-type rate (Table 4). However, genogeno-type concordance rates were not significantly different among the three DNA (gDNA or wgaDNA) input levels into the TaqMan® SNP
assay, although there was a significant decrease in the con-cordance rate of 1 ng wgaDNA produced from 1 ng gDNA into the TaqMan® SNP assay, when compared to 1 ng
wgaDNA produced from 10, 50 and 100 ng of gDNA input (Table 4).
Predictors of wgaDNA SNP genotyping performance We were interested to identify parameters from the Core Genotyping Facility's standard DNA sample handling protocol that might be predictive of the SNP genotyping performance of wgaDNA. We performed exploratory cor-relation analysis among measures of wgaDNA yield (RT-PCR, ssDNA, dsDNA, total DNA, ratio of RT-PCR to dsDNA) and genotyping performance (concordance and completion rates for AmpFlSTR® Identifiler™ and TaqMan®
SNP assay genotyping) within gDNA input strata. Meas-ures of wgaDNA yield (especially the ratio of RT-PCR to dsDNA and total DNA) and genotyping performance were observed to be highly correlated with one another (92%, 3% and 5% of 162 pairwise correlations were statistically significant, trending and non-significant, respectively). We then performed linear regression analysis with the dependent variables "SNP completion rate" and "SNP Table 2: STR genotyping failures by locus
gDNA Input (ng)
Failure Type Genotype Failures1 L12 L2 L3 L4 L5 L6 L7 L8 L9 L10 L11 L12 L13 L14 L15 L16 gDNA No Amp. 0 0 0 0 0 0 0 0 0 0 0 0 0 0 0 0 0 Disc. 0 0 0 0 0 0 0 0 0 0 0 0 0 0 0 0 0 1 No Amp. 43 5 0 0 3 0 0 7 0 0 3 5 0 15 1 1 3 Disc. 150 11 3 9 10 4 5 13 9 2 5 22 9 24 7 11 6 10 No Amp. 2 1 0 0 1 0 0 0 0 0 0 0 0 0 0 0 0 Disc. 25 2 0 0 5 1 0 2 0 1 0 7 1 5 0 0 1 25 No Amp. 1 0 0 0 0 0 0 0 0 0 0 0 0 1 0 0 0 Disc. 19 4 1 1 0 0 2 2 0 0 0 2 0 3 2 1 1 50 No Amp. 1 0 0 0 0 0 0 0 0 0 0 0 0 1 0 0 0 Disc. 12 0 0 1 3 0 0 1 2 0 0 0 0 2 1 1 1 100 No Amp. 3 0 0 0 1 0 0 0 0 0 0 0 1 1 0 0 0 Disc. 27 5 5 0 2 0 1 2 1 6 0 0 2 1 2 0 0 200 No Amp. 0 0 0 0 0 0 0 0 0 0 0 0 0 0 0 0 0 Disc. 6 1 1 0 2 0 0 0 0 0 0 2 0 0 0 0 0 No Amp. Total 23 10 11 22 5 8 20 12 9 5 33 12 35 12 13 9 Discordant Total 6 0 0 5 0 0 7 0 0 3 5 1 18 1 1 3
1The number of attempted genotypes for all DNA inputs is N = 864. No amplification (No Amp.) genotypes reduce the number of genotypes
available for concordance analysis. 2Loci 1–16 = TPOX, D2S1338, D3S1358, FGA, D5S818, CSF1PO, D7S820, D8S1179, TH01, vWA, D13S2317,
concordance rate", in order to identify WGA reaction, wgaDNA yield and STR genotyping performance factors that are significantly associated with wgaDNA SNP geno-typing performance. Independent variables included: gDNA input, STR completion rate, concordance rate, GQ score, peak height, and RT-PCR wgaDNA yield. "STR com-pletion rate" was a highly significant factor in both SNP rate models (p < 0.0001), and "STR concordance rate" and "GQ score" were significant factors in the SNP concordance rate model (p = 0.0008 and 0.045, respec-tively). The variable "gDNA input" into the WGA reaction was significant only in those models incorporating the 1 ng gDNA input strata.
WGA yield and genotyping performance with no template control (NTC) samples
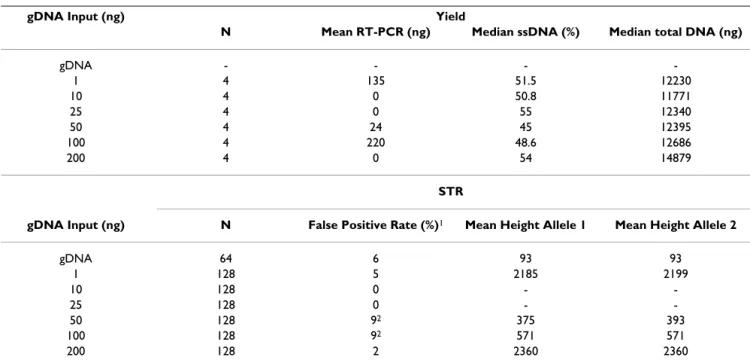
No template control (NTC) input samples, i.e., where no gDNA was used in the WGA reaction, yielded substantial amounts of wgaDNA, similar in quantity to the total wgaDNA obtained with gDNA inputs, but with a substan-tially higher proportion of ssDNA than with gDNA inputs (Table 5). The wgaDNA produced from the NTC samples
in the 1, 50 and 100 ng gDNA input strata exhibited mean RT-PCR results that were greater than zero (Table 5). We observed N = 35 STR peaks with a signal strength > 50 RFUs that fell within the expected base-pair range of an AmpFlSTR® Identifiler™ locus allele from the wgaDNA
produced from the NTC gDNA and wgaDNA samples for an overall false positive STR genotyping rate of 4.2% (Table 5). While these false positive STR peaks fulfill the criteria for valid AmpFlSTR® Identifiler™ STR alleles, they
are characterized by low heterozygosity (2 observed versus 26 expected heterozygote genotypes), moderate signal strength (median amplitude = 357 RFUs), and representa-tion of 12 out of 15 AmpFlSTR® Identifiler™ STR loci. The
50 and 100 ng gDNA input strata (Table 5) and three STR loci (D2S1338, D8S1179 and FGA)account for the majority (66% and 51%, respectively) of the wgaDNA false positive STR genotypes produced from the NTC samples.
In N = 7056 TaqMan SNP genotype attempts with wgaDNA produced from the NTC samples, 80%, 14.5% and 5.5% of the resulting datapoints were incorporated Table 3: Genotype Quality (GQ) scores of concordant STR genotypes
gDNA Input (ng) GQ1Category, Heterozygotes
I II III Total gDNA 5 53 580 6382 1 43 137 256 4363 10 27 140 451 618 25 26 126 463 615 50 21 130 474 625 100 25 110 482 617 200 78 31 537 646 Total 225 727 3243 4195
gDNA Input (ng) GQ Category, Homozygotes
I II III Total gDNA 0 9 204 2134 1 9 25 168 2025 10 2 8 202 212 25 1 8 199 208 50 4 11 196 211 100 8 10 191 209 200 8 20 184 212 Total 32 91 1344 1467
1Category I = GQ scores, originally ≥ 0.25 and <0.40, that have been successfully edited; Category II = GQ scores ≥ 0.40 and ≤ 0.50; Category III =
GQ scores ≥ 0.79 and ≤ 0.90. 2GQ score distribution, heterozygote genotypes, gDNA versus all wgaDNA, p < 0.0001. 3GQ score distribution,
heterozygote genotypes, wgaDNA produced from 1 ng gDNA input versus other gDNA inputs, p < 0.0001.4GQ score distribution, homozygote
genotypes, gDNA versus wgaDNA produced from 1, 100, 200 ng gDNA input, p < 0.0001, 0.01, 0.0001, respectively. 5GQ score distribution,
homozygote genotypes, wgaDNA produced from 1 ng gDNA input versus 10, 25, 50, 100 ng gDNA inputs, p = 0.0003, 0.0001, 0.009, 0.02, respectively.
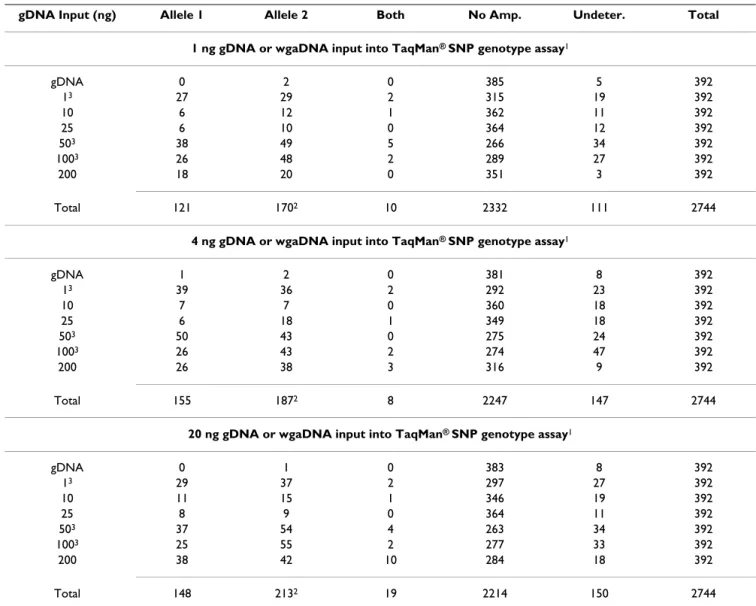
into the no amplification (NTC) cluster, into a genotype cluster ("false positive SNP genotypes"), and into the undetermined genotype space of the two color TaqMan®
SNP genotyping assay plot, respectively (Table 6). The number of false positive and undetermined SNP geno-types from the wgaDNA produced from the NTC samples increased significantly with increasing amounts of wgaDNA input into the TaqMan® SNP assay (Table 6). The
majority (96.4%) of these false positive SNP genotypes from NTC samples were homozygotes (Table 6), signifi-cantly more allele 2 alleles were observed than allele 1 alleles (Table 6), and all N = 49 TaqMan® SNP assays
exhibited false positive SNP genotypes (data not shown). wgaDNA NTC samples from the gDNA input strata of 1, 50 and 100 ng exhibited significantly greater numbers of false positive and undetermined SNP genotypes than did the wgaDNA NTC samples from the gDNA input strata of 10, 25 and 200 ng (Table 6).
Discussion
wgaDNA may not be suitable for STR genotyping
wgaDNA STR genotyping completion rates reach that of gDNA at the 10 ng gDNA input level into WGA. However, the wgaDNA STR concordance rate is significantly worse than that of gDNA, even with 200 ng of gDNA input into the WGA reaction (Table 1). Thus, the use of MDA wgaDNA for accurate STR genotyping will require larger amounts of input gDNA into the WGA than have been recommended in the past [8,10]. In the absence of suffi-cient gDNA template for MDA WGA, investigators face the tradeoff of no data, or data with increased loss of heterozygosity, such as that observed with MDA wgaDNA produced from low mass gDNA templates [11,12]. Development of laboratory and data analysis protocols optimized for STR genotyping of MDA wgaDNA may be required before MDA wgaDNA can be routinely used for STR genotyping. Thus, it might be prudent to adjust geno-Table 4: SNP genotyping performance
gDNA Input (ng)
Completed
Genotypes1 Completion% GenotypesUndeter. % Undeter. No Amp. % No Amp. Concordant Genotypes Concordance% Discordant Genotypes Discordance%
1 ng gDNA or wgaDNA input into TaqMan® SNP genotype assay2,3
gDNA 2636 99.62 10 0.38 0 0 2636 100.00 0 0.00 1 25524 96.45 945 3.55 0 0 2546 99.76 68 0.24 10 2627 99.28 19 0.72 0 0 2627 100.00 0 0.00 25 2636 99.62 10 0.38 0 0 2635 99.96 1 0.04 50 2614 98.79 316 1.17 1 0.04 2614 100.00 0 0.00 100 2620 99.02 256 0.94 1 0.04 2620 100.00 0 0.00 200 2623 98.07 21 0.79 2 0.08 2622 99.96 1 0.04
4 ng gDNA or wgaDNA into TaqMan® SNP genotype assay4
gDNA 2634 99.55 12 0.45 0 0.00 2634 100.00 0 0.00 1 25894 97.85 555 2.08 2 0.08 2586 99.88 3 0.12 10 2628 99.32 17 0.64 1 0.04 2627 99.96 1 0.04 25 2629 99.36 14 0.53 3 0.11 2629 100.00 0 0.00 50 2621 99.06 235 0.87 2 0.08 2619 99.92 2 0.08 100 2619 98.98 205 0.76 77 0.26 2617 99.92 2 0.08 200 2635 99.4 10 0.38 1 0.04 2632 99.89 3 0.11
20 ng gDNA or wgaDNA into TaqMan® SNP genotype assay
gDNA 2637 99.66 9 0.34 0 0 2637 100.00 0 0.00 1 25694 97.09 775 2.91 0 0 2566 99.88 3 0.12 10 2633 99.51 13 0.49 0 0 2633 100.00 0 0.00 25 2639 99.74 7 0.26 0 0 2638 99.96 1 0.04 50 2633 99.51 13 0.49 0 0 2632 99.96 1 0.04 100 2630 99.40 16 0.60 0 0 2629 99.96 1 0.04 200 2635 99.55 11 0.42 0 0 2632 99.89 3 0.11
1There were N = 27 samples gentoyped in duplicate at N = 49 SNPs for N = 2,646 attempted genotypes/sample. 21 versus 4 ng gDNA or wgaDNA
input, SNP genotyping rates: completion, p = 0.0178; undetermined, p = 0.0022; no amplification, p = 0.0139; concordance, p = n.s. 31 versus 20 ng
gDNA or wgaDNA input, SNP genotyping rates: completion, p = 0.0004; undetermined, p = 0.0008; no amplification, p = n.s.; concordance, p = n.s.
44 versus 20 ng gDNA or wgaDNA input, SNP genotyping rates: completion, p = n.s.; undetermined, p = n.s.; no amplification, p = 0.0002;
concordance, p = n.s. 5gDNA versus wgaDNA produced from 1 ng gDNA input, SNP genotype completion rates, p < 0.0001. 6gDNA versus
wgaDNA produced from 50 and 100 ng gDNA input, p ≤ 0.05. 7gDNA versus wgaDNA produced from 100 ng gDNA input, p = 0.02. 8wgaDNA
type analysis algorithms before application of the Amp-FlSTR® Identifiler™ panel to wgaDNA for forensic
purposes, as has been recommended for the analysis of STR profiles from highly limited unamplified gDNA tem-plate [13], or to utilize analysis methods that incorporate STR genotyping error, as has been recommended for the analysis of STR linkage scan data [14].
wgaDNA is a suitable template for SNP genotyping wgaDNA produced from ≥ 10 ng of gDNA input into the WGA reaction exhibits robust wgaDNA TaqMan® SNP
assay genotyping performance rates, similar to that of gDNA TaqMan® SNP assay genotyping performance rates.
1 ng of wgaDNA template into the TaqMan® SNP assay
exhibits significantly reduced TaqMan® SNP assay
geno-typing performance compared to both 4 and 20 ng wgaDNA templates into the TaqMan® SNP assay. 4 ng
wgaDNA template into the TaqMan® SNP assay exhibits a
significantly increased no amplification rate over both 1 and 20 ng wgaDNA templates, although no amplification rates are very low (all <0.01%) for all three wgaDNA tem-plate inputs into the TaqMan® SNP assay. These results
suggest that optimal TaqMan® SNP assay genotyping
per-formance, i.e., minimal wgaDNA TaqMan® no
amplifica-tion and undetermined genotyping rates, should be expected for wgaDNA inputs greater than 4 ng.
False positive NTC sample SNP genotypes
A non-zero RT-PCR yield and significantly increased num-bers of observed false positive genotypes in wgaDNA from NTC samples in the 1, 50 and 100 ng gDNA input strata are consistent with human gDNA contamination of these gDNA input strata. However, we also observed signifi-cantly more false positive and undetermined SNP assay genotypes in each of the 10, 25 and 200 ng gDNA input strata (the apparently uncontaminated strata) than in the gDNA strata (all p < 0.0001), concordant with the hypoth-esis that a portion of the NTC TaqMan® genotypes may be
due to degradation of TaqMan® SNP assay reagents. Thus,
contamination of NTC samples with gDNA and TaqMan®
SNP assay probe oligonucleotide degradation during the genotyping of wgaDNA are both associated with false-positive TaqMan® SNP assay genotypes.
Limitations
This study is distinguished by the use of multiple assays to estimate wgaDNA yield and composition, the use of STR and SNP genotyping assays that have been validated by sequencing the same DNA samples used in this study, and the use of an adequate number of samples and assays to provide statistical power to detect small differences in the genotyping performance of wgaDNA and gDNA, when using 1–200 ng of gDNA as template in the WGA reaction. Table 5: Yield and STR genotypes from NTC samples
gDNA Input (ng) Yield
N Mean RT-PCR (ng) Median ssDNA (%) Median total DNA (ng)
gDNA - - - -1 4 135 51.5 12230 10 4 0 50.8 11771 25 4 0 55 12340 50 4 24 45 12395 100 4 220 48.6 12686 200 4 0 54 14879 STR
gDNA Input (ng) N False Positive Rate (%)1 Mean Height Allele 1 Mean Height Allele 2
gDNA 64 6 93 93 1 128 5 2185 2199 10 128 0 - -25 128 0 - -50 128 92 375 393 100 128 92 571 571 200 128 2 2360 2360
1The number of "attempted" AmpFlSTR® Identifiler™ panel genotypes using gDNA NTCs and wgaDNA from NTC samples is 832 [two NTC DNA
samples genotyped for gDNA in duplicate (64 possible genotype bins), and four wgaDNA samples from NTCs for each gDNA input level genotyped in duplicate (768 possible genotype bins)]. 2There were significantly more false positive STR genotypes in the wgaDNA produced from 50 ng and
Nevertheless, there are limitations, with respect to generalizing to all gDNA templates, MDA protocols and genotyping methods, respectively.
The gDNA used in this study was extracted from lymphob-lasts and samples from most studies are unlikely to be of such high quality. Using a model system to evaluate the effect of significant gDNA degradation on the WGA
reac-tion, it has been shown that MDA wgaDNA produced from irradiated gDNA exhibits significantly reduced yield and genotyping performance compared to MDA wgaDNA produced from unirradiated gDNA [15]. The yield and genotyping differences observed in wgaDNA produced from high quality (this study) and low quality [15] gDNA samples suggest that those gDNA samples with DNA extraction, storage and usage histories that have reduced Table 6: SNP genotypes from NTC samples
gDNA Input (ng) Allele 1 Allele 2 Both No Amp. Undeter. Total
1 ng gDNA or wgaDNA input into TaqMan® SNP genotype assay1
gDNA 0 2 0 385 5 392 13 27 29 2 315 19 392 10 6 12 1 362 11 392 25 6 10 0 364 12 392 503 38 49 5 266 34 392 1003 26 48 2 289 27 392 200 18 20 0 351 3 392 Total 121 1702 10 2332 111 2744
4 ng gDNA or wgaDNA input into TaqMan® SNP genotype assay1
gDNA 1 2 0 381 8 392 13 39 36 2 292 23 392 10 7 7 0 360 18 392 25 6 18 1 349 18 392 503 50 43 0 275 24 392 1003 26 43 2 274 47 392 200 26 38 3 316 9 392 Total 155 1872 8 2247 147 2744
20 ng gDNA or wgaDNA input into TaqMan® SNP genotype assay1
gDNA 0 1 0 383 8 392 13 29 37 2 297 27 392 10 11 15 1 346 19 392 25 8 9 0 364 11 392 503 37 54 4 263 34 392 1003 25 55 2 277 33 392 200 38 42 10 284 18 392 Total 148 2132 19 2214 150 2744
1A significant increase in the number of false positive and undetermined SNP genotypes is observed with increasing amounts of wgaDNA template:
11.0%, 12.8% and 13.8% for 1, 4 and 20 ng wgaDNA input, respectively, p = 0.045, 1 versus 4 ng wgaDNA input, and p = 0.0014, 1 versus 20 ng wgaDNA input, p = 0.0046 test for trend, 1 vs. 4 vs 20 ng wgaDNA input, for false positive genotypes; 4.0%, 5.34% and 5.47%, respectively, p = 0.026, 1 versus 4 ng, and p = 0.0159, 1 versus 20 ng, p = 0.0153 for trend, for undetermined genotypes. 2Significantly more allele 2 NTC TaqMan®
SNP assay alleles were observed than allele 1 NTC TaqMan® assay alleles (p = 0.006, 0.091 and 0.001 for 1, 4 and 20 ng gDNA and wgaDNA input
into the TaqMan® SNP assays, respectively), where the fluorescent label was 6-Fam for allele 1, and Vic for allele 2, in all the TaqMan® SNP assays in
this study. 3The gDNA input strata of 1, 50 and 100 ng exhibited significantly greater numbers of false positive and undetermined SNP genotypes
concentrations of high molecular weight DNA in the sam-ple are likely to exhibit less than optimal MDA wgaDNA yield and genotyping performance.
While only one commercially available MDA WGA proto-col was used in this study, we have evaluated two MDA WGA protocols on gDNA extracted from multiple tissue types, and no systematic significant differences in geno-typing performance between the two MDA WGA proto-cols was observed [16]. STR and SNP genotyping performance of MDA wgaDNA derived from 4 ng of gDNA input in that study is seen to be intermediate between the genotyping performance of MDA wgaDNA produced from 1 ng and 10 ng in this study. Alternative WGA technologies that can prepare wgaDNA of accepta-ble quality from gDNA with reduced complexity or con-centration may be required for some degraded gDNA samples. For example, PCR-based methods that reduce genome complexity before amplification are one approach [6,17], and methods that combines genome cir-cularization with φ29 DNA polymerase are another [18]. Finally, we applied two commonly used genotyping methods to evaluate the genotyping performance of wgaDNA in this study. Different genotyping technologies may be better suited to produce optimal genotyping per-formance with wgaDNA than the two we evaluated. For STRs, genotyping panels designed for linkage scanning usually employ lower levels of multiplexing and use larger amounts of DNA template than do STR panels designed for forensic analysis, such as the AmpFlSTR® Identifiler™.
E.g., reported MDA wgaDNA STR genotype discordance rates using linkage scan STR panels [19,20] and forensic STR panels [15,16,21] range from ~0% to ~6% and the average rate of the five studies cited (2.0%) is similar to the rates observed in this study. For SNPs, those genotyp-ing technologies with redundant data samplgenotyp-ing for SNP genotype determination, such as minisequencing [22], the Golden Gate™ assay [23] or the GeneChip® variant
detection array [24], may be more resistant to SNP genotype failure when genotyping wgaDNA [9,25,26] than those SNP genotyping technologies with single data point genotype determination [27]. However, in a recent direct comparison of Golden Gate™, TaqMan® and
Invader™ SNP assays, with gDNA extracted from lym-phoblasts using an organic extraction method and MDA wgaDNA produced from 20 ng of this gDNA, the Golden Gate™ assay exhibited a higher exclusion rate of DNA sam-ples, and a higher completion rate and lower concordance rate on the remaining samples, than exhibited by the Taq-Man® and Invader™ SNP assays [28]. For all three SNP
gen-otyping technologies evaluated, the gengen-otyping performance of gDNA was observed to be significantly better than that of MDA wgaDNA [28].
Conclusion
We have evaluated the yield, composition and genotyping performance of wgaDNA based on a range of high-quality lymphoblastoid gDNA templates between 1 and 200 ng in order to provide empirical data on the performance of MDA WGA technology. A detailed analysis of the observed genotyping failures has been performed to facil-itate an understanding of the reduction in genotyping per-formance likely to be observed when genotyping wgaDNA produced from a range of gDNA inputs. Increasing gDNA input from 1 – 200 ng in the MDA WGA reaction improves the yield of H. sapiens PCR-amplifiable DNA and improves the genotyping performance of the Amp-FlSTR® Identifiler® assay. More than 100 ng of high quality
gDNA template into the MDA WGA reaction is required in order to observe MDA wgaDNA AmpFlSTR® Identifiler®
STR genotyping performance similar to that observed with gDNA. At least 10 ng of high quality lymphoblastoid gDNA template into the WGA reaction is required to observe optimal TaqMan® SNP genotyping performance
from MDA wgaDNA.
Methods
gDNA samples
N = 22 lymphoblast genomic DNA (gDNA) samples were obtained directly from the Coriell Cell Repository (Cam-den, NJ); these samples were from individuals within the SNP500 Cancer dataset [29]. Each gDNA was quantified by UV spectroscopy, the PicoGreen® assay (Molecular
Probes, Eugene, OR), and a Real-Time (RT) TaqMan® assay
specific to human DNA [30]. Five of twenty-two Coriell Cell Repository lymphoblast gDNA samples were repli-cated for a total of N = 27 lymphoblast gDNA samples subjected to WGA and post-WGA analysis in order to increase statistical power to detect genotyping error. Whole genome amplification
1, 10, 25, 50, 100 and 200 ng of each gDNA sample was used as template and amplified according to the Genom-iPhi™ WGA protocol (1X). The 200 ng gDNA template sample was amplified separately after evaluation of the genotyping performance of the wgaDNA produced from 1 – 100 ng gDNA. Each gDNA sample was subjected to the WGA protocol once; four no gDNA template controls (NTC) reactions were included at each gDNA input level. wgaDNA was quantified with OD260, PicoGreen® and
RT-PCR, as was performed for gDNA. The concentrations of ssDNA, dsDNA, total DNA and human-specific PCR amplifiable (RT-PCR) DNA in the wgaDNA samples were estimated as described [16].
AmpFlSTR® Identifiler® assay
300 pg of dsDNA (both gDNA and wgaDNA, as deter-mined by PicoGreen®) was used as template DNA for
Foster City, CA), and scoring of alleles, assignment of Genotype Quality scores and calculation of genotype fail-ure rates were performed as described [16]. Peak height ratio distributions at a signal strength threshold of = 50 RFUs were evaluated for normality and differences between assigned and observed GQ score category distri-butions evaluated using Wilcoxon's rank sum test and contingency table analyses.
TaqMan® SNP genotype assays
N = 49 TaqMan® (Applied Biosystems Inc., Foster City,
CA) genotyping assays from the publicly available SNP500 Cancer Database portfolio [29] were chosen as described [16]. 1.0, 4.0 and 20.0 ng of dsDNA (both gDNA and wgaDNA, as determined by PicoGreen®) was
used as template for genotyping using the N = 49 Taq-Man® assays. Reaction and cycling conditions, control
samples, fluorescence detection and genotype cluster assignment were performed as described [16]. SNP geno-type completion, undetermined genogeno-type, no amplifica-tion, and discordance rates were calculated, with the wgaDNA discordance rate calculated to be the number of instances in which a wgaDNA SNP genotype differed from the scored gDNA SNP genotype. Differences in rates were evaluated using contingency table analyses.
Data management and analysis
Data was managed using a Sapphire Laboratory Informa-tion Management System (LabVantage, New Brunswick, NJ), exported in Microsoft Excel (Redmond, WA) and sta-tistical analyses (descriptive statistics and tests of normal-ity, distribution and correlation) were performed using SAS (Cary, NC) software. Tests of proportion, correlation, etc., are considered significant at a Type I error level of 0.05, with additional information on p values provided if appropriate.
Authors' contributions
AWB conceived of the study and drafted the manuscript. AWB, YQ, KAH and RAW participated in the experimental design. KAH designed and performed the amplification, quantification and genotyping experiments. YQ per-formed the statistical analysis. AWB, YQ, KAH and RAW participated in the interpretation of the data, and YQ, KAH, RW and SJC helped to draft the manuscript. All authors read and approved the final manuscript.
Acknowledgements
The authors acknowledge the contribution of Michael B. Beerman to data management and Cynthia Glaser, Ian Barrow and Jessica Hartwell to geno-typing. This research was supported by the Intramural Research Program of the NCI.
References
1. Collins FS, Morgan M, Patrinos A: The Human Genome Project: lessons from large-scale biology. Science 2003, 300:286-290.
2. Risch N, Merikangas K: The future of genetic studies of complex human diseases. Science 1996, 273:1516-1517.
3. Carlson CS, Eberle MA, Kruglyak L, Nickerson DA: Mapping com-plex disease loci in whole-genome association studies. Nature 2004, 429:446-452.
4. Matsuzaki H, Loi H, Dong S, Tsai YY, Fang J, Law J, Di X, Liu WM, Yang G, Liu G, Huang J, Kennedy GC, Ryder TB, Marcus GA, Walsh PS, Shriver MD, Puck JM, Jones KW, Mei R: Parallel genotyping of over 10,000 SNPs using a one-primer assay on a high-density oligonucleotide array. Genome Res 2004, 14:414-425.
5. Telenius H, Carter NP, Bebb CE, Nordenskjold M, Ponder BA, Tun-nacliffe A: Degenerate oligonucleotide-primed PCR: general amplification of target DNA by a single degenerate primer.
Genomics 1992, 13:718-725.
6. Tanabe C, Aoyagi K, Sakiyama T, Kohno T, Yanagitani N, Akimoto S, Sakamoto M, Sakamoto H, Yokota J, Ohki M, Terada M, Yoshida T, Sasaki H: Evaluation of a whole-genome amplification method based on adaptor-ligation PCR of randomly sheared genomic DNA. Genes Chromosomes Cancer 2003, 38:168-176. 7. Blanco L, Bernad A, Lazaro JM, Martin G, Garmendia C, Salas M:
Highly efficient DNA synthesis by the phage phi 29 DNA polymerase. Symmetrical mode of DNA replication. J Biol Chem 1989, 264:8935-8940.
8. Dean FB, Hosono S, Fang L, Wu X, Faruqi AF, Bray-Ward P, Sun Z, Zong Q, Du Y, Du J, Driscoll M, Song W, Kingsmore SF, Egholm M, Lasken RS: Comprehensive human genome amplification using multiple displacement amplification. Proc Natl Acad Sci U S A 2002, 99:5261-5266.
9. Lovmar L, Fredriksson M, Liljedahl U, Sigurdsson S, Syvanen AC:
Quantitative evaluation by minisequencing and microarrays reveals accurate multiplexed SNP genotyping of whole genome amplified DNA. Nucleic Acids Res 2003, 31:e129. 10. Lasken RS, Egholm M: Whole genome amplification: abundant
supplies of DNA from precious samples or clinical specimens. Trends Biotechnol 2003, 21:531-535.
11. Rook MS, Delach SM, Deyneko G, Worlock A, Wolfe JL: Whole genome amplification of DNA from laser capture-microdis-sected tissue for high-throughput single nucleotide polymor-phism and short tandem repeat genotyping. Am J Pathol 2004,
164:23-33.
12. Handyside AH, Robinson MD, Simpson RJ, Omar MB, Shaw MA, Grudzinskas JG, Rutherford A: Isothermal whole genome ampli-fication from single and small numbers of cells: a new era for preimplantation genetic diagnosis of inherited disease. Mol Hum Reprod 2004, 10:767-772.
13. Whitaker JP, Cotton EA, Gill P: A comparison of the character-istics of profiles produced with the AMPFlSTR SGM Plus multiplex system for both standard and low copy number (LCN) STR DNA analysis. Forensic Sci Int 2001, 123:215-223. 14. Sobel E, Papp JC, Lange K: Detection and integration of
genotyp-ing errors in statistical genetics. Am J Hum Genet 2002,
70:496-508.
15. Bergen AW, Qi Y, Haque KA, Welch RA, Garcia-Closas M, Chanock SJ, Vaught J, Castle PE: Effects of electron-beam irradiation on whole genome amplification. Cancer Epidemiol Biomarkers Prev 2005, 14:1016-1019.
16. Bergen AW, Haque KA, Qi Y, Beerman MB, Garcia-Closas M, Roth-man N, Chanock SJ: Comparison of yield and genotyping per-formance of multiple displacement amplification and OmniPlextrade mark whole genome amplified DNA gener-ated from multiple DNA sources. Hum Mutat 2005, 26:262-270. 17. Langmore JP: Rubicon Genomics, Inc. Pharmacogenomics 2002,
3:557-560.
18. Wang G, Maher E, Brennan C, Chin L, Leo C, Kaur M, Zhu P, Rook M, Wolfe JL, Makrigiorgos GM: DNA amplification method tol-erant to sample degradation. Genome Res 2004, 14:2357-2366. 19. Bark C, Pettengill J, Tsai YBP, Golembieski J, Gearhart J, Stewart L,
Zilka M, Doheny K: Performance of whole genome amplified samples for microsatellite genotyping.: 2004/10/29. Bethesda, MD, The American Society of Human Genetics; 2004.
20. Dickson PA, Montgomery GW, Henders A, Campbell MJ, Martin NG, James MR: Evaluation of multiple displacement amplification in a 5 cM STR genome-wide scan. Nucleic Acids Res 2005,
33:e119.
21. Sun G, Kaushal R, Pal P, Wolujewicz M, Smelser D, Cheng H, Lu M, Chakraborty R, Jin L, Deka R: Whole-genome amplification:
rel-Publish with BioMed Central and every scientist can read your work free of charge "BioMed Central will be the most significant development for disseminating the results of biomedical researc h in our lifetime."
Sir Paul Nurse, Cancer Research UK Your research papers will be:
available free of charge to the entire biomedical community peer reviewed and published immediately upon acceptance cited in PubMed and archived on PubMed Central yours — you keep the copyright
Submit your manuscript here:
http://www.biomedcentral.com/info/publishing_adv.asp
BioMedcentral ative efficiencies of the current methods. Leg Med (Tokyo) 2005,
7:279-86.
22. Pastinen T, Raitio M, Lindroos K, Tainola P, Peltonen L, Syvanen AC:
A system for specific, high-throughput genotyping by allele-specific primer extension on microarrays. Genome Res 2000,
10:1031-1042.
23. Fan JB, Oliphant A, Shen R, Kermani BG, Garcia F, Gunderson KL, Hansen M, Steemers F, Butler SL, Deloukas P, Galver L, Hunt S, McBride C, Bibikova M, Rubano T, Chen J, Wickham E, Doucet D, Chang W, Campbell D, Zhang B, Kruglyak S, Bentley D, Haas J, Rigault P, Zhou L, Stuelpnagel J, Chee MS: Highly parallel SNP genotyping. Cold Spring Harb Symp Quant Biol 2003, 68:69-78. 24. Chee M, Yang R, Hubbell E, Berno A, Huang XC, Stern D, Winkler J,
Lockhart DJ, Morris MS, Fodor SP: Accessing genetic informa-tion with high-density DNA arrays. Science 1996, 274:610-614. 25. Barker DL, Hansen MS, Faruqi AF, Giannola D, Irsula OR, Lasken RS, Latterich M, Makarov V, Oliphant A, Pinter JH, Shen R, Sleptsova I, Ziehler W, Lai E: Two methods of whole-genome amplification enable accurate genotyping across a 2320-SNP linkage panel. Genome Res 2004, 14:901-907.
26. Paez JG, Lin M, Beroukhim R, Lee JC, Zhao X, Richter DJ, Gabriel S, Herman P, Sasaki H, Altshuler D, Li C, Meyerson M, Sellers WR:
Genome coverage and sequence fidelity of phi29 polymer-ase-based multiple strand displacement whole genome amplification. Nucleic Acids Res 2004, 32:e71.
27. Tranah GJ, Lescault PJ, Hunter DJ, De Vivo I: Multiple displace-ment amplification prior to single nucleotide polymorphism genotyping in epidemiologic studies. Biotechnol Lett 2003,
25:1031-1036.
28. Pask R, Rance HE, Barratt BJ, Nutland S, Smyth DJ, Sebastian M, Twells RC, Smith A, Lam AC, Smink LJ, Walker NM, Todd JA: Inves-tigating the utility of combining phi29 whole genome ampli-fication and highly multiplexed single nucleotide polymorphism BeadArray genotyping. BMC Biotechnol 2004,
4:15.
29. Packer BR, Yeager M, Staats B, Welch R, Crenshaw A, Kiley M, Eckert A, Beerman M, Miller E, Bergen A, Rothman N, Strausberg R, Chanock SJ: SNP500Cancer: a public resource for sequence validation and assay development for genetic variation in candidate genes. Nucleic Acids Res 2004, 32 Database issue:D528-D532.
30. Haque KA, Pfeiffer RM, Beerman MB, Struewing JP, Chanock SJ, Ber-gen AW: Performance of high-throughput DNA quantifica-tion methods. BMC Biotechnol 2003, 3:20.