Modelling Drivers’ Braking Behaviour and Comfort
Under Normal Driving
by
Stavroula Panagiota Deligianni
A Doctoral Thesis
Submitted in partial fulfilment of the requirements for the award of
Doctor of Philosophy of Loughborough University
i
Abstract
The increasing growth of population and a rising number of vehicles, connected to an individual, demand new solutions to reduce traffic delays and enhance road safety. Autonomous Vehicles (AVs) have been considered as an optimal solution to overcome those problems. Despite the remarkable research and development progress in the area of (semi) AVs over the last decades, there is still concern that occupants may not feel safe and comfortable due to the robot-like driving behaviour of the current technology. In order to facilitate their rapid uptake and market penetration, ride comfort in AVs must be ensured.
Braking behaviour has been identified to be a crucial factor in ride comfort. There is a dearth of research on which factors affect the braking behaviour and the comfort level while braking and which braking profiles make the occupants feel safe and comfortable. Therefore, the primary aim of this thesis is to model the deceleration events of drivers under normal driving conditions to guide comfortable braking design. The aim was achieved by exploiting naturalistic driving data from three projects: (1) the Pan-European TeleFOT (Field Operational Tests of Aftermarket and Nomadic Devices in Vehicles) project, (2) the Field Operational Test (FOT) conducted by Loughborough University and Original Equipment Manufacturer (OEM), and (3) the UDRIVE Naturalistic Driving Study.
A total of about 35 million observations were examined from 86 different drivers and 644 different trips resulting in almost 10,000 deceleration events for the braking features analysis and 21,600 deceleration events for the comfort level analysis. Since deceleration events are nested within trips and trips within drivers, multilevel mixed-effects linear models were employed to develop relationships between deceleration value and duration and the factors influencing them. The examined factors were kinematics, situational, driver and trip characteristics with the first two categories to affect the most the deceleration features. More specifically, the initial speed and the reason for braking play a significant role, whereas the driver’s characteristics, i.e. the age and gender do not affect the deceleration features, except for driver’s experience which significantly affects the deceleration duration.
ii
An algorithm was developed to calculate the braking profiles, indicating that the most used profile follows smooth braking at the beginning followed by a harder one. Moreover, comfort levels of drivers were analysed using the Mixed Multinomial Logit models to identify the effect of the explanatory factors on the comfort category of braking events. Kinematic factors and especially TTC and time headway (THW) were found to affect the most the comfort level. Particularly, when TTC or THW are increased by 1 second, the odds of the event to be “very comfortable” are respectively 1.03 and 4.5 times higher than being “very uncomfortable”. Moreover, the driver’s characteristic, i.e. age and gender affect significantly the comfort level of the deceleration event. Findings from this thesis can support vehicle manufacturers to ensure comfortable and safe braking operations of AVs.
iii
Dedication
I would like to dedicate my thesis to the memory of my father,
iv
Acknowledgements
I would like to take this opportunity to thank all those people who have supported me throughout this PhD project. Foremost, I would like to express my sincere gratitude to my supervisors, Professor Mohammed Quddus, Professor Andrew Morris and Doctor Aaron Anvuur for their constant support, guidance and constructive criticism during my doctoral studies. It has been an honour to work with all of them.
Further, I would like to acknowledge the assistance from the Design School department of Loughborough University and specifically Dr Steven Reed and Dr Ruth Welsh, considering the data provision and allowance.
I am also grateful to the fellow researchers in the Transport Study Group and the Research Hub for the friendly and fruitful atmosphere, the continuous exchange of ideas and useful feedback.
Moreover, I would like to thank all my friends for their constant support throughout this PhD journey. It has been a journey with immeasurable ups and downs. Special thanks to my close friends Simon, Andria, Christos, Christina, Danis, Eleni, George, Nasia, Nineta, Polina and Vasia for creating a relaxing atmosphere and making this experience much more enjoyable and interesting.
Finally, I want to deeply thank my parents, Evangelos and Dionysia, as well as my brother, Tasos for their love, patience and constant support. Their contribution was priceless and without them, I would not have completed this PhD. They always believed in me and didn’t let me be frustrated when things were difficult.
v
Contents
Abstract ... i Dedication ... iii Acknowledgements ... iv Contents ... v List of Figures ... xList of Tables ... xiv
List of Acronyms ... xix
1 Introduction ... 1
1.1 General background ... 1
1.2 Problem statement ... 5
1.3 Research importance ... 9
1.4 Aim and Objectives ... 10
1.5 Thesis outline ... 10
2 Literature Review of Deceleration Behaviour and Ride Comfort ... 13
2.1 Human Factors regarding vehicle automation... 14
2.2 Ride comfort ... 20
2.3 Driving Behaviour ... 26
2.3.1 Braking / Deceleration behaviour ... 31
2.4 Research Gap ... 34
vi
3.1 Review of Data Collection Approaches ... 37
3.1.1 Naturalistic Driving Study ... 38
3.1.2 Field Operational Tests ... 42
3.1.3 Comparison ... 44
3.2 General data characteristics across projects ... 45
3.3 TeleFOT project ... 48
3.4 OEM project ... 56
3.5 Combining the OEM and TELEFOT project ... 62
3.6 UDRIVE Data ... 63
3.6.1 UDRIVE Comfort Modelling ... 71
3.7 Summary... 75
4 Methodology ... 80
4.1 Research Design ... 80
4.2 Deceleration Events and Deceleration Profiles ... 82
4.2.1 Detection of the deceleration events ... 82
4.2.2 Estimation of the deceleration profiles ... 85
4.3 Multilevel modelling ... 90
4.3.1 Introduction ... 90
4.3.2 Description of the model ... 95
4.4 Cluster analysis ... 102
vii
4.5.1 Calculation of comfort indices ... 107
4.5.2 Description of the model ... 111
4.6 Conclusion ... 116
5 Results of the Analyses: Deceleration Events ... 119
5.1 Deceleration Profiles ... 119
5.2 Multilevel modelling ... 128
5.2.1 OEM... 129
5.2.2 TeleFOT ... 141
5.2.3 Combination of OEM and TeleFOT ... 146
5.2.4 UDRIVE ... 152
5.3 Summary... 165
6 Results of Comfort Modelling ... 168
6.1 Classification A (4 categories) ... 169
6.1.1 Statistical analysis I (All variables) ... 169
6.1.2 Statistical analysis II (All observations) ... 177
6.2 Classification B (3 categories) ... 181
6.2.1 Statistical analysis I (All variables) ... 181
6.2.2 Statistical analysis II (All observations) ... 186
6.3 Classification C (2 categories) ... 189
6.3.1 Statistical analysis I (All variables) ... 189
viii
6.4 Summary... 195
7 Discussion and Recommendations ... 197
7.1 The deceleration profiles and the influencing factors of deceleration behaviour ... 197
7.1.1 Deceleration and driver factors ... 199
7.1.2 Deceleration and trip factors ... 200
7.1.3 Deceleration and kinematic factors ... 201
7.1.4 Deceleration and situational factors ... 203
7.2 Comfort affecting factors ... 206
7.2.1 Comfort level and kinematic factors ... 208
7.2.2 Comfort level and driver factors ... 210
7.2.3 Comfort level and situational factors ... 211
7.3 Recommendations for practice ... 213
7.3.1 Car manufacturers ... 213
7.3.2 Researchers ... 216
7.3.3 Drivers ... 218
7.3.4 Regulators and legislators ... 219
7.4 Summary... 220
8 Conclusion... 222
8.1 Research objectives revisited ... 222
ix
8.3 Limitations of the research ... 228
8.4 Further research ... 229
References ... 232
Appendices ... 251
Appendix A ... 252
x
List of Figures
Figure 1.1: Challenges that arise with autonomous vehicle use ... 4
Figure 1.2: Outline of the thesis ... 12
Figure 2.1: The levels of Vehicle Automation (NHTSA, 2013) ... 18
Figure 2.2: Factors influencing ride comfort in autonomous cars ... 22
Figure 3.1: Conventional methods for data collection in studying driving ... 40
Figure 3.2: The necessary steps to conduct an FOT (FESTA Consortium, 2008) ... 44
Figure 3.3: Block diagram for the data analysis (Lassarre et al., 2008) ... 44
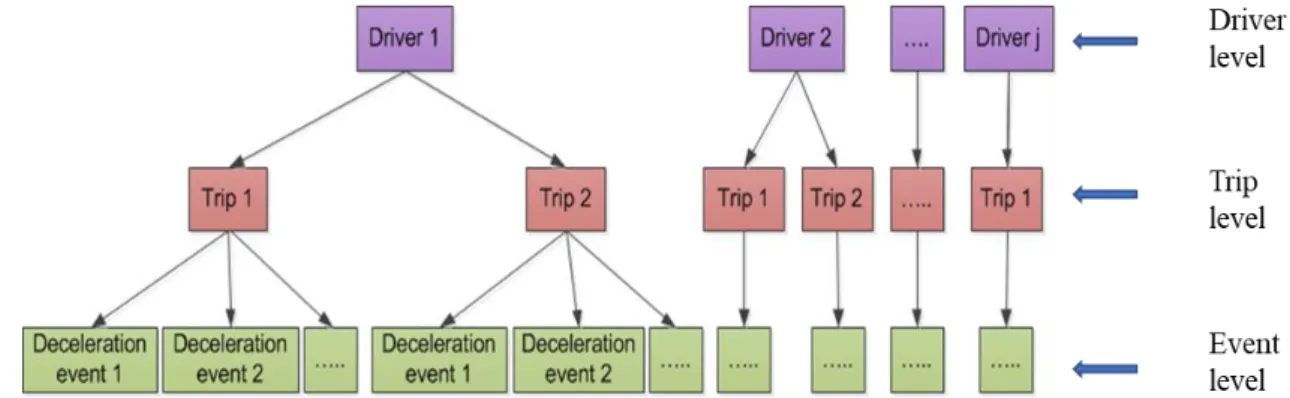
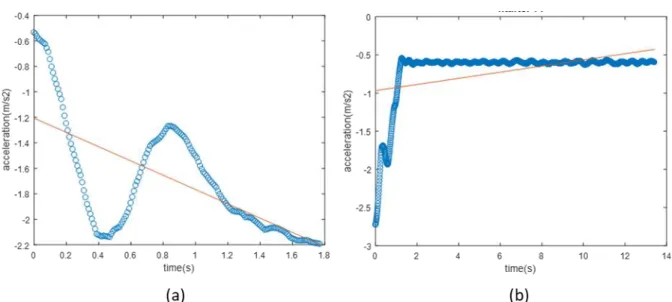
Figure 3.4: The hierarchical structure of the traffic data for the deceleration events 47 Figure 3.5: The route of the field test (a), the view from the 4 cameras (b) and the acceleration-time and speed-time diagram for the whole trip from the Race Technology programme (c). ... 49
Figure 3.6: Characteristics of extracted deceleration events. ... 52
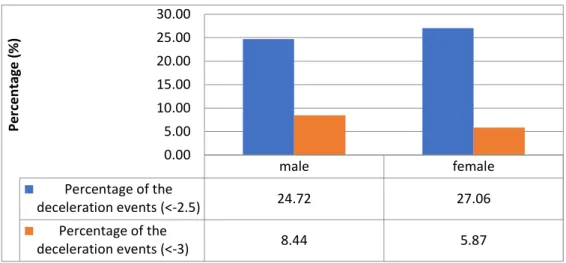
Figure 3.7: Percentage of different deceleration values based on the gender of the driver. ... 55
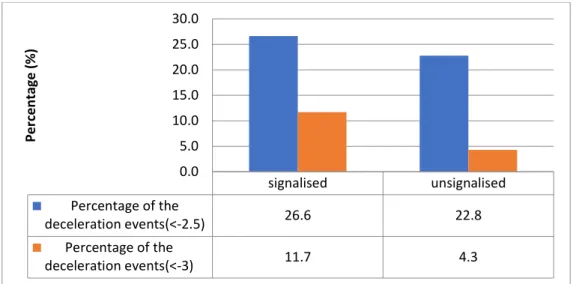
Figure 3.8: Percentage of different deceleration values based on signalised or non-signalised road elements ... 56
Figure 3.9: The three routes of the field test ... 58
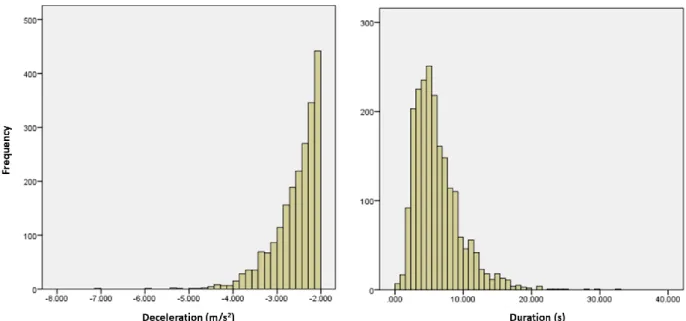
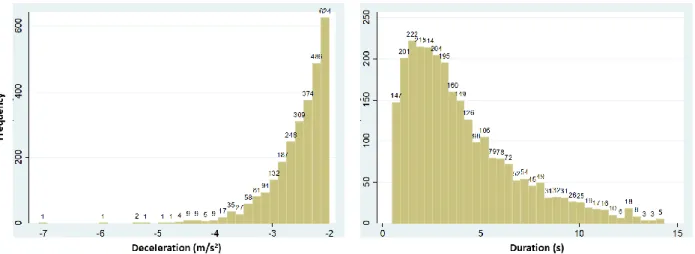
Figure 3.10: The distribution of the deceleration values (left) and of the duration(right) of the events ... 60
Figure 3.11: Diagram of the initial speed vs the mean deceleration (left) and the mean duration (right) ... 60
xi
Figure 3.12: Histogram of the deceleration values and the duration for the
combination dataset ... 63
Figure 3.13: FESTA V-Shape steps followed by UDRIVE project ... 64
Figure 3.14: Histograms of different variables from the UDRIVE dataset ... 69
Figure 3.15: Cumulative frequency distribution for the max deceleration and the jerk ... 70
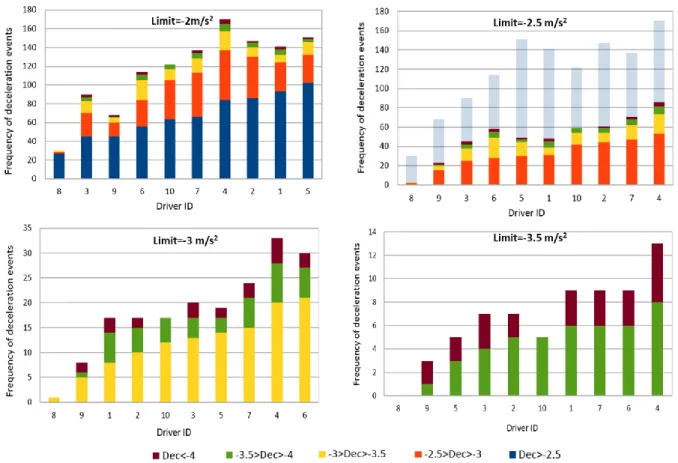
Figure 3.16: Frequency of the deceleration event per driver based on different
thresholds ... 70
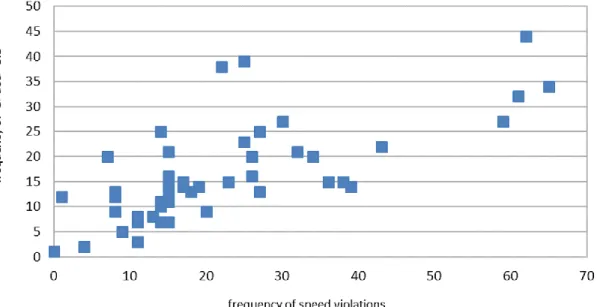
Figure 3.17: Plot of the frequency of driver’s speed violations against the amount of the deceleration events ... 71
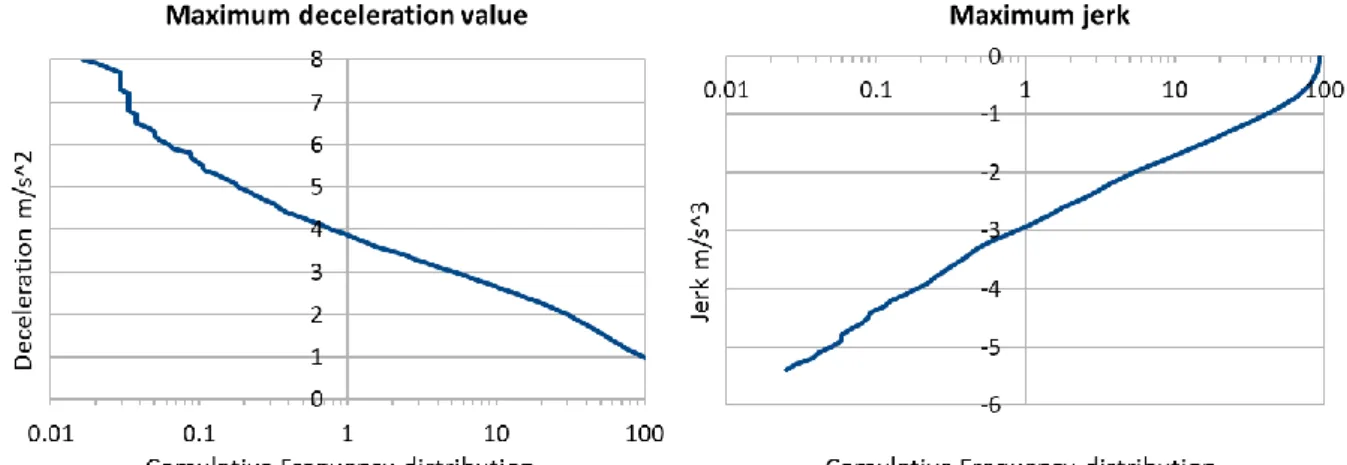
Figure 3.18: Cumulative Frequency of the deceleration value and the jerk ... 72
Figure 3.19: Boxplot of initial TTC and the initial THW for each comfort category ... 74
Figure 4.1: The flowchart of the research design ... 82
Figure 4.2: Examples of the problems during defining the deceleration events ... 84
Figure 4.3: Example of the separation of the deceleration event ... 87
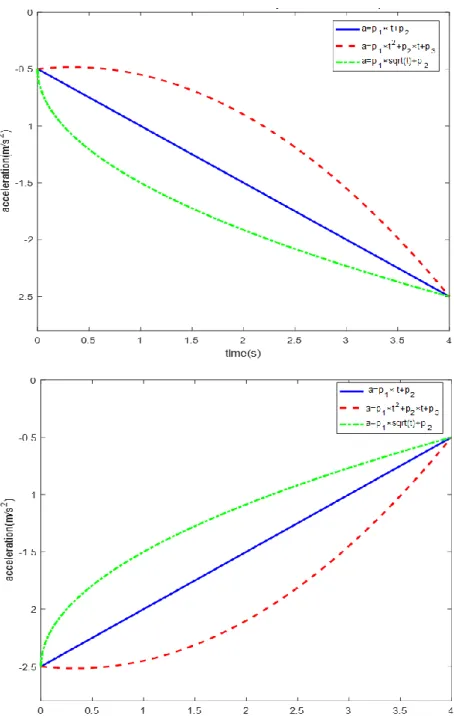
Figure 4.4: Tested functions for the first part (above diagram) and the second part (below diagram) of the deceleration event ... 88
Figure 4.5: Structure of three-level hierarchical data ... 90
Figure 4.6: The hierarchical structure of the data of this work ... 94
Figure 4.7: Prediction lines from a random intercept model for 4 different groups ... 99
Figure 4.8: Prediction lines from a random intercept and random slope model for 4 different groups ... 101
xii
Figure 4.10: Distribution of the deceleration events at Classification A ... 110
Figure 4.11: The flowchart of the methodology ... 118
Figure 5.1: Plots of the equations representing the press of the brake ... 122
Figure 5.2: Plots of the equations representing the release of the brake ... 123
Figure 5.3: Example of the cluster analysis for Parabola 1 ... 124
Figure 5.4: Plots of the equations for the first part of the deceleration based on the duration ... 125
Figure 5.5: Plots of the equations for the second part of the deceleration based on the duration ... 126
Figure 5.6: Plots representing the driver and trip effects in the deceleration values for the 2-Level null models for OEM dataset ... 133
Figure 5.7: Quantile quantile plot of the driver (left) and the trip (right) effect in the 3-Level null model for OEM data ... 134
Figure 5.8: Magnitudes of the effects in the 3-Level null model for OEM data ... 135
Figure 5.9: Plots representing the driver and trip effects in the deceleration values for the 2-Level null models for TeleFOT dataset ... 142
Figure 5.10: Boxplots of the group effect of the drivers and the trips for the deceleration (Combination dataset)... 147
Figure 5.11: Features of the five clusters (Combination dataset) ... 150
Figure 5.12: Random effect of the max_jerk in the duration for the driver and the trip level ... 159
Figure 5.13: Features of the five clusters (UDRIVE dataset) ... 162
Figure 6.1: Predicted probabilities for THW based on the best-mixed logit model for Statistical Analysis I and Classification A ... 174
xiii
Figure 6.2: The density of beta (β) considering three different distributions for the “slightly comfortable” category ... 177
Figure 6.3: Predicted probabilities for THW based on the best-mixed logit model for Statistical Analysis I and Classification B ... 185
Figure 6.4: Zoom in version of Figure 6.3 ... 186
Figure 6.5: Predicted probabilities for TTC based on the TTC mixed logit model for Statistical Analysis I and Classification C ... 193
Figure 6.6: Predicted probabilities for TTC based on the mixed logit model (TTC and THW random effect) for Statistical Analysis I and Classification C ... 193
Figure 6.7: Predicted probabilities for THW based on the mixed logit model (TTC and THW random effect) for Statistical Analysis I and Classification C ... 194
Figure 7.1: Basic Block Diagram (Forrest et al., 2007, Campbell et al., 2010, Ziegler et al., 2014, Urmson et al., 2008) ... 214
xiv
List of Tables
Table 2.1: Human factor challenges regarding Autonomous driving ... 16
Table 2.2: Kinematic factors connecting to the disturbances ... 24
Table 2.3: Information about Driving Behaviour ... 28
Table 2.4: Factors affecting the deceleration behaviour ... 34
Table 3.1: Examples of the categories of the variables ... 47
Table 3.2: Data structure for three-level linear models ... 47
Table 3.3: Percentage of deceleration events by reason for braking ... 50
Table 3.4: Percentage of deceleration events by traffic density ... 50
Table 3.5: Descriptive statistics of the variables during deceleration events ... 51
Table 3.6: Average deceleration statistics based on different factors ... 54
Table 3.7: Driver population by age and gender ... 57
Table 3.8: Deceleration features’ statistics based on different factors... 61
Table 3.9: Driver’s information for the combination dataset ... 63
Table 3.10: Distribution of vehicles for the UDRIVE project ... 65
Table 3.11: Drivers’ characteristics in UDRIVE project ... 65
Table 3.12: The extracted time series in UDRIVE dataset ... 66
Table 3.13: The available explanatory factors in the UDRIVE dataset ... 67
Table 3.14: Descriptive statistics of important variables in UDRIVE dataset ... 69
Table 3.15: Frequency of the deceleration events of classification A ... 72
xv
Table 3.17: Frequency of the deceleration events of classification C ... 73
Table 3.18: Explanatory variables used in the logit modelling ... 73
Table 3.19: The extracted variables for each dataset ... 76
Table 3.20: Comparison of the characteristics of the three datasets ... 79
Table 4.1: The research design of this PhD ... 80
Table 4.2: The criteria for the detection of the deceleration events ... 85
Table 4.3: Strategies to deal with nested data ... 92
Table 4.4: Procedure for selecting the best number of clusters ... 106
Table 4.5: Thresholds for creating four comfort categories (Classification A) ... 109
Table 4.6: Thresholds for creating three comfort categories (Classification B) ... 111
Table 4.7: Thresholds for creating TWO comfort categories (Classification C) ... 111
Table 5.1: Distribution of the deceleration profiles for all the datasets ... 120
Table 5.2: The mean value of the Adjusted R2 of the fitted equations ... 120
Table 5.3: Equations describing the press of the brake for all the datasets ... 121
Table 5.4: Equations describing the release of the brake for all the datasets ... 122
Table 5.5: Results of the detailed analyses of the first part of the deceleration profiles based on the duration... 124
Table 5.6: Results of the detailed analyses of the second part of the deceleration profiles based on the duration ... 125
Table 5.7: Different clusters to investigate the factors affecting the braking profile 127 Table 5.8: Variables including in the analysis of the OEM data ... 129
xvi
Table 5.10: LR test for the 2-Level null models of deceleration value for OEM dataset ... 131
Table 5.11: Predicted random effects and standard errors for each driver for 2-Level driver model ... 132
Table 5.12: LR test for the 3-Level null model of deceleration value for OEM dataset ... 133
Table 5.13: Predicted random effects and standard errors for each driver for the 3-Level model ... 134
Table 5.14: Results of the Driver Level mixed effect for Vehicle C model for OEM Data ... 136
Table 5.15: Results of the trip-level random intercept model of the duration for the OEM data ... 139
Table 5.16: Number of observations for each level of the analysis for TeleFOT data ... 141
Table 5.17: Results of the trip-Level random intercept and random slope for traffic light model for deceleration (TeleFOT dataset) ... 143
Table 5.18: Trip-Level random intercept model for the Duration (TeleFOT dataset) ... 145
Table 5.19: Number of observations for each level of the analysis for combination dataset ... 146
Table 5.20: Results of the 3-Level models for the deceleration value (Combination dataset) ... 148
Table 5.21: Results from Multilevel linear regression models in the 5 clusters
(Combination dataset) ... 151
Table 5.22: Results of the Drivel-Level models for the deceleration value (UDRIVE dataset) ... 153
xvii
Table 5.23: Results of the most parsimonious model for deceleration value in
statistical analysis II (UDRIVE dataset) ... 155
Table 5.24: Results of the best multilevel models for Duration in Statistical analysis I (UDRIVE dataset)... 157
Table 5.25: Results of the most parsimonious model for Duration in Statistical
analysis II (UDRIVE dataset) ... 160
Table 5.26: Results from multilevel linear regression models in the 5 clusters in the statistical analysis I (UDRIVE dataset) ... 163
Table 5.27: Results from Multilevel linear regression models in the 5 clusters in the statistical analysis II (UDRIVE dataset) ... 164
Table 6.1: Results of the logit model for Statistical Analysis I and Classification A 169
Table 6.2: Log-likelihood test for different mixed logit models for Statistical Analysis I and Classification A ... 172
Table 6.3: Results of the best-mixed logit model for Statistical Analysis I and
Classification A ... 172
Table 6.4: Results of the mixed logit model using lognormal distribution for Statistical Analysis I and Classification A ... 175
Table 6.5: Results of the mixed logit model using triangular distribution for Statistical Analysis I and Classification A ... 176
Table 6.6: Results of the logit model for Statistical Analysis II and Classification A 178
Table 6.7: Results of the mixed logit model with allowing random effect for speed for Statistical Analysis II and Classification A ... 180
Table 6.8: Results of the logit model for Statistical Analysis I and Classification B 181
Table 6.9: Log-likelihood test for different mixed logit models for Statistical Analysis I and Classification B ... 183
xviii
Table 6.10: Results of the best-mixed logit model for Statistical Analysis I and Classification B ... 184
Table 6.11: Results of the logit model for Statistical Analysis II and Classification B ... 186
Table 6.12: Results of the mixed logit model with allowing random effect for
intersection for Statistical Analysis II and Classification B ... 188
Table 6.13: Results of the logit model for Statistical Analysis I and Classification C ... 189
Table 6.14: Log-likelihood test for different mixed logit models for Statistical Analysis I and Classification C ... 191
Table 6.15: Results of the mixed logit model (TTC) for Statistical Analysis I and Classification C ... 191
Table 6.16: Results of the logit model for Statistical Analysis II and Classification C ... 194
xix
List of Acronyms
AASHTO American Association of State Highway and Transportation Officials ACC Adaptive Cruise Control
ADAS Advanced Driving Assistance Systems AIC Akaike Information Criterion
AISS Arnett Inventory of Sensation seeking AVs Autonomous Vehicles
BIC Bayesian Information Criterion CAN Controller Area Network
DBQ Driver behaviour Questionnaire FESTA Field opErational teSt supporT Action FOT Field Operational Tests
GEV Generalized extreme value GPS Global Positioning System
ICC Intraclass Correlation Coefficients LDWS Lane Departure Warning System LR Likelihood Ratio
MMNL Mixed Multinomial Logit MNL Multinomial Logit
MNP Multinomial Probit
NDS Naturalistic Driving Study
NHTSA National Highway Traffic Safety Administration
NL Nested Logit
OEM Original Equipment Manufacturer PTW Powered Two-Wheeler
SALSA Smart Application for Large Scale Analysis SHRP Strategic Highway Research Program
THW Time Headway
TTC Time to Collision
UDRIVE eUropean naturalistic Driving and Riding for Infrastructure and Vehicle safety and Environment
1
1 Introduction
1.1 General background
The invention of the car in the late 19th century revolutionised transport systems.
Vehicles have become an essential part of everyday life and the most popular mean of transport around the world, with their total number estimated to be 1.2 billion globally in 2014 (Voelcker, 2014). This number has grown rapidly, as in 2011 the estimated number of cars was 1 billion (Sousanis, 2011). Unfortunately, along with the increase in the number of cars, there has been an increase in road collisions. According to an estimate by the World Health Organization, 1.3 million people are killed and up to 50 million people incur non-fatal injuries in road collisions every year (World Health Organization, 2015). Moreover, road traffic injuries are the leading cause of deaths among young people, i.e. 15-29 years old. A total of 1793 people were killed in reported traffic collisions in Great Britain in 2017, 0% change since 2016 and there were 24,831 seriously injured and 170,993 casualties of all severity in reported road traffic accidents (Department for Transport, 2018). Another consequence of road collision is the costs to individuals, property and society. According to the 2017 Annual Report of International Transport Forum, the total cost of all reported and unreported road collisions accumulated to around GBP 35.5 billion a year (the unreported injuries were included for the first time in the total cost and it was around GBP 20 billion a year).
Previous studies identified human error as the dominant contributory factor to these collisions (Petridou and Moustaki, 2000; Lu et al., 2005; Elbanhawi et al., 2015). More specifically, the complex interactions between the driver, the vehicle and the environment are held responsible (Ungoren and Peng, 2005). According to the National Highway Traffic Safety Administration (NHTSA), human error is a contributing factor to 94% of the traffic collisions (Singh, 2015). Human errors are grouped by Umemura (2004) into three categories: cognitive errors (i.e. errors caused by oversights), judgment errors (e.g. misjudge the other’s vehicle speed or acceleration) and operation errors (e.g. failing to apply the brakes strongly enough in an
2
emergency). There are also other factors that can lead to a driver error and cause a collision such as distraction, fatigue, risk-taking attitudes, an overestimation of capabilities, as well as alcohol and drugs (Petridou, 2000).
Vehicle automation aims to take the driver out of the driving task to eliminate human error. The basic objectives of this new disruptive technology are a reduction in traffic collisions, an increase in safety, a smoother traffic flow and an increase in driver comfort (Lay and Saxton, 2000). In fact, the road towards full automation has been opened for quite some time by technology such as anti-lock braking system (ABS) and electronic stability. The absolute goal is the development of fully AVs. To date, different systems from the fields of computer science and robotics have been applied to passenger cars, which have formulated the Advanced Driving Assistance Systems (ADAS). ADAS applications (e.g. emergency braking, lane-keeping assistance, adaptive cruise control) help to avoid collisions by assisting the driver in their driving task continuously either by warning the driver or taking control of the car. Apart from the increase of safety, ADAS also aims to improve the comfort and the efficiency of the cars (Lu et al., 2005). Nevertheless, there are still significant challenges in reaching the necessary safety integrity at an affordable cost.
Autonomously driving cars (also known as robotic, autopilot, driverless or self-driving cars) have been the purpose of many robotics researchers (Petrovskaya and Thrun, 2009). An autonomous car is an AV capable of fulfilling the transportation capabilities of a traditional car. It is fundamentally defined as a passenger vehicle that drives by itself (Forrest et al., 2007). Some of the possible advantages and limitations from the use of AVs can be summarised as follows.
The possible benefits of AVs include the improvement of traffic safety by reducing collisions, more efficient traffic flow by reducing congestion and setting higher speed limits, increased highway capacity and reduction of the total number of cars through car sharing (Lay and Saxton, 2000; Forrest et al., 2007; Petrovskaya and Thrun, 2009; Stevens and Newman, 2013). Moreover, there are environmental and financial benefits since they will reduce vehicle emissions and fuel consumption and optimise fuel usage. Furthermore, they will provide extended mobility for elderly and disabled people and contribute to time-saving.
3
On the other hand, there are still many challenges regarding AVs use (Figure 1.1) (Stevens and Newman, 2013; Catapult Transport Systems, 2016; Barabás et al., 2017; BSI and Catapult Transport Systems, 2017). Particularly, concerns about the liability for accidents with AVs and possible damage to them, the loss of driving-related jobs and the absence of adequate policy (Elbanhawi et al., 2015). There is a lack of international standards and common policy frameworks (Catapult Transport Systems, 2016). Another challenge is the reliability of the software, the systems and the sensors used in AVs and their integration, as well as cybersecurity (Parasuraman et al., 2000; Stevens and Newman, 2013; Catapult Transport Systems, 2016). The high cost of manufacturing AVs, the integration of AVs with the existing transport systems and changing adequately the current road infrastructure are more limitations (Forrest et al., 2007). Moreover, modelling AVs and particularly in mixed traffic conditions could prove the impacts and the potential advantages of AVs, although there is a lack of data on system and human performance (Stevens and Newman, 2013). It might also create ethical problems, for example, when an AV cannot avoid a collision, which criteria should it take into consideration to plan its action (NHTSA, 2016). Finally, the user’s acceptance is one of the major challenges and it is connected to human factors (Stevens and Newman, 2013; BSI and Catapult Transport Systems, 2017). Those challenges are related to different stakeholders, i.e. cars manufacturers, researchers, legislators, regulators, insurers and drivers (Catapult Transport Systems, 2016).
This research, on the one hand, approaches different challenges by investigating braking behaviour, such as human factors, standards, and system design. On the other hand, it also mitigates among different stakeholders, such as researchers, drivers, and car manufacturers.
4
Figure 1.1: Challenges that arise with autonomous vehicle use
The challenges concerning human factors in relation to AVs must be overcome to ensure rapid market penetration. Winning the trust of people to allow a computer to drive a vehicle for them is one of the major challenges (Stevens and Newman, 2013) and it is closely connected with people feeling safe and comfortable inside AVs (Elbanhawi et al., 2015) (Figure 1.1). In general, if people believe that an automated system is untrustworthy, they may not accept it or use it even though it is actually reliable and safe (Parasuraman and Riley, 1997). People are reluctant to trust an autonomous system, for fear that it will go wrong, and they will be blamed for it (Parasuraman and Riley, 1997; Lee and See, 2004). By establishing common policy and international standards, that will clarify the legal liability, the trust of people on the new technology could increase. Previous research on human challenges has been conducted in the aviation field, showing that not only the lack of trust but also the overreliance on the system may cause problems, like the failure of monitoring (Majumdar et al., 2004; Young et al., 2007). Trust is closely connected with the user’s acceptance. However, while trust may be increased with greater familiarity, acceptance does not (Somers and Weeratunga, 2015).
5
In order for the wide acceptance of AVs and their market penetration to happen, it should be ensured that the passengers feel safe and comfortable inside them (Kraus et al., 2010). Research has shown that different levels of automation in vehicles lead to different human factors problems, such as loss of the driving skill, loss of situational awareness of the driver, high or too-low workload and insecurity as far as the responsibility of the vehicle is concerned (Toffetti et al., 2009). Particularly, semi-AVs seem to be more challenging in relation to human factors, since a safe and fast transition between autonomous and human function is necessary for their safe operation (Stevens and Newman, 2013). Furthermore, it is important to develop an appropriate Human Machine Interface (HMI) to inform passengers about AV’s actions (Reuschenbach et al., 2010). Finally, it is necessary to develop suitable human factor research tools i.e. the appropriate evaluation tools (e.g. simulators, vehicles) to evaluate the driver, the system and their interaction and to conduct research to overcome the abovementioned problems (Somers and Weeratunga, 2015).
1.2 Problem statement
Research on (semi-) AVs has attracted significant interest from the research community worldwide in recent years (Urmson et al., 2008; Silberg and Wallace, 2012; Wei et al., 2013; Le Vine and Polak, 2014; Lefèvre, Carvalho, and Borrelli, 2015). Fundamentally, vehicle automation aims to eliminate or decrease human involvements from the routine tasks of driving (Chiang et al., 2006). Some of the most challenging research issues in vehicle automation involve the need to understand human interactions with automation technologies, human needs and expectations to gain trust and acceptance (Lay and Saxton, 2000).
Despite the remarkable research and development progress in the area of (semi-) AVs over the last decades, there is still concern that occupants may not feel comfortable due to: a) the unnatural driving performance of the current technology (Elbanhawi et al., 2015; Kuderer et al., 2015; Lefèvre, et al., 2015a; Scherer et al., 2015) and b) the feeling of uncertainty people have about whether the AV recognizes and evaluates the traffic situation correctly or whether a critical manoeuvre has to be performed (Kraus et al., 2010). Specifically, the problem is based on the fact that the kinematics of (semi-) AVs are likely to differ from human-driven vehicles and ignore diverse driving
6
styles due to the differences in perception, information processing, decision-making and actuation capabilities of humans and machines (Le Vine et al., 2015a). Therefore, there would be a mismatch between preferred driving style and the AV’s driving style effectively causing physical and mental discomfort. Hence, to ensure ride comfort for different users, it is essential to ensure that (semi-) AVs adopt a human-like driving performance, i.e. a driving style according to user preferences (Kraus et al., 2010; Scherer et al., 2015).
Ride comfort is a subjective concept, which has been studied since early 1970, mostly concerning public transport (Gebhard, 1970; Hoberock, 1976; Constantin et al., 2014; Elbanhawi et al., 2015; Le Vine et al., 2015a). Ride comfort is a crucial factor since the acceptance of any transportation system is affected by the ride quality to which passengers are exposed. Accordingly, ride comfort is a major challenge for the development and acceptance of (semi-) AVs (Kraus et al., 2010; Kuderer et al., 2015; Lefèvre, et al., 2015a) and in general for the analysis of vehicle dynamics (Wu et al., 2013). While under-designing a system with respect to ride comfort may make it unacceptable to the public, overdesigning can be extremely expensive (Smith et al., 1978). Driver comfort is understood as a state which is achieved by the removal or absence of uneasiness and distress. For passengers not conducting any obligatory tasks, the ride discomfort can relate to general annoyance, inability to fall asleep, and difficulties for reading and writing (Marjanen, 2010).
Moreover, the perception of comfort may vary considerably among drivers, which makes studying ride comfort more challenging (Kuderer et al., 2015). Research has proven that human drivers prefer different driving styles based on their personality, the age, the gender, the motivations and the emotions (Yusof and Karjanto, 2015). In general, driver behaviour is complicated due to heterogeneity among drivers (Elbanhawi et al., 2015): While some drivers might prefer a more aggressive driving style with high accelerations and decelerations, others might prefer a safer one (Kuderer et al., 2015). Therefore, individual driving style, which is the dynamic behaviour of a driver on the road (Murphey et al., 2009), may significantly affect the idea of comfort.
7
Even though the concept of comfort is not perfectly clear, researchers have traditionally investigated ergonomic factors such as seat vibrations. Although, the development of AVs would lead to the examination of other factors beyond in-car ergonomics such as vehicle control, motion sickness and safe distance keeping (Elbanhawi et al., 2015). Specifically, some factors that clearly affect the comfort inside a vehicle are temperature, vibration, acoustic sound, space headway, time headway (THW), time gap, TTC, longitudinal and lateral acceleration /deceleration, jerk (the first derivative of acceleration), seating type, the perceived personal security etc. (Els, 2005; Chiang et al., 2006; Wu et al., 2009; Elbanhawi et al., 2015; Kuderer et al., 2015; Le Vine et al., 2015b). The literature has revealed that the most important factors for ride comfort are longitudinal acceleration and deceleration as well as the jerk (the derivative of acceleration). Occupants are subjected to accelerations in different directions because of vehicle vibration and road roughness, which makes them feel uncomfortable (Wu et al., 2013). Human reaction to vibration-braking depends on three factors (Marjanen, 2010): 1) characteristics of the vibration, 2) characteristics of the human and 3) characteristics of the environment.
Specifically, braking makes people feel ‘uncomfortable’ and ‘scared’ since sharp deceleration is an accident surrogate (Bagdadi, 2013). Therefore, a (semi-) AV should decelerate in a manner avoiding mental discomfort to both, people inside and outside the vehicle. Regarding the braking performance, stress and nervousness are apparent (Kazumoto et al., 2006):
▪ if the timing at which the vehicle automatically brakes differs from the driver’s own judgment,
▪ whether the level of deceleration is greater than the driver’s expectation or ▪ if the deceleration profile does not follow the one that the driver is used to. It is, therefore, considered important to fully understand drivers’ braking behaviour and the factors affecting it in different scenarios with respect to the level of braking (e.g. harsh/sharp, normal, conservative), the duration of braking as well as the level of comfort while braking. Despite valuable contributions in the literature so far about the kinematic, driver, and situational factors affecting deceleration, it is not entirely clear how all those factors, when cooccurring, influence the deceleration behaviour. The
8
question is: Could the resulting relationships be used to ensure comfort in braking systems by personalising it and choosing the appropriate deceleration threshold for each driving scenario?
In the context of (semi-) AVs and generally braking systems, it is also considered important to identify the deceleration profiles (e.g. how the deceleration values change over time since the start of braking) in the context of normal driving. Up to date literature has focused on modelling the deceleration against speed. Can deceleration profiles that were developed from normal driving be used to reduce discomfort during braking?
It should, however, be noted that safety always comes first, and hard deceleration is sometimes necessary in the case of an emergency situation in order to avoid a conflict or a collision. As a result, passenger tolerance to longitudinal deceleration will affect the design of the vehicle’s braking system (Hoberock, 1976). An efficient approach in designing (semi-) AVs would be to monitor and identify how human drivers perform the driving tasks and then analyse and characterise such behaviours with the aim of developing various thresholds to implement them into the system (Goodrich et al., 1999). Vehicle automation with respect to braking is then possible to be designed emulating human behaviour.
This research aims to thoroughly explore the deceleration behaviour of drivers using naturalistic driving data from two Field Operational Tests (FOT) and one Naturalistic Driving Study (NDS)1. Consequently, the braking events observed within normal
driving will be analysed. The definition of normal driving is ‘subjective’ and there is no generic definition in the literature. Moreover, perceptions of normal driving differ from country to country. In this work, normal driving means that the drivers execute the driving tasks under ‘normal’ driving conditions i.e. the absence of any safety-critical events such as ‘near misses’ or ‘collisions’. In addition, this PhD research focuses on identifying acceptable thresholds and developing a statistical relationship between braking and related factors. The examined factors are human factors (i.e. age, gender
1 A Field Operational Test is a large-scale testing experiment in real traffic conditions, whereas a
Naturalistic Driving Study is undertaking using unconstructive observation when driving in a natural setting and without experimental control.
9
and driving miles per year), traffic factors (e.g. traffic density) and road network conditions. In addition, the deceleration profiles will be calculated. Furthermore, the comfort level of the deceleration events is decided using an adequate threshold and the factors affecting the comfort level are examined. Concluding, the last goal is to inform vehicle manufacturers about the results and suggest a way to implement those results into the design of an autonomous car to ensure that passenger presumes the braking operation as safe and comfortable.
1.3 Research importance
Vehicle automation research, including ADAS and AVs, is undertaken extensively nowadays as it seems promising and carries various possible benefits. However, a fundamental challenge is how to make these vehicles safe and trustworthy and persuade people to accept them. Feeling safe and comfortable inside a (semi-) AV is one crucial factor in addressing this challenge. Along with safety and efficiency, the increase in driver comfort is considered one of the main motivations for purchase (Hartwich et al., 2018). In these higher levels of automation, the driver is becoming a passenger, which is termed the loss of controllability (Elbanhawi et al., 2015; Hartwich et al., 2018). Therefore, when the passenger has little or no control of the car movements the autonomous system must generate movements that are perceived as pleasant (Erikson et al. 2015). This could be achieved by estimating the deceleration profiles that are generating from manual driving and then program the control mechanisms of AVs to follow those profiles.
The comfort experience when being a passenger in a human-driven car is affected by the driver’s driving style. Similarly, the same applies to a (semi-) AV (Bellem et al., 2016). Improving the implemented driving style is the key to influence experienced driving comfort inside a semi- or fully AV (Bellem et al., 2018). Generating different deceleration thresholds for different scenarios and different driving characteristics could aid the improvement of the implemented driving style. From a technologic perspective, the automated driving style is possible to mimic average human driving styles or to be constructed as an artificial one. In both cases researchers tried to discover the underlying factors determining a comfortable automated driving style, resulting in the majority in longitudinal and lateral acceleration and deceleration. This
10
PhD research is meaningful because it provides an in-depth analysis of the deceleration events. More specifically, it provides an estimation of deceleration profiles for different scenarios, qualitative results on the relationship of several contributory factors with deceleration values and with the level of comfort during a deceleration event. Braking is one of the most important factors related to discomfort. Without understanding deceleration and contributing influential factors and their cooccurrence, it is at least questionable whether (semi-) AVs will be able to perform braking that causes comparable feelings of comfort as manual braking while driving. Without feeling safe and comfortable inside an AV, humans will not trust and accept a computer to drive for them and this might make the transaction of manual vehicles to (semi-) AVs a more challenging task.
1.4 Aim and Objectives
The aim of this PhD research is to model the deceleration events of drivers under normal driving conditions to guide comfortable braking design.
The aim will be accomplished through the following objectives:
1. To identify factors affecting deceleration behaviour and ride comfort,
2. To describe and validate data collection approaches for analysing deceleration behaviour,
3. To investigate and refine the data to improve the analysis quality, 4. To develop the deceleration profiles,
5. To extract the underlying relationship between influencing factors and both, braking behaviour and comfort level,
6. To recommend for comfortable braking design.
1.5 Thesis outline
This section provides an outline of each chapter of the thesis. The whole thesis consists of eight chapters:
➢ In Chapter 2, an in-depth critical literature review in deceleration behaviour and ride comfort is conducted in order to understand why people may feel
11
uncomfortable during the driving tasks and which factors affect the deceleration behaviour and the comfort of vehicle’s passengers.
➢ Chapter 3 begins with the literature review on the different data collection approaches used in driver behaviour analysis. Also, the data that have been used are illustrated thoroughly in this Chapter. They are demonstrated along with descriptive statistics for a better understanding of the samples
➢ In Chapter 4 the methodology is presented. The chapter starts with the description of the algorithm that detects the deceleration events and estimates the braking profiles. Following are the statistical models that are employed, i.e. the multilevel model and the mixed logit discrete model as well as the classification and clustering methods.
➢
Chapter 5 presents and explains the results of the estimated braking profiles, the clustering, and the statistical models revealing the relationship of the deceleration variables with their influencing factors.➢ The results of the ride comfort evaluation and modelling are displayed and interpreted in Chapter 6.
➢ Chapter 7 discusses the results of this research and provides recommendations for applying them in braking design.
➢
Finally, Chapter 8 summarises the research project, lays out the contribution to knowledge as well as its limitations. Following are suggestions for future research directions.12 The outline of the thesis is shown below:
Figure 1.2: Outline of the thesis
Chapter 1: Introduction Chapter 2: Literature Review of Deceleration Behaviour and Ride
Comfort
Chapter 3: Data description and Pre-processing
Chapter 4: Methodology Chapter 5: Results of the analysis:
Deceleration Events Chapter 6: Results of Comfort
Modelling
Chapter 7: Discussion and Recommendations Chapter 8: Conclusions
13
2 Literature Review of Deceleration Behaviour and Ride
Comfort
The idea behind the conducted research is to increase the naturality of (semi-) AVs and existing braking systems while braking and raise the level of comfort for the passengers. Therefore, the literature review begins with the human factor challenges regarding automation. Narrowing human factors down, the ride comfort problem is revised. Numerous factors contribute to braking behaviour and ride comfort. To fully comprehend the research problem, in-depth knowledge and an understanding of these factors are required. Starting from a more generic perspective to set the conducted research into context, driving behaviour is reviewed, before the braking behaviour is studied.
Purposefully, the literature review consists of three main sections. The aim of each section is briefly presented below:
1. Human factors: This section summarises the human factors regarding automation and specifically AVs along with the challenges that different levels of automation cause.
2. Ride comfort: The second section is dealing with the ride comfort inside a vehicle, which is strongly connected with some challenges related to human factors i.e. acceptance and trust. The term is explained, and the influencing factors are displayed in detail.
3. Driving behaviour: The third section of the literature review defines the driving behaviour and presents different studies that have dealt with the recognition and the implementation of various driving behaviour into AVs. Last but not least, the braking behaviour is described and specifically the appropriate thresholds and the braking behaviour’s influencing factors are presented.
4. Research Gap: The last section describes the research gap, originating from a comprehensive understanding of the research environment.
14
2.1 Human Factors regarding vehicle automation
Much of the literature on automation generally and AVs particularly pays attention to the concept of human factors, making it crucial to study and understand them.
An AV is defined as a passenger car that is capable of driving by itself (Arora et al., 2013; Kaur and Rampersad, 2018). Autonomous means having the power for self-government and involves decision making. On the other hand, automation is the process of following predefined instructions (Elbanhawi et al., 2015). An AV is a vehicle capable of fulfilling the main transportation capabilities of a traditional car, specifically, sense its environment and navigate through a transport network without human input (Campbell et al., 2010; Arora et al., 2013). It is necessary here to clarify exactly what is meant by human factors: This is a scientific discipline concerned with the understanding of interactions among humans and other elements of a system, and the discipline that applies theory, principles, data and methods to design a system in a way that optimizes human well-being and overall system performance (Wogalter et al., 2012).
One of the main goals in studying human factors is to prevent human errors in order to ensure safety since human error is the main reason for collisions in transportation (Shappell and Wiegmann, 2000). Two approaches to the problem of human fallibility exist, i.e. the person and the system. The person approach focuses on the unsafe acts-errors of individuals, (e.g. inattention, carelessness etc.), whereas the system approach concentrates on the conditions under which individuals work and tries to build defences to avert errors or mitigate their effects (Reason, 2000). A similar approach is followed by the Reason latent failure model of human error where the incident can be caused by both ‘active failures’ (caused by system operators) and ‘latent failures’ (result from organization practices) (Majumdar et al., 2004).
There are many human factors (e.g. user’s acceptance, overreliance on the system, HMI) affecting the use of automation. These factors need to be taken into consideration while designing and developing an automation system (Saffarian et al., 2012). Muir and Moray (1996) dealt with the trust in automation resulting in more trust in an automated system that leads to more use but less monitoring. Analysing the
15
effect of trust in automation, Parasuraman and Riley (1997) presented some studies referring to the problems of use, misuse, disuse and abuse automation. In their study, the term ‘use’ meant the voluntary activation or disengagement of automation by a human. They defined ‘misuse’ as overreliance on automation (e.g. use it when they should not fail to monitor it effectively) and ‘disuse’ as the opposite i.e. as underutilisation of automation (e.g. ignoring or turning off automated alarms or safety systems). Finally, they described ‘abuse’ as the inappropriate application of automation by designers or managers and they proposed strategies to overcome those problems. Moreover, the out of the loop problem in automation was highlighted by Endsley and Kiris (1995), leading to loss of manual skills and loss of awareness about the state and the processes of the automated system.
Many studies through the literature support that the research conducted considering human factors in aviation will be a great lesson for exploring the human factors challenges regarding autonomous driving (Lee and See, 2004; Majumdar et al., 2004; Merat and Lee, 2012; Young et al., 2007; Parasuraman and Wickens, 2008; Weyer et al., 2015). To begin with, Lee and See (2004) and Parasuraman and Wickens (2008) focused on the trust in automation, taking examples from aviation, where pilots failed to intervene and take the control when it was crucial (misuse). Lee and See (2004) supported that people are not always willing to trust automation (disuse) and that those behaviours result from the user’s feelings and attitudes, like trust. Whereas Parasuraman and Wickens (2008) analysed trust focusing on reliance and compliance. To guide the design of automated vehicles, Merat and Lee (2012) combined different research regarding driver interaction with automated vehicles acknowledging that the understanding of this interaction is largely based on the findings from aviation and process control research. Weyer et al. (2015) conducted an in-depth analysis of the loss of control phenomenon in smart cars using hypotheses based on the findings from aviation research. Moreover, the design philosophies of hard and soft automation, extracted from the aviation field, are discussed in terms of suitability for road vehicles in the work of Young et al. (2007). Hard automation employs the technology to prevent error (automation can override the user) while soft automation just aids the user in different functions. Last but not least, Majumdar et al. (2004) investigate the causation of the airspace incidents by using the Reason model
16
for human errors (active failures, local factors relating to the task and organisational factors) showing that there are more things than the individual user to be taken into consideration in accident prevention.
In Table 2.1, the most important human factors challenges derived from the literature are displayed, along with their definitions and studies that have dealt with them.
Table 2.1: Human factor challenges regarding Autonomous driving
Human factor challenge
Definition Associated studies
Acceptance A wide concept that can be related to the utility and usefulness of the system from the driver’s point of view, the reliability of the system, and the trust by the driver.
(Martens et al., 2007; Somers and Weeratunga, 2015)
Comfort A state which is achieved by the removal or absence of uneasiness and distress.
(Martens et al., 2007; Kuderer et al., 2015; Lefèvre, et al., 2015a)
Overreliance (Complacency, Overtrust, Misuse)
The situation where the driver trusts the automation too much, without
questioning its performance or monitoring its status and hence fail to detect possible failures.
(Parasuraman and Riley, 1997; Parasuraman et al., 2000; Lee and See, 2004; Parasuraman and Wickens, 2008; Saffarian et al., 2012)
Behaviour adaptation
The unintended changes in the driver’s behaviour due to automation use. For example, the driver’s perceived risk might change resulting in higher speed or shorter headways.
(Farida Saad, 2006; Martens et al., 2007; Saffarian et al., 2012)
Mental workload Even if the aim of the automation is to decrease the driving workload, there is evidence that in unexpected situations the automation can increase the mental workload.
(Parasuraman et al., 2000; Martens et al., 2007; Young et al., 2007; Merat et al., 2012;
Saffarian et al., 2012)
Skill degradation (Loss of skills)
Automation can result in degradation of the driving skills since the driver will use these skills to a minimum time.
(Parasuraman et al., 2000; Martens et al., 2007; Saffarian et al., 2012)
Situational awareness
Situational awareness is referred to as the state of being aware, realizing and understanding the modus of the vehicle,
(Parasuraman et al., 2000; Martens et al., 2007; Young et al., 2007; Merat et al., 2012;
17 the driving environment and the dangerous events.
Trust Trust is a social phycological concept that influences the actual, behavioural
dependence on automation. It can be defined as one’s willingness to place himself/herself in a vulnerable position, regarding a technology.
(Muir and Moray, 1996; Lee and See, 2004; Parasuraman and Wickens, 2008; Kaur and Rampersad, 2018)
Underutilisation (Disuse)
When the driver does not trust the automation even if it is reliable and it does not use it (when for example the driver ignores or turns off the safety alarms).
(Parasuraman and Riley, 1997; Lee and See, 2004; Parasuraman and Wickens, 2008)
Abuse The inappropriate application of automation by designers or managers.
(Parasuraman and Riley, 1997)
Loss-of-control (Out of the loop)
High level of automation may raise the complexity and intransparency of vehicles leading to loss-of-control for the drivers.
(Endsley and Kiris, 1995;
Parasuraman et al., 2000; Weyer et al., 2015)
Carsickness Carsickness is the motion sickness that is the result of the conflict between the visual sensory system and the movement of the human body.
(Diels, 2014; Elbanhawi et al., 2015; Diels and Bos, 2016)
Narrowing it down, there has also been intense research on human factors regarding AVs. The transition from the conventional to the fully autonomous cars will not happen at once but gradually passing through different levels of automation. The US National Highway Transportation Safety Agency (NHTSA, 2016) has defined four levels of automation, 0 through 4 as depicted in Figure 2.1:
No-Automation (Level 0): The driver controls the vehicle’s operations at all times:
brake, steering, throttle, and motive power.
Function-specific Automation (Level 1): Automation at this level involves one or more specific control functions. The vehicle automation assists the driver in some vehicle controls, such as braking in order to enable the driver to gain control or stop faster.
Combined Function Automation (Level 2): This level involves automation of at least two primary control functions designed to work in unison to relieve the driver of control
18
of those functions. A combination of ACC (controls the brake and the throttle) and lane centering (controls the steering) is an example of level two automation.
Limited Self-Driving Automation (Level 3): At this level of automation the vehicle has the full control of all safety-critical functions under certain traffic or environmental conditions and monitor all the time for changes in those conditions which may require transition back to driver control. So, the driver should be ready to take control when is needed, but with sufficiently comfortable transition time. An example of level 3 automation is the Google car.
Full Self-Driving Automation (Level 4): In the last level of automation the vehicle is designed to perform all safety-critical driving functions and monitor roadway conditions for an entire trip. The passenger (not the driver anymore) needs to provide destination or navigation input, but he is not expected to be available to take over the control of the car at any time during the trip.
19
To date, different autonomous operations have been applied to conventional cars, allowing them to perform some functions (Level 1 and Level 2 of automation). Many challenges are related to human factors in every automation level and require a better understanding to ensure the development and the wide acceptance of AVs. Many studies focus on topics of transfer of control, loss of control, HMI design, trust, situational awareness, carsickness and user acceptance (Table 2.1). In the report of Martens et al. (2007), a number of human factors issues are underlined: behavioural adaptation, distraction, skill loss, driver’s acceptance, risk compensation, awareness of technology capabilities and limitations. Saffarian et al. (2012) also highlighted the problems of overreliance, behavioural adaption, skill degradation, reduced situation awareness, transition and driver-vehicle communication and suggested possible solutions, for example, shared control, new training methods, adaptive automation. Through the historical analysis undertaken by Kyriakidis et al. (2015) regarding railway accident caused by human error, it was found that distraction, familiarity, safety culture and workload contributed the most in those accidents. Through the literature, it has been widely supported that partial automation is more challenging than full automation since people have to interact intensively with the semi-AV and give and take control of the car when it is needed and at a specific transition time (Norman, 2014). However, the biggest problem is winning the trust of people to allow a computer to drive a vehicle for them in every level of AVs (Forrest et al., 2007). Inappropriate level of trust might lead to disuse (not enough trust in the automated system) or misuse (more trust in the system than appropriate) (Banks and Stanton, 2016).
Trust is closely connected to the acceptability of new technology. Acceptability is defined as a person’s evaluation of technology without any prior interaction with it (Hartwich et al., 2018). According to Elbanhawi et al. (2015), this shift of the role from driver to passenger produces new-comfort-relevant issues, i.e. motion sickness, the effect of disturbances, naturalness of driving manoeuvres and apparent safety.
One of the main problems in the acceptance of AVs is the loss of control, the transition from being a driver to being a passenger (Elbanhawi et al., 2015; Le Vine et al., 2015a; Bellem et al., 2016; Hartwich et al., 2018). The loss of control problem (i.e. if semi-automation raises the complexity of driving was examined with self-reported statements by Weyer et al. (2015) who concluded that the satisfaction of the drivers
20
was high and they did not experience any severe problem. The problem that was underlined by Banks & Stanton, (2016) is that humans are not good at monitoring a task for a long period and then suddenly taking effective control. This also results in reduced situational awareness. According to Parasuraman et al. (2000), humans tend to be less aware of the driving environment, the state of the system and dangerous situations when another agent (in this case the automated system) is in charge. Parasuraman et al. (2000) proposed a guide to design automation that is based on human-automation interaction and takes into consideration the most important of the human factors’ challenges, i.e. skill degradation, complacency, mental workload and situational awareness. In addition, Merat et al. (2012) concluded that vehicle automation had a negative effect on the driver’s situational awareness because of overreliance on the system, lack of knowledge about the system’s capabilities and reduced monitoring.
Several studies have been conducted to deal with the problem of interaction between the driver and the AV in different automation levels. Beggiato et al., (2015) conducted a study to investigate driver’s information needs at different levels of automation which suggested that partial automation was more exhausting and more difficult for the drivers. In two other studies, Merat and Jamson, (2008) and Merat et al., (2012) compared the effect on the driver's performance in manual and highly automated driving. Their results showed that driver’s response to all critical events was slower in the automated driving condition than in manual driving, which may be due to the reduction of the driver’s situational awareness or to overreliance on the system. All these studies suggested that partial automation is more challenging and demands full attention from the drivers almost as much as in normal driving.
2.2 Ride comfort
As mentioned in the previous section, comfort is one crucial human challenge for vehicle automation. To achieve high user-acceptance and market penetration in the domain of autonomous driving, the design of automated driving functions is crucial and should offer flexibility and adaptability (Griesche et al., 2016). The importance of driving comfort is highlighted by The European Road Transport Advisory Council (2017) next to safety and efficiency (Hartwich et al., 2018). However, there is still a
21
lack of knowledge about how the driver wants to be driven and which manoeuvres are perceived as uncomfortable (Scherer et al., 2015).
Ride comfort is a major challenge in the development and acceptance of AVs (Kraus et al., 2010; Kuderer et al., 2015; Lefèvre, et al., 2015a). Ride comfort is a subjective concept understood as a state achieved by the removal or absence of uneasiness and distress. It is a subjective, pleasant state of relaxation given by confident and apparently safe vehicle operation (Constantin et al., 2014). A global definition including psychological aspects describes comfort as ‘a pleasant state of physiological, psychological and physical harmony between a human being and the environment’ (Hartwich et al., 2018). Although, when considering driver comfort, we must not omit safety precautions. Safety is far more important than comfort under any circumstance (Wu et al., 2009).
Comfort may vary considerably among drivers since human drivers adopt different driving styles based on their personality, age, gender, etc. (Kuderer et al., 2015; Powell and Palacín, 2015). Nevertheless, there have been many attempts in the literature to evaluate it and discover which factors affect it. Some of these factors are noise, temperature, air quality, car seat and motion, i.e. vibrations (Martin and Litwhiler, 2008; Constantin et al., 2014; Elbanhawi et al., 2015). Those form the traditional ergonomics factors (Figure 2.2). Vibration has been widely studied as a comfort measurement. Vibrations can be transmitted through the seat surface, backrest and through the floor and can occur in all 3 axes (longitudinal, lateral and vertical) (Park and Subramaniyam, 2013). There are 4 different standards throughout the world today designed to evaluate ride comfort with respect to human response to vibration. Those standards are the ISO 2631 standard, which is used mainly in Europe, the British Standard BS 6841 used in the United Kingdom, VDI 2057 used in Germany and Austria and the Average Absorbed Power mainly used in the United States of America and their overall purpose is to evaluate the trip as a whole in respect to ride comfort (Els, 2005). In the work of Constantin et al. (2014), most of the traditional ergonomics factor were analysed and the seat, the space inside the car, climate and noise were found to be the most important ergonomic factors affecting the comfort.
22
Traditional ergonomic factors have been investigated a lot, although, with the development of AVs, factors beyond ergonomics such as naturality, disturbances, apparent safety and motion sickness will affect the comfort level (Figure 2.2). Naturality is connected to executing familiar to the passenger maneuverers by mimicking the human driving style. Apparent safety does not refer to the vehicle behaving in a safe manner but to the feeling of the passengers that it actually does. Regarding disturbances, they can result from vertical forces (road disturbances) or horizontal forces (load disturbances). Last but not least, motion sickness is apparent when what the passenger sees and expects does not agree with what the vehicle does (Elbanhawi et al., 2015). Therefore, a single subjective evaluation of ride comfort and investigation of traditional ergonomics factors are no longer considered an acceptable and competitive way to assess the passenger experience (Elbanhawi et al., 2015).
Figure 2.2: Factors influencing ride comfort in autonomous cars
Another approach to addressing comfort is to focus on manoeuvre-based analysis, instead of trip-based, which is the most common. If the AV executes manoeuvres familiar to the passenger, it would undoubtedly contribute to the passengers’ comfort enhancement, since they will not have the feeling of being driven by a robotic operator (Elbanhawi et al., 2015; Bellem et al., 2016, 2017, 2018). This would improve the factor naturality. The most common analysed manoeuvres are deceleration, acceleration and lane changing. As far as the apparent safety is concerned, it can be improved by suitable development of the driver-machine interface, to inform the driver early about the next movements and to reassure the driver that it detects a possible danger.