CONTENTS
7 STEP 7 - IMPLEMENTING THE STRATEGIC PLAN 2
7.1 USER GUIDE TO THIS STEP 2
7.2 KEY MESSAGES OF THIS STEP 4
7.3 MOVING FROM PLANNING TO IMPLEMENTATION 5
7.4 REVISING AND UPDATING THE PLAN 8
7.5 PERFORMANCE MONITORING FOR SOLID WASTE MANAGEMENT
SERVICES 9
7 STEP 7 - IMPLEMENTING THE STRATEGIC PLAN
7.1 USER GUIDE TO THIS STEP
In Step 6 we reviewed the process of developing an Action Plan from the overall
Strategy, the two components of the Strategic Plan for MSWM for your City or
metropolitan area. In this section we go one step further by looking at how to implement your strategic plan.
How to use this step? The guidance in this step is subdivided into three parts.
• Section 7.3 recaps on advice on how to begin
implementation of the Strategic Plan, to ensure the continuity between the planning process itself and implementation.
• Section 7.4 considers the need for regular
revision and updating of the Strategic Plan, as shown by the feedback loop from Step 7 in the figure above.
• Section 7.5 and 7.6 provide detailed guidance on
performance measures and information
management systems, which are both vital parts of monitoring the performance of MSWM systems and therefore the success of implementing the Strategic Plan.
How long will it take to
complete Step 7? Step 7 is an ongoing process and never completedin this sense, as implementation as well as monitoring of MSWM services should be ongoing alongside service delivery for the whole period of
Strategic Plan implementation.
Who should use this
step? •• The MSWM department (or equivalent)Steering Group Members • Working Group Members
• Information System Developer Who should else should
read Step 7 for information?
• Staff in municipal departments supplying data as input to performance measuring
• Anybody interested in service sector performance
7.2 KEY MESSAGES OF THIS STEP
‘Key Messages’
The purpose of strategic planning is not to produce a Strategic Plan that is going to sit on the shelf gathering
dust, but rather to provide a practical plan for speedy implementation.
The true strength of a Strategic MSWM Plan will be
demonstrated by its impact in improving MSWM services at the ground level.
Implementation of the Strategic MSWM Plan must be regularly reviewed. The Action Plan should be updated periodically to reflect tasks completed and new priority actions. Although the Strategic MSWM Plan
provides a framework for action, the four main drivers for change will be investment, service improvement, public participation and sound financial management.
The collection of management information is not an end in itself. Performance indicators must provide signals for action. Data gathering is a costly and time-consuming exercise and should be well targeted. Performance monitoring is a process by which the efficiency
of a service can be monitored and compared with similar services offered elsewhere or at an earlier time. Performance
review needs to be an integral part of any MSWM department’s management procedures.
7.3 MOVING FROM PLANNING TO IMPLEMENTATION
7.3.1 Building Support for the Strategy
Strategic planning is not an end in itself; the exercise would be completely
worthless without implementation in practice. The purpose of strategic planning is not to produce a Strategic Plan that is going to sit on the shelf gathering dust, but rather to provide a practical plan which makes a difference when it is
implemented.
It is thus essential to ensure that there is a seamless transition from the planning process to implementation. Indeed, some of the final steps in planning, such as preparation of the Immediate Action Plan, can equally be viewed as the beginning of implementation. The purpose of this section is thus largely to recap on earlier messages, rather than to provide new guidelines.
Step 5 and Step 6 discussed the importance of approval and budget allocations for implementation of the Strategic
Plan. This is highlighted again here as part of the
implementation process. While the planning team might wish that such approvals could be obtained an short notice, the practical reality of decision making in many countries is that the process can be somewhat open-ended. Therefore, driving this process forward should be seen as one of the necessary, parallel activities to begin implementation of the Strategic Plan.
A related activity, which is particularly important if significant organisational changes and/or
inter-municipal cooperation are being proposed, is to continue the process of building consensus for the strategic planning proposals. Again, driving this process forward is important, and final decisions may take a considerable time to put in place.
In parallel to the various approval and consensus building processes, it is likely that detailed feasibility studies will need to be carried out for priority investment projects identified in the Action Plan. Negotiation and funding of the feasibility studies may itself take time. The end point of a feasibility study may be political approval and
submission for formal appraisal by an External Support Agency (ESA). Development of new systems and facilities cannot happen until political
approvals have been given, the necessary operating budgets have been allocated and all parties have agreed to the necessary organisational and institutional reforms. The feasibility studies can thus provide a useful deadline to some of the other, otherwise potentially open-ended, activities at the beginning of the
implementation process. Obtaining necessary approvals and budgets Building consensus Feasibility studies
As discussed in detail in Step 4E, an essential parallel activity during these early stages of plan
implementation is to set in motion the ongoing public awareness and education programme, both to communicate the Strategic Plan to the general public and mobilise their support and cooperation.
7.3.2 Need for a Champion
It is essential that there should be one or more champions, or leaders, to guide the
Strategic Plan through both the approval process and the initial years of
implementation. In practice, this champion is likely to have been involved throughout the planning process and may well be a key member of the Steering Group.
One of the functions of this champion, as well as driving the process forward, is that of ensuring good communication and coordination between all players involved in implementation. These players will include all of the municipalities involved, the organisations designated with responsibility for MSWM, the ESA(s) where applicable and any consultants who may be involved.
7.3.3 The Immediate Action Plan
All of the activities outlined above take time to complete. Despite best intentions, it is unlikely that all the necessary political approvals and feasibility studies can be completed in less than six months, while somewhere between one and two years probably corresponds better to past experience. It is for this reason, that emphasis has been given earlier in the document to the need for an Immediate
Action Plan, so that the momentum built up during the planning process can be
continued and some definite results can be shown on the ground.
The implementation of the Immediate Action Plan will be held up in the short-term as the practical results from the planning study, and will provide credibility to the authorities as they seek support form other stakeholders, as well as from political decision makers, for the Strategic Plan.
A further useful component of the Action Plan will be pilot projects, aimed at testing some of the proposals for improvement within selected areas of the City, prior to their more widespread implementation. Some of these pilot projects should form part of the Immediate Action Plan.
A Strategic Plan for Chennai, India included a pilot project whereby the recommendations to improve waste storage, primary collection, secondary collection and transfer were to be tested in one of the ten zones within the city, to ensure that they would work under a variety of conditions before possible expansion to the rest of the city. The pilot zone was selected to ensure a cross-section of areas, both in socio-economic terms and in residential/commercial/industrial activities.
Public awareness and education
7.3.4 Capacity Building
The entire strategic planning process has been aimed in part at skills transfer to, and capacity building within, the municipality. It is important that the increased understanding and profile of MSWM be properly reflected in the staffing of MSWM departments and training of personnel.
Implementation of the strategic plan is likely to be a major undertaking for the municipalities. An idealised development cycle for MSWM is presented in Figure
7.1.
Figure 7.1: Idealised Development Cycle for MSWM
As can be seen from Figure 7.1, a key element in the plan is likely to be significant institutional and organisational changes. In many situations, substantial progress in the short-term is likely to require technical assistance to the municipality for capacity building.
The long-term aim is that the new MSWM institutions within the metropolitan area should be staffed by senior local staff with the responsibility, authority, accountability and training to provide a cost effective and efficient MSWM service on a sustainable basis into the future.
It is vital to develop strong local MSWM skills and appropriate levels of staffing. Capacity building and training should be aimed at MSWM departments, the private sector, NGOs/CBOs and research organisations.
Sustainable Levels of Investment
Institutional Development and Service Performance
Improvement Improved
Cost Recovery and Financial Performance
Improved Customer Satisfaction and Public
Where support is provided to the municipality from an ESA, technical assistance should generally provide for advice on key aspects of implementation, including for example procurement, land acquisition, tendering processes and management of private sector contractors, development of waste facilities etc.
7.3.5 Monitoring Implementation
The Action Plan will include a number of milestones and review points. It is important that progress should be reviewed by the key stakeholders at regular intervals, and that necessary amendments and adjustments are made as appropriate.
Continuity with the planning process is desirable, and it was recommended in
Step 1 that the Steering Committee should serve not only for the purposes of the initial strategic planning study but also to oversee implementation of the plan. As implementation proceeds, the frequency of Steering Committee meetings can be reduced, initially to every four months and then perhaps to six-month intervals. The Steering Committee will form a crucial link between the MSWM department and other departments who need to be involved to ensure effective
implementation.
One example of a generic approach to implementation is given in Annex 7.1. This is based on a rather different approach to planning than that used here, and is useful to illustrate the richness of different approaches around the world (this one is from Brazil). 1
7.4 REVISING AND UPDATING THE PLAN
As shown in the overall planning flowchart, strategic planning for MSWM is a
continuing process, with the feedback loop emphasising the need for periodic update. Regular reviews of progress with
implementation of the action plan are necessary to ensure that targets are being met in terms of service delivery, financial performance etc. The Strategic MSWM Plan needs to be flexible and there may be a need in the medium term to adapt to changing circumstances and conditions, such as, for example, changes in the waste stream (eg, through increased affluence), development of new technologies to treat and dispose of waste, or institutional changes.
1CEMPRE (1995). Municipal Waste: Manual of Integrated Management. Original in Portuguese, published by CEMPRE, Sao Paulo. Spanish translation published by ADAN, Venezuela.
A programme of regular review can help to increase the municipality’ s knowledge and understanding of the MSWM system through a process of iterative review, problem diagnosis and development of remedial action programs. It is important to consider when and how often the implementation should be reviewed. This will differ among countries and municipalities, but should be undertaken at regular intervals, bi-annually or annually. The
Information Management System and related performance measures should be used as guidance when and in what direction to update the MSWM plan.
When it becomes clear that significant changes are needed, it may be necessary to repeat the overall planning exercise, starting again with Step 1.
7.5 PERFORMANCE MONITORING FOR SOLID WASTE MANAGEMENT SERVICES
Throughout this Planning Guide the need for collecting and utilising information has been stressed (see Step 2). Large amounts of data are being collected and processed into useable information. But it has to be kept in mind that information
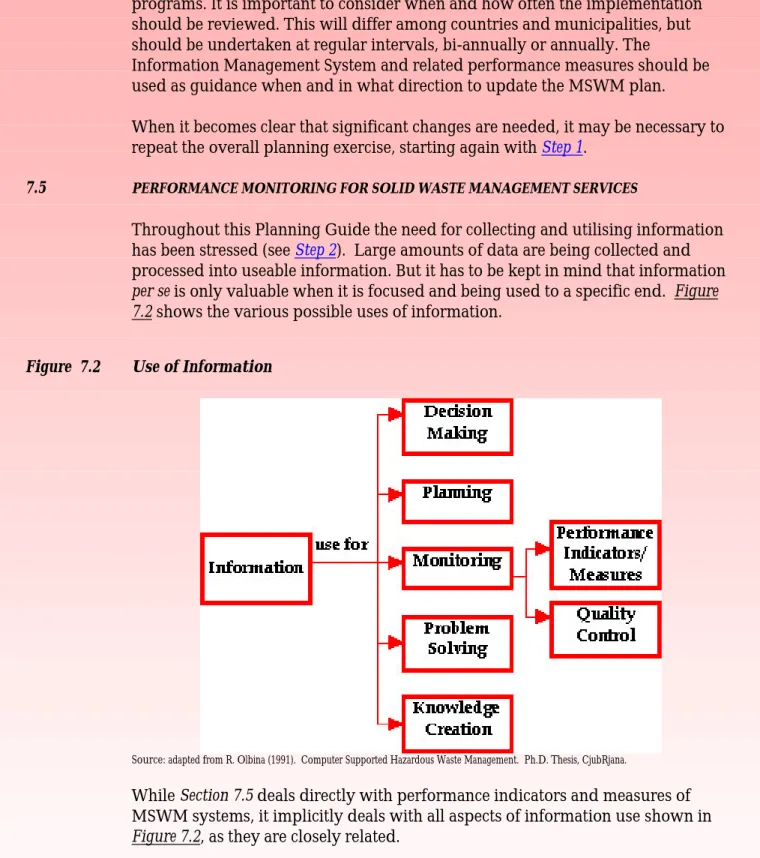
per se is only valuable when it is focused and being used to a specific end. Figure 7.2 shows the various possible uses of information.
Figure 7.2 Use of Information
Source: adapted from R. Olbina (1991). Computer Supported Hazardous Waste Management. Ph.D. Thesis, CjubRjana.
While Section 7.5 deals directly with performance indicators and measures of MSWM systems, it implicitly deals with all aspects of information use shown in
7.5.1 Why Improve Performance Monitoring?
At present, in many cities in low-income countries, the monitoring tools most frequently used to assess performance of the MSWM system are
• Visual observations;
• General feed-back from the work force; or • Customer complaints.
Such observations can lead to inaccurate and unquantifiable results that don’t help the MSW manager to make planning decisions to improve the system. Additionally, the analysis of an unsatisfactory performance of a MSWM function, may, through a more detailed and formal analysis, lead to a very different set of reasons for the sub-optimal functioning of the system.
Lack of funds, for example, are often seen as the undoubted reason for low performance of components of the SWM system in a municipality. A detailed analysis of, say, a collection service, might reveal that performance could be much improved through improved routing, staffing or more effective management, none of which would truly require any substantial increase in funding.
Performance review is a key element in the process of providing good quality, value-for-money services. It is a process by which the efficiency of a service can be monitored and compared with similar services offered elsewhere or at an earlier time. Performance review needs to be an integral part of any SWM department’s management process.
Monitoring the performance of a municipal (or regional, or district) SWM system has a number of goals:
• To observe closely the quality of the SWM service provided in order to maintain or improve service quality;
• To encourage the efficient use of available resources;
• To relate the outputs of a service to inputs (and ultimately their cost);
• To improve service quality overall and relative to cost;
• To enforce accountability of service providers;
• To put downward pressure on cost of service provision;
• To compare and assess services provided against the targets set out in municipal SWM strategy plan;
• To provide information on which management can make policy and management decisions about the service);
• To compare the service provide between two or more sub-municipalities or municipalities in a regional association;
• To compare the quality of service provision in a municipality with a previous month or year; and
• To monitor and evaluate the quality of services provided by private service contractors.
The two central questions of SWM performance monitoring are:
1. How effective is the MSWM service that is being provided? Meaning: To what extent do we satisfy the need for a MSWM service through the system in place and where are requirements for improvement? 2. How efficient is the MSWM service provided?
Meaning: Are we using the available resources in the best possible way and how can we improve their use?
Effectiveness and efficiency are closely related. Increases in efficiency lead in most scenarios to increases in effectiveness, provided resources are not cut simultaneously.
7.5.2 Definitions of Performance Indicators and Measures
In order to determine the performance of a municipal solid waste management system in general, and its individual components in particular, data and information called “performance indicators” and “performance measures” of MSWM are used.
Performance Indicators - are quantitative data related to MSWM services such as:
• number of businesses to be served,
• kilometres of streets to collect from, or
• number of employees in service.
Performance Measures - are the result of processing indicators, by relating them to either time or cost, and are the principle tool for assessing the performance of the system under review. For example:
• cost per tonne disposed;
• number of streets swept per hour etc. In summary,
We need to know whether we use our money, people and equipment in the best possible way to serve the greatest amount of customers at the highest possible standards.
And
We need to know where the weak points in our present system are to enable us to take steps for implementing improvement.
In order to obtain reliable performance measures, the following is needed: • accurate, reliable and regular data collection;
• accurate and reliable cost accounting procedures; • weighing of wastes;
• availability of details on the nature of MSWM service operations;
• units to which the performance indicators can be related (eg, costs per 1000 of population served, costs per household served, time per tonne of waste collected etc.).
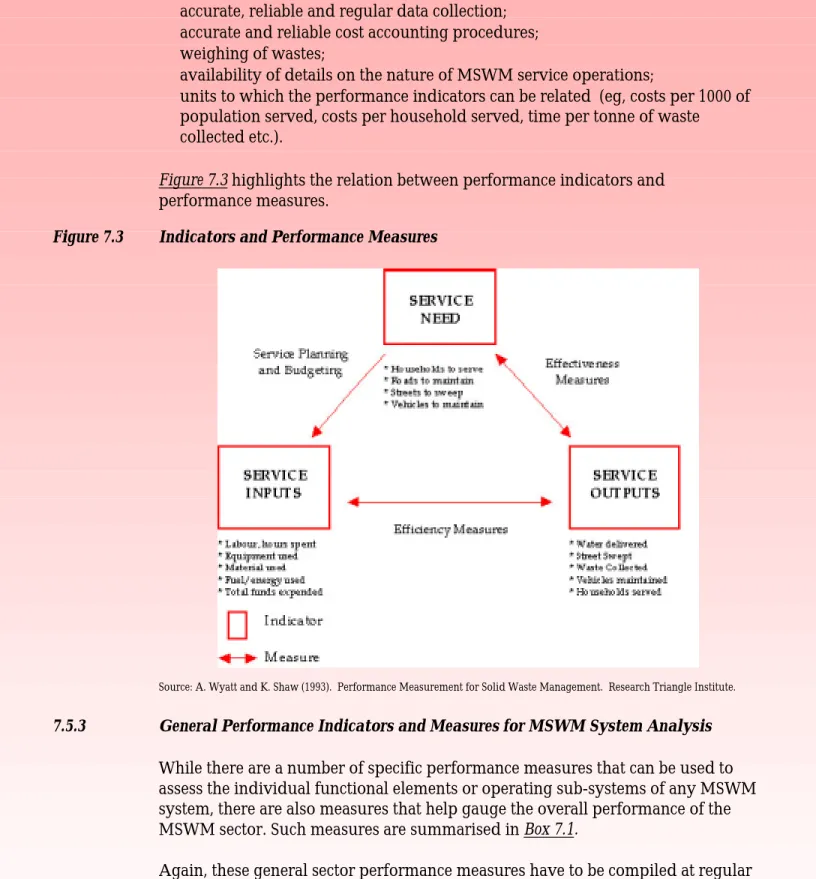
Figure 7.3 highlights the relation between performance indicators and
performance measures.
Figure 7.3 Indicators and Performance Measures
Source: A. Wyatt and K. Shaw (1993). Performance Measurement for Solid Waste Management. Research Triangle Institute.
7.5.3 General Performance Indicators and Measures for MSWM System Analysis
While there are a number of specific performance measures that can be used to assess the individual functional elements or operating sub-systems of any MSWM system, there are also measures that help gauge the overall performance of the MSWM sector. Such measures are summarised in Box 7.1.
Again, these general sector performance measures have to be compiled at regular intervals and then be compared over time to enable planners to monitor and detect positive and negative trends in the sector. If for example the billing index (Billing index (%): Number of commercial premises that receive bills divided by number of premises served multiplied by 100) goes down steadily over time, this
could be the signal for the MSWM department to revisit the existing billing system for commercial/industrial waste and find ways of improving it.
Box 7.1 Summary Overview of Performance Measures Related to MSWM.
Issue Indicator
Health • Morbidity and mortality rates due to illnesses related, directly or indirectly, with solid wastes,
such as, cholera, tetanus, dengue fever, teniasis, hepatitis, etc, by urban and peri-urban zones.
Economy • Number of workers employed in the solid wastes sector.
• Number of large, middle, and small companies involved in urban sanitation (fabrication of mechanical equipment, contracting firms of urban sanitation, recycling industries, consulting agencies, maintenance shops, and others).
• Weight percentage of solid wastes recovered over the total of solid wastes generated. • Increase in the number of tourists relative to the previous year.
Environmental
Conditions •• Weight percentage of MSW collected over MSW generated.Weight percentage of MSW properly disposed over SW collected. Social
Conditions • Percentage of peri-urban population provided with collection services over total peri-urbanpopulation. • Annual increase/ decrease in number of waste pickers in final disposal (past 5 years). • Number of community health education programs.
Solid Wastes
Generation • Per capita production (kg/person/day): Total tonnage of solid wastes collected per day dividedper thousands served.
Recovery • Tonnage of solid wastes recovered per day divided by tonnage of solid wastes generated per day
multiplied by 100. Coverage and
Access to Urban Sanitation Services
• Urban collection: Urban population served divided by total urban population multiplied by 100. • Peri-urban collection: Peri-urban population served divided by total peri-urban population
multiplied by 100.
• Urban composition: Peri-urban population divided by total urban population multiplied by 100. Management,
Operation and Finance:
• Number of employees of sanitation service per thousand persons served. • Rate or tariff of urban sanitation monthly average per home, in US$.
• Payment capacity: minimum monthly rate or tariff of urban sanitation versus income or monthly minimum salary (%).
• Budget of sanitation service versus total municipal budget (%). • Capital investments vs. total budget of urban sanitation service (%).
• Income generation through tariffs and rates versus total cost of the service (%). • Efficiency of collection (%):: Value collected divided by value billed multiplied by 100. • Unit cost of sanitation service (US$/ton): Sum of all direct annual costs, indirect costs, social
benefits, contract payments, financial costs, depreciation and others, divided by tonnage received at site of final disposal per year.
Other Recommended Indicators:
• Coverage of street sweeping (%): length of paved streets swept divided by the total length of paved streets multiplied by 100.
• Efficiency of collection equipment maintenance (%): Total equipment divided by number of equipment in operation + reserve equipment + equipment in maintenance multiplied by 100. • Number of bills paid per month versus total number of bills issued per month multiplied by 100. • Billing index (%): Number of commercial establishments that receive bills divided by number of
7.5.4 Performance Measures Specifically for MSW Collection Services
Examples of performance measures for collection services are shown in Figure 7.3.
Box 7.2 provides a comprehensive listing of the basic data that any municipality
department wanting to measure the performance of its collection service can use, and the recommended frequency of data collection for each specific item.
All of the indicators highlighted can be used to compare performance on a year-by-year basis within the municipality and with other similar municipalities. However, the validity of any of these approaches depends on the availability and accuracy of the authority's information management system, its ability to provide reliable cost and revenue information, and basic data on waste tonnage, or other measures of service provided. Also, comparisons of performance must take into account local geographic or industrial conditions and the standards of service provided. (For an in-depth discussion of all issues relating MSW transport, collection and street sweeping issues, please consult Step 4B of the Planning Guide.)
7.5.5 Performance Measures Specifically for MSW Disposal Services
Disposal operations should also be monitored to ensure that manpower and other resources are efficiently and effectively managed at all sites within the municipal authority's control.
Efficiency is measured by computing unit costs for each operation (for example, cost per tonne). However, as with all performance measures, care must be taken to ensure that comparisons are made on a consistent basis. As with collection, the reliability of all performance measures depends on the quality of the information on which they are based: for example, weighing of wastes is essential.
Comparisons must be made on a consistent basis, taking into account any geographical or other differences between sites.
It must be remembered that in many countries, current disposal costs are negligible due to the prevailing uncontrolled dumping practices. As such, paradoxically, higher operating costs are essential if services are to improve. The measure of effectiveness should be used to balance the strict economic focus of efficiency.
The main performance measures for assessing disposal services are highlighted in
Figure 7.4 below, while Box 7.2 provides a more detailed listing together with
recommendations regarding the frequency of data collection. (For in-depth information on all issues relating to MSW disposal and treatment, consult Step 4C
of the Planning Guide.)
Note: At the centre of data collection for waste disposal operations are weigh scales (weighbridges): Placed at the entrance of a disposal site, and large enough to accommodate vehicles of all sizes coming to the site, they are the only means for reaching an accurate estimate of the quantity of waste entering a disposal or large transfer site.
Box 7.2 Data Collection Requirements for Municipalities to Compile and Report Performance of the Solid Waste Collection Services
Recommended Frequency of Data
Collection Overall Service Provision
1 Tonnage collected - weighed or estimated vehicle loads Daily
2. Population or number of households in area of municipality waste collection responsibility Yearly 3. Population or number of households actually collected from Yearly 4. Frequency of collection services by type, domestic, commercial, clinical etc. Yearly 5. Number of vehicles in municipality fleet by type, size, age, make, registration number Monthly 6. Name of person responsible for solid waste collection service Yearly 7. Management structure and numbers of persons involved in collection service designated:
collection: administration; maintenance Yearly
8. Number of complaints received from public; nature of complaint and action taken Weekly Operational Information
1 Number of collection vehicles operating and total vehicle hours worked Daily 2. Number of persons operating collection service designated: collection administration;
maintenance Daily
3. Vehicle operational records by daily driver worksheet: • identification of vehicle and driver
• vehicle hours working • vehicle mileage covered • vehicle fuel used
• number of vehicle trips to disposal sites • number of operating personnel in vehicle crew
Daily
4 Vehicle operating costs by maintenance log for each vehicle • identification of vehicle
• fuel and oil • tires
• routine servicing
• maintenance and repairs, recording description, cost and time to complete: engine and transmission and brakes, hydraulic systems
chassis and suspension, body work and glass, other
Weekly
Financial Information
1. Vehicle operating costs by vehicle and by fleet Monthly
2. Labor costs; payroll plus overheads, consumables etc. Monthly
3. All other solid waste collection departmental costs Monthly
4. Total costs presented as full cost of the collection operation • per ton of waste collected
• per person/household served
• per number of persons employed in solid waste collection
Yearly
5. Revenues collected from Tax Twice/yr.
6. Revenues collected from commercial and industrial waste producers • as a total sum
• as a revenue per ton collected
Figure 7.4 Main Performance Measures for the MSWM Disposal Service
Box 7.3 Data Collection Requirements for Municipalities to Compile and Report Performance of the SW Disposal Services
Recommended Frequency of Data Collection Overall Service Provision
1. Disposal site locations and type of operation; landfill, incineration, recycling plant etc. Yearly 2. Tonnage received-weighed or estimated vehicle loads and by waste type and by collection
authority: • domestic
• domestic and commercial • commercial only • clinical
• industrial - what type of waste and origin
Daily
3. Vehicles equipment and plant utilized in disposal operations by type, size, age, make,
registration number Monthly
4. Name of person responsible for solid waste collection service Yearly 5. Management structure and numbers of persons involved in disposal service designated Yearly 6. Number of complaints received from public: nature of complaint and action taken Weekly 7. Environmental management at landfill and transfer station sites: pollution incidents,
breaches of license conditions, remediation actions, frequency of environmental monitoring
Weekly
Operational Information
1. Number of vehicles or equipment operating and total vehicle or equipment hours worked Daily 2. Number of persons operating disposal service designated: operational administration
maintenance Daily
3. Vehicle or equipment operational records by daily driver worksheet: • identification of vehicle or equipment and driver
• vehicle or equipment hours working
• vehicle or equipment hours in-operational for maintenance • vehicle or equipment hours in-operational for repair • vehicle or equipment fuel used
Daily
4. Vehicle or equipment operating costs by maintenance log for each vehicle: • identification of vehicle or equipment
• fuel and oil • tires or tracks • routine servicing
maintenance and repairs, recording description, costs and time to complete: engine, transmission, brakes, hydraulic systems, chassis, suspensions, body work, glass, other
Weekly
5. Leachate management installed on site:
• quantity produced per day - estimated or measured • type of treatment or disposal
• costs of operation
Yearly Monthly 6. Cover material used on site:
• how often spread over waste • estimated volume of material used
Yearly
7. Recycling and resource recovery systems and programs in operation • by municipality or private sector
• materials recovered and method of recovery
Yearly
Recommended Frequency of Data Collection Financial Information
1. Plant operation costs for each site Monthly
2. Labor costs: payroll plus overheads, consumables etc. Monthly
3. All other solid waste disposal departmental costs Monthly
4. Total costs presented as full cost of the disposal operation: • per ton of waste received
• per person/household served
• per number of persons employed in solid waste disposal
Yearly
5. Revenues from municipalities using disposal service (proportion of Cleansing Tax) Twice yearly 6. Revenues from receipt of commercial and industrial wastes Monthly
7. Revenues or grants from any other sources Twice yearly
8. Revenues from recycling and resource recovery operations Monthly
9. Transfer and bulk haulage costs if applicable Monthly
10. Capital repayments on loans for solid waste management projects: specify Monthly Source: ERM and TÇT (1996). National Strategy for Waste Management in Turkey. For METAP, the World Bank and the Ministry of the Environment.
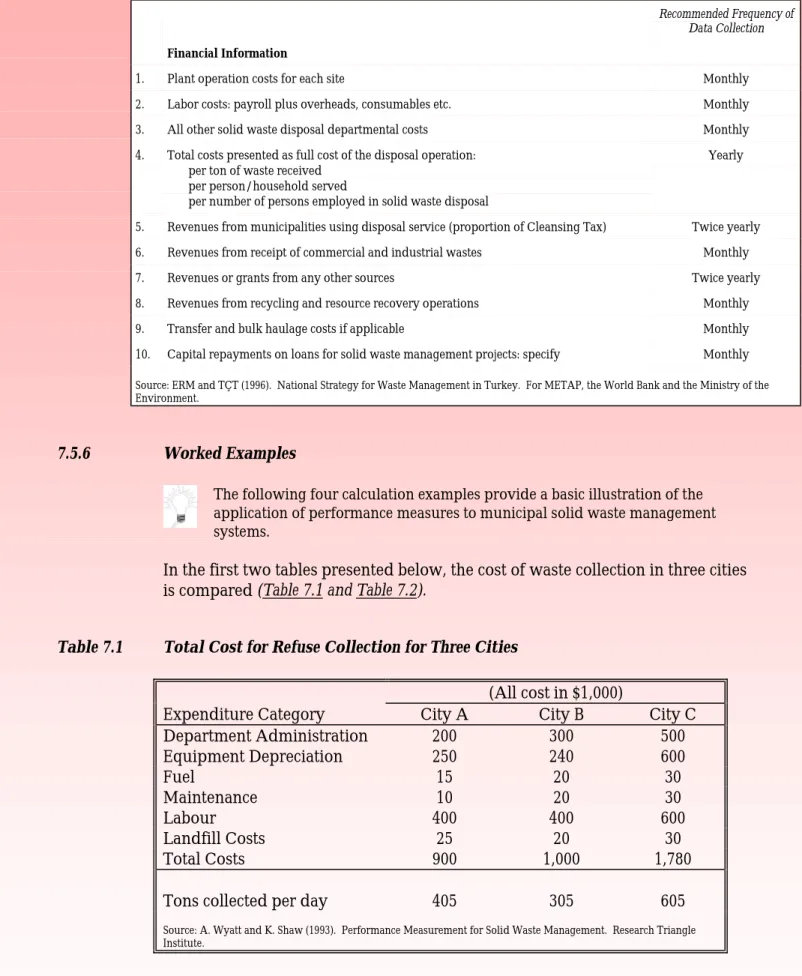
7.5.6 Worked Examples
The following four calculation examples provide a basic illustration of the application of performance measures to municipal solid waste management systems.
In the first two tables presented below, the cost of waste collection in three cities is compared (Table 7.1 and Table 7.2).
Table 7.1 Total Cost for Refuse Collection for Three Cities
(All cost in $1,000)
Expenditure Category City A City B City C
Department Administration 200 300 500 Equipment Depreciation 250 240 600 Fuel 15 20 30 Maintenance 10 20 30 Labour 400 400 600 Landfill Costs 25 20 30 Total Costs 900 1,000 1,780
Tons collected per day 405 305 605
Source: A. Wyatt and K. Shaw (1993). Performance Measurement for Solid Waste Management. Research Triangle Institute.
Table 7.2 Comparison of Refuse Collection Costs for Three Cities
Cost per Ton of Refuse Collected
Expenditure Category City A City B City C
Department Administration 5.00 10.00 8.33 Equipment Depreciation 6.25 8.00 10.00 Fuel 0.38 0.67 0.50 Maintenance 0.25 0.67 0.33 Labour 10.00 7.33 10.00 Landfill Costs 0.63 0.67 0.50 Total 22.50 33.33 29.66
Source: A. Wyatt and K. Shaw (1993). Performance Measurement for Solid Waste Management. Research Triangle Institute.
As can be seen, Table 7.1 is not easy to interpret because it only lists indicators for the collection services, it does not relate the indicators to cost (or any other unit) to make them useable as performance measures. Table 7.2 on the other hand, turns the performance indicators into performance measures by comparing cost per tonne of waste collected.
Now it is possible to compare the cost per each tonne of waste collection in cities A to C, and to conclude reliably that City A has the most cost-effective waste collection system, in that the cost per tonne collected is lowest. The reliability of the result depends directly on the reliability of the data collection system that was used and on the comparability of the data gathering systems used in the three cities.
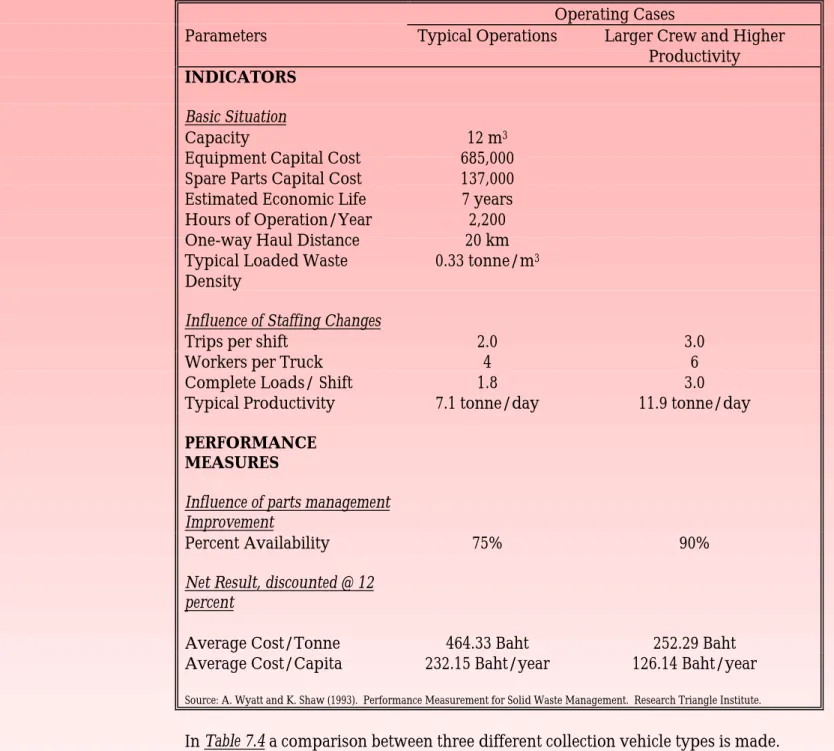
Table 7.3 below, provides an example for a comparison of two different methods
of utilising the same type of waste collection truck. In this example, an increase in the number of crew and an emphasis on improved maintenance was simulated and it showed that the cost per tonne and per capita of waste were drastically reduced.
Table 7.3 Side Loader Non-Compactor Tipping Truck (Bangkok, Costs in Baht)
Operating Cases
Parameters Typical Operations Larger Crew and Higher
Productivity INDICATORS
Basic Situation
Capacity 12 m3
Equipment Capital Cost 685,000
Spare Parts Capital Cost 137,000
Estimated Economic Life 7 years
Hours of Operation/Year 2,200
One-way Haul Distance 20 km
Typical Loaded Waste
Density 0.33 tonne/m
3
Influence of Staffing Changes
Trips per shift 2.0 3.0
Workers per Truck 4 6
Complete Loads/ Shift 1.8 3.0
Typical Productivity 7.1 tonne/day 11.9 tonne/day
PERFORMANCE MEASURES
Influence of parts management Improvement
Percent Availability 75% 90%
Net Result, discounted @ 12 percent
Average Cost/Tonne 464.33 Baht 252.29 Baht
Average Cost/Capita 232.15 Baht/year 126.14 Baht/year
Source: A. Wyatt and K. Shaw (1993). Performance Measurement for Solid Waste Management. Research Triangle Institute.
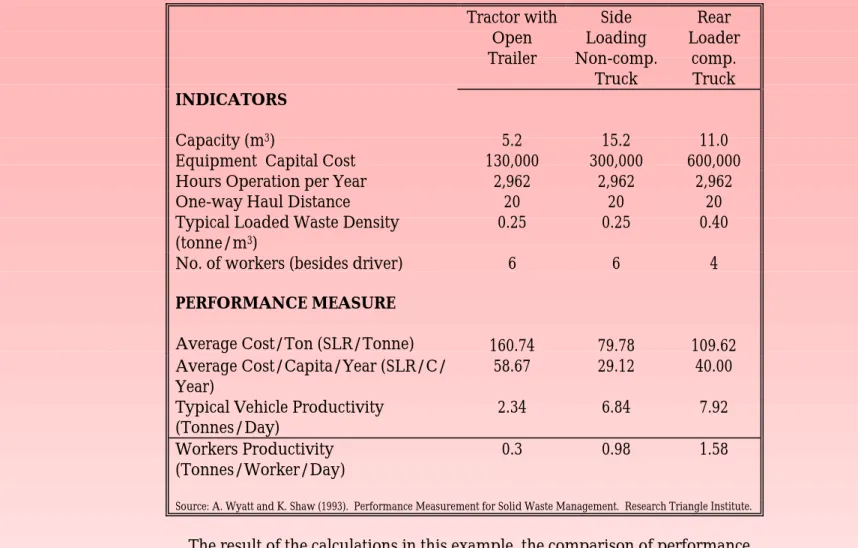
Table 7.4 Comparison of Three Collection Options (Colombo, Costs in SLRs) Tractor with Open Trailer Side Loading Non-comp. Truck Rear Loader comp. Truck INDICATORS Capacity (m3) 5.2 15.2 11.0
Equipment Capital Cost 130,000 300,000 600,000
Hours Operation per Year 2,962 2,962 2,962
One-way Haul Distance 20 20 20
Typical Loaded Waste Density (tonne/m3)
0.25 0.25 0.40
No. of workers (besides driver) 6 6 4
PERFORMANCE MEASURE
Average Cost/Ton (SLR/Tonne) 160.74 79.78 109.62
Average Cost/Capita/Year (SLR/C/ Year)
58.67 29.12 40.00
Typical Vehicle Productivity
(Tonnes/Day) 2.34 6.84 7.92
Workers Productivity (Tonnes/Worker/Day)
0.3 0.98 1.58
Source: A. Wyatt and K. Shaw (1993). Performance Measurement for Solid Waste Management. Research Triangle Institute.
The result of the calculations in this example, the comparison of performance measures for different vehicles, showed that the most expensive and modern rear loader compactor truck would not have been the best choice for Colombo’ s waste collection vehicle fleet. This kind of information is helpful in facilitating the decision making process when, for example, deciding which equipment to purchase, and can give a good basis for discussions with (foreign) salespeople attempting to sell inappropriate high-tech equipment to MSW managers.
7.6 MANAGEMENT INFORMATION SYSTEMS (MIS)
As has been discussed above, in order to improve the performance of a waste management system, the system currently in place has to be assessed and then be continually improved through planning and operational management processes. A significant part of the resource problem confronting local government originates in a lack of attention to costs, quality and accountability. These problems stem, in part, from the inefficient use of existing resources, and used more efficiently, the same resources could provide better and more comprehensive services. With more, or better used,
The collection of management information is not an end in itself. Performance indicators must provide signals for action. Data gathering is a costly and time consuming exercise and if the following basic points are not considered in detail before the data gathering begins, it is possible to end up with large amounts of data, that are either unnecessary or can not be interpreted.
As a first step to building an MIS the performance measures need to be determined. The importance of structured process in this matter cannot be overemphasised. Staff along all the organisational lines of the MSWM department should be consulted regarding their priority data needs, and an overall MIS plan be developed.
Collecting data is a direct extension of the data collection activities undertaken in
Step 2. But while the data for Step 2 were collected in a one-off exercise and
subsequently used to come to a conclusion regarding the magnitude of the problem at hand and to establish baseline information, collection of performance evaluation data is an ongoing iterative process, where new data will regularly be fed into the system and compared to old ones.
Next, an appropriate format and method to gather data has to be chosen, and the frequency of data collection determined. Data collection frequency varies
depending on the different type of data to be collected, but the main feature is that collection has to be regular. In Box 7.2 and Box 7.3 above, the suggested
2WHO-PEPAS (1992). Information Management for Municipal Solid Waste Management Services. World Health Organisation,
Western Pacific Region.
L.F. Diaz, G.M. Savage, L.L. Eggerth and C.G. Golueke (1996). Solid Waste Management in Economically Developing Countries. International Solid Waste Association, Copenhagen. ISBN 87-90402-01-04.
A Management Information System (MIS) is defined2, as
a system in which information is collected, stored, organised, processed, utilised and disseminated.
A MIS is an ongoing process, requiring a regular stream of data to be collected and fed into it. It also requires a medium for storage and processing data.
Benefits of a MIS include:
• Though the provision of accurate, relevant, comparable and up-to-date management information, resources can be costed and matched against outputs delivered;
• Annual budget proposals can be made on the basis of actual needs, taking account of changes in service characteristics, costs and revenues;
• Overall revenue requirements can be better established and politically and socially acceptable charging schemes be devised;
• Revenue collections can be improve through better mobilisation of resources;
• Financial performance can be monitored against objectives;
• Investment planning and decision making procedures can be improved; and
• Information about the total cost and cost effectiveness of service provision give the MSWM department a basis to judge performance on a comparative basis against specified criteria, and give a guide to future investment requirements.
frequency of data collection for MSW collection and disposal services was given for each performance measure. Annex 7.2 provides a set of recommended data recording sheets.
How the data are collected exactly depends on the structure of the MSWM services in each city. The larger the city, the more likely is the involvement of several different departments in MSWM service provision. It is therefore important that all data collected in varying places of the municipality are
compiled in one central place and by employees exclusively in charge of the MIS. Care must be had to ensure that each of the departments involved in MSWM reports back to this central point of coordination. Equally, if parts of the MSWM services are provided by private entities, they have to also be required to report to this central data management point.
Other required data, such as socio-economic data, need to be gathered by
drawing on the resources available in other government units like the Statistics or Housing Departments, and be updated at regular intervals. Again, the accuracy of the data collection is of crucial importance to ensure that a basis for meaningful planning and decision-making is prepared.
For large municipalities the use of personal computers is recommended over manual filing and cataloguing of data because of the volume of information that will have to be stored and processed. Specialised database software should be used for this task, and sufficient persons employed that are in charge of entering data and servicing the database.
At the onset designers should be hired to develop an appropriate and locally adapted system that processes the entered data (or indicators) in such a way that they become meaningful and useful performance measures of the local MSWM services. The system should generate easy to read, appropriate and
comprehensible reports for the different reader and user groups. The system developer should be briefed well on priority data needs of the MSWM department.
There are different reports needed that summarise the result of performance measuring. For general planning purposes, and as a basis for updates of the MSWM plan, annual or bi-annual summary reports will be sufficient. At the other end of the scale, routine management reports will be needed for upper level MSWM managers on a weekly or monthly basis, while operational managers will need daily indication of the progress of general operations.
The cost of an MIS varies with the sophistication of the system put in place. The initial investment consists of the cost of the computer hardware, the system design, the software and installation of the system. Operating cost Data storage and processing
Reporting