ASSOCIATION RULE MINING VISUALIZATION: LEARNING ASSOCIATION RULE MINING MADE EASY
A Project
Presented to the faculty of the Department of Computer Science California State University, Sacramento
Submitted in partial satisfaction of the requirements for the degree of
MASTER OF SCIENCE
in
Computer Science
by
Bindu Madhavi K Khambam
SPRING 2015
ii © 2015
Bindu Madhavi K Khambam ALL RIGHTS RESERVED
iii
ASSOCIATION RULE MINING VISUALIZATION: LEARNING ASSOCIATION RULE MINING MADE EASY
A Project
by
Bindu Madhavi K Khambam
Approved by: __________________________________, Committee Chair Dr. Meiliu Lu __________________________________, Second Reader Dr. Doan Nguyen ____________________________ Date
iv Student: Bindu Madhavi K Khambam
I certify that this student has met the requirements for format contained in the University format manual, and that this project is suitable for shelving in the Library and credit is to be awarded for the project.
__________________________, Graduate Coordinator ___________________
Dr. Jinsong Ouyang Date
v Abstract
of
ASSOCIATION RULE MINING VISUALIZATION: LEARNING ASSOCIATION RULE MINING MADE EASY
by
Bindu Madhavi K Khambam
Association rule mining algorithms are the fundamentals for a data mining course. Association rule mining helps to extract useful information from the data for various applications such as market analysis. Association rules are used for finding frequent items set, associations, correlations, or causal structures among sets of items or object.
Generally, the students find it difficult to understand these key concepts because it requires abstract thinking. In addition, conveying a clear explanation of how these processes work is a bit of a challenge for the instructors too. Since the best way to understand complex algorithms is to see them in action, it would be very helpful if a visualization tool of these algorithms were available to the students to play with. Hence, the drive to come up with a data mining visualization tool that can animate a few of the most widely used and complex data mining algorithms.
The objective of the project is to provide an association rule-mining tutorial and make the students understand the basic underlying concepts. Additionally the tutorial provides
vi
visualization tool of these algorithms, which will help the students to understand the complex algorithms better and they will be able to test them.
This project is intended to create an exploration environment, in which students can learn through experimentation. It is targeted at the students wanting to practice algorithms that are being covered in class, as well as instructors wishing to embellish their lectures with an animated interface to help the students. An understanding of the underlying mechanics of algorithms is of great importance to students who are taking data mining courses.
_______________________, Committee Chair Dr. Meiliu Lu
_______________________ Date
vii DEDICATION
To my loving parents (Haima Khambam & Koteshwarrao Khambam), brother (Nikhil Khambam), parents-in-law (Padma Renangi & Mohan Rao Renangi) and husband
viii
ACKNOWLEDGEMENTS
I am forever grateful to my advisor, Dr. Meiliu Lu for her constant support, advice and patience. She was always there for me, ready to help no matter how busy she was. I cannot thank her enough for her valuable advice and insights that inspired this work. It has been always great pleasure working with her and I am truly fortunate to have her as my advisor. I hope I can make her proud, throughout my future endeavors.
I am very thankful to Dr. Doan Nguyen for accepting to serve as my committee member and spending his valuable time reviewing this work. The work described in this report would not have been possible without the help of my dear friends. I would like to take this opportunity to thank all our group members and will always remember the long talks to stimulate ideas.
I would like to thank God, the almighty for everything. Last, but not the least, I would like to thank my family for their unconditional love and sacrifice throughout my life and a special thanks to my in-laws and husband for being there, encouraging and supporting me all through. My complete family has truly been a blessing and I thank them for their many prayers and support throughout my entire life.
ix TABLE OF CONTENTS Page Dedication ... vii Acknowledgements ... viii List of Tables ... xi
List of Figures ... xii
Chapter 1. INTRODUCTION ...1
2. BACKGROUND ...4
2.1. Emergence of knowledge discovery in databases (KDD) ...4
2.2. Basics of data mining ...5
2.3. Introduction of association rule learning ...6
3. APRIORI ALGORITHM...8
3.1. Basics of apriori algorithm ...10
3.2. Algorithm flow in detail ...10
3.3. Illustration ...12
4. FP ALGORITHM ...16
4.1. Basics of FP growth algorithm ...18
4.2. Algorithm flow in detail ...19
4.3. Illustration ...21
x
5.1 Apriori algorithm – Feed and visualization trace ...28
5.2 FP growth algorithm – Feed and visualization trace ...32
6. CONCLUSIONS...36
xi
LIST OF TABLES
Tables Page
Table 3.1 Apriori algorithm transaction list ...12
Table 3.2 Apriori algorithm 1-item support calculations...13
Table 3.3 Apriori algorithm minimum support threshold checks ...13
Table 3.4 Apriori algorithm 2-item set support calculations ...14
Table 3.5 Apriori algorithm 2-item set minimum support threshold check ...14
Table 3.6 Apriori algorithm association rule generation ...15
Table 4.1 FP growth transaction list ...21
Table 4.2 FP growth algorithm 1-item set support calculations ...21
Table 4.3 FP growth algorithm 1- item set minimum support threshold check ...22
Table 4.4 F-List ...22
Table 4.5 FPDP table ...22
xii
LIST OF FIGURES
Figures Page
Figure 2.1 Hierarchy of association rule mining algorithms ... 5
Figure 3.1 Apriori algorithm basics @ courseware – 1 ... 8
Figure 3.2 Apriori algorithm basics @ courseware – 2 ... 9
Figure 3.3 Apriori algorithm basics @ courseware – 3 ... 9
Figure 3.4 Apriori algorithm flow diagram ...11
Figure 4.1 FP growth algorithm basics @ courseware – 1 ...16
Figure 4.2 FP growth algorithm basics @ courseware – 2 ...17
Figure 4.3 FP growth algorithm basics @ courseware – 3 ...18
Figure 4.4 FP growth algorithm flow diagram ...20
Figure 4.5 Transaction#1 ...23
Figure 4.6 Transaction#2 ...23
Figure 4.7 Transaction#3 ...23
Figure 4.8 FP - tree ...24
Figure 5.1 Association rule mining visualization @ courseware ...26
Figure 5.2 Apriori algorithm – user feed screen (Pre) ...29
Figure 5.3 Apriori algorithm – user feed screen (Post) ...29
Figure 5.4 Apriori algorithm – transaction matrix feed (Pre) ...30
Figure 5.5 Apriori algorithm – transaction matrix feed (Post) ...30
xiii
Figure 5.7 FP growth algorithm – user feed screen (Pre) ...32
Figure 5.8 FP growth algorithm – user feed screen (Post) ...32
Figure 5.9 FP growth algorithm – transaction matrix feed (Pre) ...33
Figure 5.10 FP growth algorithm – transaction matrix feed (Post) ...33
Figure 5.11 FP growth algorithm – flow visualization ...34
1
Chapter 1 INTRODUCTION
With tremendous advancement in the field of technology and computing, data gathering has become big. With the scale of data available for analysis, there is a critical need for new computing theories to evolve and help with knowledge discovery. Human ability to process gigantic data sets is far from practical which drove the need for new tools to be developed. The traditional approach of knowledge discovery is a laborious process, which happens to be extremely slow, bug prone and impractical when the data set becomes huge [1]. This drove the need for automating the algorithms and creating tools for knowledge extraction such as data mining.
Data mining is defined as “the process of analyzing data from different perspectives and summarizing it into useful information which finds correlations or patterns among loads of fields in a large relational database” [1]. There has been a lot of research in the field of data mining and some of the most widely used techniques includes association rule mining. The association rule mining is claimed to be the most familiar and though a little complex, an extremely powerful technique. It finds numerous applications such as medical diagnosis, census data, customer relation management and most importantly, market based analysis [2]. Here, we focus on two of the most popular association algorithms in detail.
In this work, we introduce an exploration environment, in which students can learn through experimentation. It is intended for use by the students wanting to practice algorithms being covered in class, as well as instructors wishing to embellish their lectures
2 with an animated interface to help the students. Generally, the students find it difficult to understand these key concepts because it requires abstract thinking. In addition, conveying a clear explanation of how these processes work is a bit of a challenge for the instructors too. Since the best way to understand complex algorithms is to see them in action. An understanding of the underlying mechanics of algorithms is of great importance to students who are taking data mining courses. This project will also provide a firm platform for extracting knowledge from a small data set. Generally, the students find it difficult to understand these key concepts because it requires abstract thinking. The objective of the project is to provide Association Rule Mining tutorial and make the students understand the basic concepts of association rule mining. Additionally the tutorial provides visualization tool of these algorithms, which will help the students to understand the complex concepts better and they will be able to test their level of understanding.
This report is organized as follows:
Chapter 2 presents a brief summary of the concepts of knowledge discovery in databases, data mining and association rule mining.
Chapter 3 provides a detailed theoretical explanation of Apriori algorithm with real time examples also talking about the integration of the algorithm into the courseware website.
Chapter 4 provides a detailed theoretical explanation of the FP growth algorithm with some real time examples coupled with talking about the integration of the algorithm into the courseware website.
3 Chapter 5 gives a step-by-step process to execute the algorithms in the courseware
website to be able to visualize and better understand the functionality. Chapter 6 concludes the report with suggested future work.
4 Chapter 2
BACKGROUND
In this chapter, we will briefly discuss the background information related to this work. We will begin with the evolution of knowledge discovery of databases (KDD), touching upon the basics of data mining and introducing association rule learning. Subsequently, we will be dealing with some of the most powerful algorithms in depth in this area.
2.1.Emergence of knowledge discovery in databases (KDD)
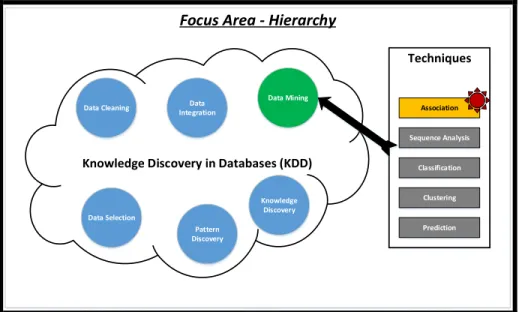
KDD is referred to as the overall process of filtering out useful information and knowledge from data. It constitutes evaluation and interpretation of patterns to make decisions of what accounts to as knowledge [1]. It finds applications in the fields of machine learning, pattern recognitions and such. Knowledge discovery of databases is a multi-level process as shown in figure 2.1, which includes [1]:
o Data cleaning o Data integration
o Data selection and transformation o Data mining
o Pattern discovery o Knowledge discovery
The legacy methods of knowledge discovery was slow and inefficient when the data sets become bigger [3]. This drove the need for automating with algorithms and
5 creating tools for knowledge extraction. The next subsection introduces the concept of data mining.
Focus Area - Hierarchy
Knowledge Discovery in Databases (KDD) Data Mining Data Integration Data Cleaning Data Selection Pattern Discovery Knowledge Discovery Techniques Association Sequence Analysis Classification Clustering Prediction
Figure 2.1. Hierarchy of association rule mining algorithms
2.2.Basics of data mining
As discussed in the previous section, data mining plays a vital role. It is defined as “the process of analyzing data from different perspectives and summarizing it into useful information which finds correlations or patterns among loads of fields in a large relational database” [4]. There has been a lot of research in the field of data mining and some of the most widely used techniques include [4]:
o Association - “In association, a pattern is discovered based on a relationship between items in the same transaction” [5].
o Sequence analysis – “Sequential patterns analysis is used to discover or identify similar events or trends in transaction data” [5].
6 o Classification – “Classification is used to classify each item in a set of data
into one of predefined set of classes or groups” [5].
o Clustering – “Clustering is a data mining technique that makes meaningful or useful cluster of objects which have similar characteristics” [5].
o Prediction – “It is used to predict missing or unavailable numerical data values rather than class labels” [5].
The above-mentioned techniques help estimate upcoming trends allowing humans to plan and be more proactive and make certain smart knowledge driven decisions. Now that we have briefly looked at some of the techniques, as shown in figure 2.1, we would like to delve further into one of the most powerful techniques – “Association”.
2.3.Introduction of association rule learning
The association rule mining is claimed to be the most familiar and though a little complex, an extremely powerful technique. It finds numerous applications and especially marketing sees huge benefits in adopting the idea. Key here is to associate or make a simple correlation between two or more items to identify patterns.
“Association rule mining is to find the rules that satisfy a predefined minimum support and confidence from a given database” [6].
o Support The rule X=>Y holds with support S if S% of the transaction in D contains X U Y. Rules that have “S” greater than a user specified support is said to have minimum support.
7 o Confidence The rule X=>Y holds with confidence C if in C% of the transactions in database D that contain X also contain Y rules that have a C greater than a user specified confidence is said to have minimum confidence. o Frequent Item set Whose support is greater than user specified minimum
threshold
Association rule mining constitutes of solving two issues; finding all the frequent item sets and generating rules derived from frequent item sets. Though there are several algorithms, which solve this problem [7], we will talk about two such algorithms in the upcoming chapters, namely
o Apriori Algorithm o FP Algorithm
8 Chapter 3
APRIORI ALGORITHM
Apriori is an algorithm for frequent item set mining and association rule learning over databases [6]. The Apriori algorithm happens to be one of the most classical algorithms to understand the concepts beneath the association rules generally dealing with marketing data – such as what products tend to be purchased together in a market place [8].
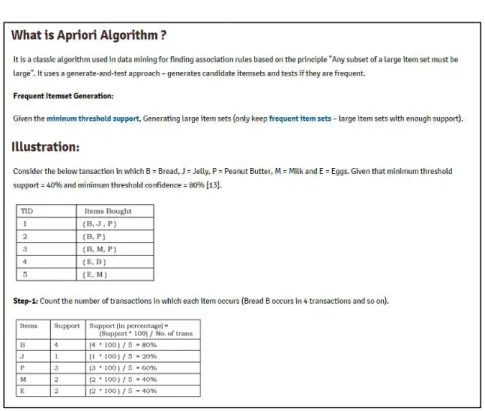
To enhance the learning experience of such a complex algorithm, the courseware has been developed to help. As shown in figures 3.1 - 3.3, not only does the courseware have detailed information of the algorithm, but also have some real life examples to relate and understand the concepts better. The information available in the courseware has been dealt in detail in this chapter.
9
Figure 3.2. Apriori algorithm basics @ courseware - 2
10 3.1.Basics of apriori algorithm
Apriori is noted as one of the standard algorithms used in data mining for determining correlation following the basic principle “Any subset of a large item set must be large” [9]. It is defined as a “generate and test approach” [9], wherein we generate candidate item sets and perform testing if the set happens to be frequent. The underlying principle of the algorithm is that it proceeds by identifying the frequent individual items in the database and associatively extending them to larger item sets until the combination occurs often enough to be considered a pattern or a rule.
As introduced in chapter 2, any association rule constitutes of two key things, o Frequent item set generation
o Rule generation
Apriori uses a bottom up approach [6], where the frequent item sets are extended recursively adding one item at a time and the resultant set is tested against the database. The next subsection deals with the algorithm flow followed by a simple illustration to help understand the concept better.
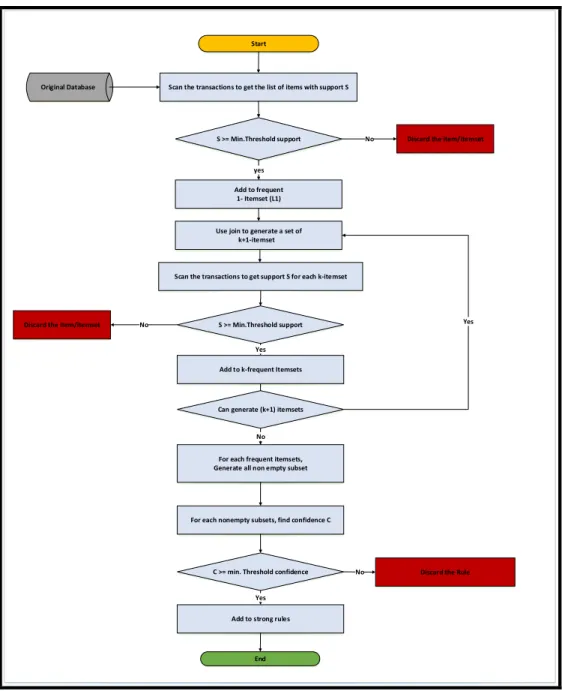
3.2.Algorithm flow in detail
Figure 3.4 depicts the flow diagram of the Apriori algorithm. As shown, the algorithm triggers with scanning all the transactions to get a list of items with support S. As long as the computed support is greater than the user defined minimum threshold support, the item set is taken forward. If it does not meet the minimum requirements, it gets dropped out of contention.
11 Once the item set passes the threshold checks, it gets added to the frequent single item sets. Subsequently a join operation is performed to generate a (k+1) element item set. The threshold checks are performed again on the (k) element item sets and passing it would enable generating a (k) element frequent item set.
Original Database
Start
Scan the transactions to get the list of items with support S
S >= Min.Threshold support
yes Add to frequent
1- Itemset (L1)
No Discard the item/itemset
Use join to generate a set of k+1-itemset
Scan the transactions to get support S for each k-itemset
S >= Min.Threshold support Yes Yes
Add to k-frequent Itemsets
For each frequent itemsets, Generate all non empty subset
For each nonempty subsets, find confidence C
C >= min. Threshold confidence Yes Add to strong rules
No Discard the Rule
End No No
Discard the item/itemset
Can generate (k+1) itemsets
12 Post this step, if we can generate a (k+1) item set, we do a recursion on the above-mentioned process. However, if we reach a saturation on the item sets, for each frequent item sets gathered so far a complete list of non-empty subsets is generated. For each of these subsets, the confidence C is calculated and ran through a minimum threshold check. Passing this minimum requirement makes it a strong rule, else is discarded.
The complete flow is pictorially shown in figure 3.4. In the next subsections, we will take up an illustration of the algorithm, which also finds place in the developed courseware website for enhanced student learning.
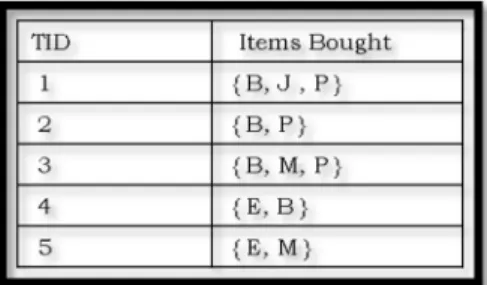
3.3.Illustration Problem Statement
Consider the below transaction in which we follow the following notation B = Bread, J = Jelly, P = Peanut Butter, M = Milk and E = Eggs
Minimum threshold support = 40%
In the tables 3.1 - 3.6 shown below, the transaction ID are termed as TID i.e. item/item set is frequently bought if it is bought at least 40% of times.
Minimum threshold confidence = 80%.
13
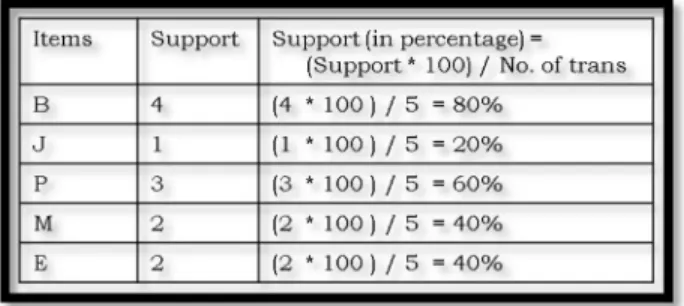
As shown in table 3.2, we first
Step # 1: Count the number of transactions in which each item occurs like Bread B occurs in 4 transactions [10].
Table 3.2. Apriori algorithm 1-item support calculations
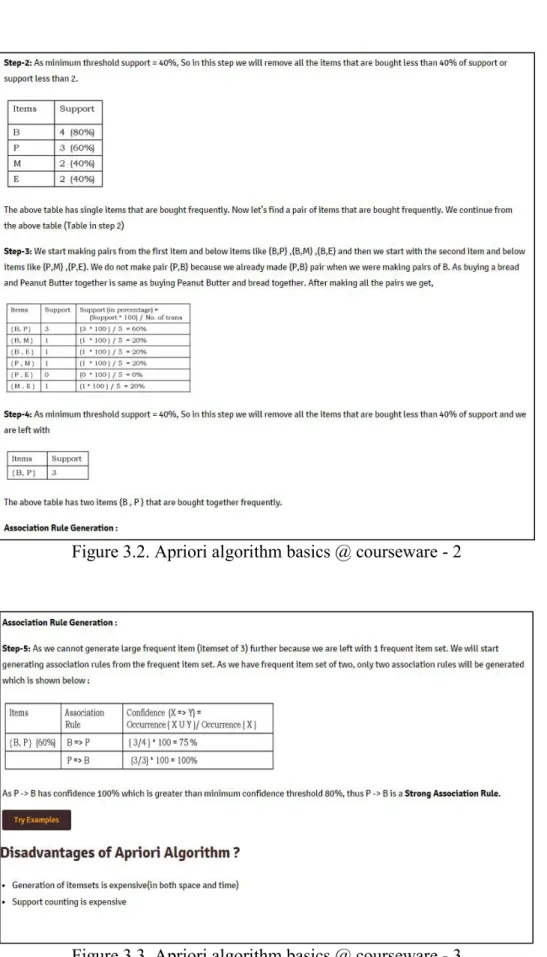
Step # 2: Minimum threshold checks
As the minimum threshold support = 40% so, in this step we will remove all the items that are bought for less than 40% of support [10].
Table 3.3. Apriori algorithm minimum support threshold checks
Table 3.3 has single items that are bought frequently. Now we try and pair items that are bought frequently.
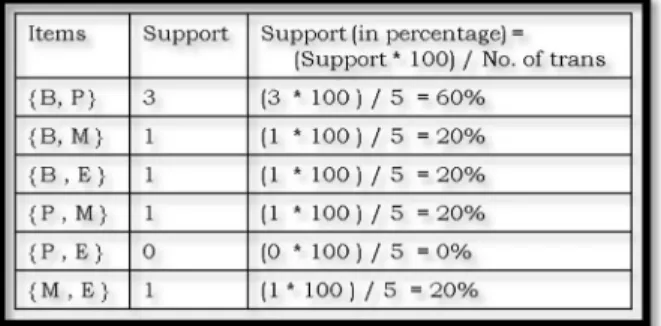
14 We start making pairs from the first item and below items like {B,P} ,{B,M} ,{B,E} and then we start with the second item and below items like {P,M} ,{P,E}. We do not make pair {P,B} because we already made {P,B} pair when we were making pairs of B. As buying a bread and peanut butter together is same as buying peanut butter and bread together [10]. After making all the pairs we get items set as shown in table 3.4,
Table 3.4. Apriori algorithm 2-item set support calculations
Step # 4: Minimum threshold checks
As minimum threshold support = 40% so, in this step we will remove all the items that are bought for less than 40% of support.
Table 3.5. Apriori algorithm 2-item set minimum support threshold check
Table 3.5 has two items that are bought frequently.
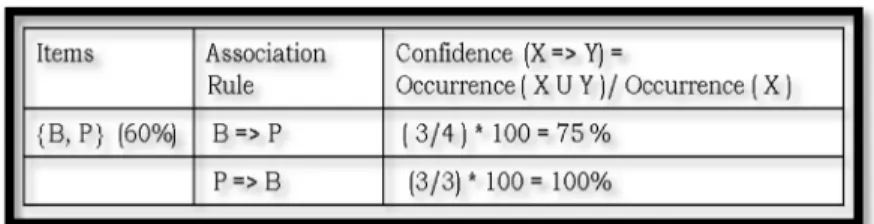
15 As we cannot generate larger frequent item (item set of 3) further because we are left with one frequent item set. We now will start generating association rules from the frequent item set. As we have frequent item of two, only two association rules will be generated which is shown in table 3.6.
Table 3.6. Apriori algorithm association rule generation
As PB has confidence 100%, which is greater than minimum confidence threshold of 80%, PB is a strong association rule.
Apriori algorithm as discussed is a robust technique but comes with an expense. The generation of candidate item sets is highly expensive in both space and time and also support counting becomes heavy on resources which initiates the idea of another powerful algorithm, namely the FP algorithm which is dealt in length in the next chapter.
16 Chapter 4
FP ALGORITHM
As discussed in the previous chapter, the apriori algorithm enables us to determine frequent item set patterns for a database but there is a lot of compute involved and becomes expensive. FP growth algorithm tries to address and solve this problem for us.
To enhance the learning experience of such a complex algorithm, the courseware was developed to help. As shown in figures 4.1 – 4.3, information about FP growth algorithm has been dealt in detail in the courseware.
17
18
Figure 4.3. FP growth algorithm basics @ courseware - 3
4.1.Basics of FP growth algorithm
The FP growth algorithm is an extremely efficient and scalable data mining methodology to help determine the complete set of frequent patterns by “pattern fragment growth, using an extended prefix-tree structure for storing compressed and
19 critical information about frequent patterns named frequent pattern tree” [11]. The algorithm unlike the Apriori algorithm, allows frequent item set discovery without all the candidate item set generation, which brings down the extensive compute cycles. The next sub section deals with the algorithm flow for the FP growth algorithm.
4.2.Algorithm flow in detail
FP growth algorithm as shown in figure 4.4 starts with scanning the database and finding a single item pattern – which is traditionally called a 1-item set and calculate the support S for each of those. These patterns are then run through minimum support threshold checks, out of which some go further and the ones, which do not meet the requirement, are dropped. The frequent 1-item sets that satisfy the minimum threshold constraint are used to create the frequent list (F-list) which sorts all the frequent items in the descending order of support S. Once the F-list is created, the frequent items in the transactions are sorted based on the F-list – also called as FPDP. This enables the construction of the FP tree and subsequently the conditional FP tree. With all the information gathered until this point, the frequent item set is generated which would terminate the algorithm.
20
Start
Scan database and find frequent 1-item set with support ‘S’ (Single item pattern)
S >= Minimum threshold support Discard the element
Create the F-list
(Frequent items sorted in descending order of ‘S’)
Sort frequent items in the transactions based on F-list (FPDP)
Construct the FP tree
Construct the conditional FP tree
Generate the frequent item set
End
No
Y
es
21 4.3.Illustration
Problem Statement
Consider the transaction shown in table 4.1 in which
B = Bread, J = Jelly, P = Peanut Butter, M = Milk and E = Eggs.
Minimum threshold support = 40% i.e. item/item set is frequently bought if it is bought at least 40% of times.
Minimum threshold confidence = 80%
Table 4.1. FP growth transaction list
Step # 1: Scan DB once; find frequent 1-itemset (single item pattern) as shown in table 4.2
Table 4.2. FP growth algorithm 1-item set support calculations
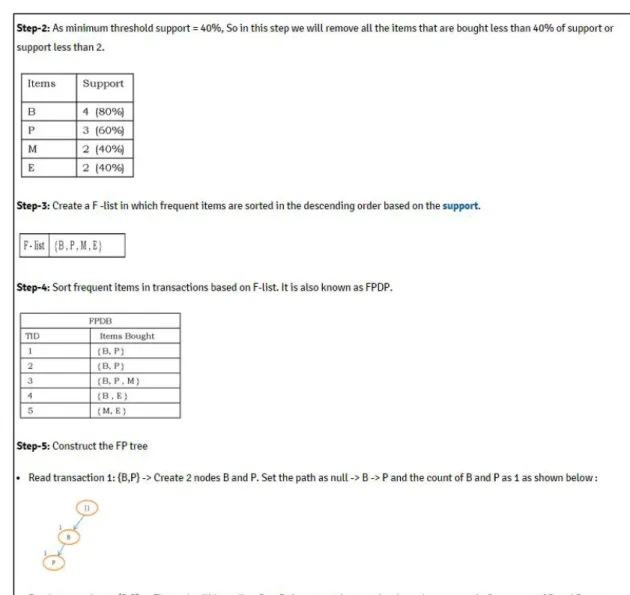
22 As Minimum threshold support = 40%, in this step we will remove all the items that are bought with less than 40% of support or support less than 2 [(40/100) * 5]. As shown in table 4.3, it results in
Table 4.3. FP Growth algorithm 1- item set minimum support threshold check
Step # 3: F-list generation
Create the F-list as shown in table 4.4, in which frequent items are sorted in the descending order based on the support.
Table 4.4. F-list
Step # 4: FPDP generation
Sort frequent items in transactions based on F-list as shown in table 4.5. It is also known as FPDP.
23 Step # 5: Construct the FP tree
Read transaction 1: {B,P} and create 2 nodes B and P as shown in figure 4.5. The path as null B P and Set counts of B and P to 1.
Figure 4.5. Transaction#1
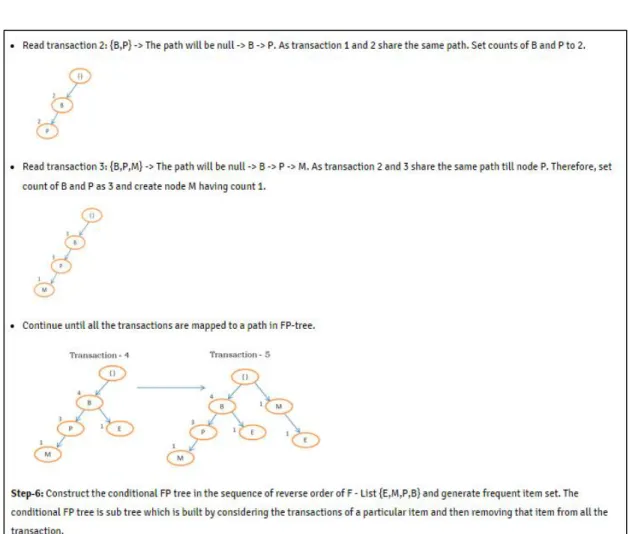
Read transaction 2: {B,P}.The path will be null B P as shown in figure 4.6. As transaction, 1 and 2 share the same path. Set counts of B and P to 2.
Figure 4.6. Transaction#2
Read transaction 3: {B,P,M}.The path will be null B P M. As transaction, 2 and 3 share the same path till node P. Therefore, Set counts of B and P to 3 and create node M having count 1 as shown in figure 4.7.
24
Figure 4.7. Transaction#3
Continue until all the transactions are mapped to a path in FP-tree as shown in
figure 4.8.
Figure 4.8. FP - tree The above table has two items that are bought frequently.
Step # 6: Construct the conditional FP tree
Construct the conditional FP tree in the sequence of reverse order of F-List i.e. in this example {E,M,P,B} and generate frequent item set. The conditional FP tree is a sub tree which is built by considering the transactions of a particular item set and then removing that item set from all the transaction as shown in table 4.6.
25 Table 4.6. Conditional FP tree
As for item set E and M, nodes in the conditional FP tree have a count (support) of 1 (less than minimum threshold support 2).Therefore association rules are nil. In case of item set P, node B in the conditional FP tree has a count (support) of 3 (satisfying minimum threshold support). Hence, frequent item set is generated by adding the item set P to B.
26 Chapter 5
RESULTS
Now that we have discussed the algorithms in detail, this chapter projects the advantage of being able to visualize these algorithms for easy understanding. Figure 5.1 provides a snapshot of how the courseware looks like which has an inbuilt feature of visualizing the Apriori and the FP growth algorithms.
27 To familiarize ourselves with the controls available in the courseware, detailed description is documented below.
Terms
No of items: Represents the number of items present in transactions (Maximum no of items allowed are 11)
No of transaction: Represents the number of transactions (Maximum number of transactions allowed are 10)
Min support: Minimum support threshold controlled by users. Min confidence: Minimum confidence threshold controlled by users.
User controls
o Skip Back: If you are in the middle of an animation, this button will completely undo the current command. If you are not in the middle of an animation, this button will undo the previous command [12].
o Step Back: This button is only active if you have paused the current animation (using the play/pause button). Step back one-step in the current animation. If you are not currently animating, step back into the previous command. You could use this button (with sufficient key presses) to back up through the entire history of everything you've done [12].
o Play/Pause: Toggle between play mode (in which the algorithm runs free until it completes) and paused mode (where you need to press the Step Forward or Step Back button to advance the animation) [12].
28 o Step Forward: This button is only active if you have paused the current animation (using the play/pause button), and the current animation has not yet completed. Step forward one step in the current animation [12].
o Skip Forward: This button is only active if the current animation has not completed. Skip to the end of the current animation [12].
o Animation Speed (slider): Change the speed of the animation. The value of this slider is saved in a cookie, so you should only need to set it once if you have a preferred speed [12].
o Change Canvas Size: Change the width / height of the display area. While the change is immediate, the animations will not be centered in this new field until you reload the page. This will clear out the current animation, but the width and height values are also saved in a cookie, so you should only need to change this field once, and then everything should work well if you are on a smart phone or a desktop with loads of screen real estate [12].
o Move: Controls Toggle between the general controls being at the top or bottom of the webpage [12].
5.1 Apriori algorithm – Feed and visualization trace
To start running the algorithm visually, the button “try examples” on the page Apriori or the button “Click here” below the “to try Apriori Algorithm” on the page visualization of the website should be present/ working which would bring up the user interface as shown in figure 5.2
29
Figure 5.2. Apriori algorithm – user feed screen (Pre)
User should enter number less than or equal to 11 for number of items and less than or equal to 10 for number of transactions and then click on submit. A screen will appear with the input matrix based on your inputs as shown in the following figure 5.3.
30
Figure 5.4. Apriori algorithm – transaction matrix feed (Pre)
Once the user interface pops up as shown in figure 5.4, enter the items (first letter only) in the first row starting from I1. In the respective text boxes, based on the transactions and the items enter a 1 if the item is present in that transaction or enter a 0 if the item is not present in that transaction. Also, specify the minimum expected support and confidence thresholds as shown in figure 5.5 and run the algorithm by hitting “submit”. This should run the algorithm and visualization snapshots are as in figure 5.2.
31 The flow of the algorithm is visualized in the following screenshots.
32 5.2 FP growth algorithm – Feed and visualization trace
To start running the algorithm visually, the button “try examples” on the page FPGrowth or the button “Click here” below the “to try FPGrowth Algorithm” on the page visualization of the website should be present/ working which would bring up the user interface as shown in figure 5.7.
Figure 5.7. FP growth algorithm – user feed screen (Pre)
User can enter any number below 12 for number of items and below 11 for the number of transactions and then click on submit which should pop up the input matrix based on your inputs as shown in figure 5.8.
33
Figure 5.9. FP growth algorithm – transaction matrix feed (Pre)
Once the user interface pops up as shown in figure 5.9, enter the items (first letter only) in the first row starting from I1. In the respective text boxes, based on the transactions and the items enter a 1 if the item is present in that transaction or enter a 0 if the item is not present in that transaction. Also, specify the minimum expected support and confidence thresholds and run the algorithm by hitting “submit”. This should run the algorithm and visualization snapshots are as in figures 5.11 – 5.12.
34 The flow of the algorithm is visualized in the following screenshots.
35
36 Chapter 6
CONCLUSIONS
In this chapter, we will briefly discuss the some important aspects and goals achieved during the course of this project. The purpose of this project is to make students understand the basic concepts of complex algorithms of association rule mining and help them visualize and remember the flow of the algorithm easily. This project will help students to learn algorithms through experimentation.
To sum it up, primary goal has been achieved. This “Association Rule Mining” project provides theoretical concepts related to data mining and association rule mining. Finding frequent item set by both Apriori and FP algorithms and association rule generation is our focus areas. The courseware developed in this project is simple and user-friendly which will help users to get acquainted with it quickly.
During the course of the project, I learned how to implement the algorithms with animations included by using java scripts. It also helped me to learn how to modularize the project.
To take it further, there is a large scope for enhancements. The project implementation is limited to the association rule mining algorithm, it will greatly help students if all other the data mining algorithms can be implemented. In addition, have a survey on the work to get reviews from students, by asking few questions related to their learning experience, quality, presentation, illustration of examples, visualization tool and organization of the material provided in the courseware.
37 REFERENCES
[1] Gregory Piateski and William Frawley, Knowledge Discovery in Databases. Cambridge, MA: MIT Press, 1991.
[2] Akash Rajak and Mahendra Kumar Gupta, “Association Rule Mining: Applications in Various Areas”, in Proceedings of International Conference on Data Management, Ghaziabad, India, pp. 3-7, February 25-26, 2008.
[3] Usama Fayyad, Gregory Piatesky-Shapiro and Padhraic Smyth, “From Data Mining to Knowledge Discovery: An Overview”, in Proceedings of AKDDM, AAAI/MIT Press, pp. 1-30, 1996.
[4] Data Mining, Technology note prepared for management 274A, Anderson Graduate School of Management at UCLA, Bill Palace, spring 1996. Available: http://www.anderson.ucla.edu/faculty/jason.frand/teacher/technologies/palace/ in January 2015.
[5] Pang-Ning Tan, Michael Steinbach and Vipin Kumar, Introduction to Data Mining, Available: http://www-users.cs.umn.edu/~kumar/dmbook/ch6.pdf in February 2015.
[6] Agrawal R, Imieliński T and Swami A, "Mining association rules between sets of items in large databases" in Proceedings of the ACM SIGMOD international conference on Management of data, SIGMOD '93.
[7] J. Hipp, U. Gntzer and G. Nakhaeizadeh, “Algorithms for Association Rule Mining – A General Survey and Comparison”, in Proceedings of SIGKDD Explorations, Vol. 2, no. 1, pp. 58-64, July 2000.
38 [8] Jiawei Han, Micheline Kamber and Jian Pei, Data Mining: Concepts and Techniques, The Morgan Kaufmann Series in Data Management Systems, July 2011.
[9] Knowledge Discovery in Databases, Available:
http://www.cise.ufl.edu/~ddd/cap6635/Fall-97/Short-papers/KDD3.htm in January 2015.
[10] Apriori algorithm for data mining – made simple, Available:
http://nikhilvithlani.blogspot.com/2012/03/apriori-algorithm-for-data-mining-made.html in February 2015.
[11] Agrawal, Rakesh and Srikant, Ramakrishnan, “Fast algorithms for mining association rules in large databases”, in Proceedings of the 20th International Conference on Very Large Data Bases (VLDB), pages 487-499, September 1994.
[12] David Galles, Data structure visualizations, Available: