THE CHANGING NEEDS OF A HOUSEHOLD’S DEMAND
FOR LIABILITIES OVER THE LIFE COURSE:
FOCUSED ON YOUNG ADULTS
By
SHAN MALAN
submitted in accordance with the requirements for the degree of
MASTER OF ACCOUNTING SCIENCE
at the
UNIVERSITY OF SOUTH AFRICA
Supervisor: Prof B de Clercq
Co-supervisor: Ms J Meiring
Declaration
Student number 0896-359-2
I declare that THE CHANGING NEEDS OF A HOUSEHOLD’S DEMAND FOR LIABILITIES OVER THE LIFE COURSE: FOCUSED ON YOUNG ADULTS is my own work and that all the sources that I have used or quoted have been indicated and acknowledged by means of complete references.
SIGNATURE DATE
Acknowledgements
I would like to extend my sincere thanks to the following people who assisted me in completing this dissertation:
• Professor Bernadene de Clercq, my supervisor, who provided continual support, dedication and guidance throughout the study.
• Professor Carel van Aardt, for his expert instruction and input during the data analysis phase.
• Ms Jacolize Meiring, my co-supervisor, and Ms Marietjie Coetzee, senior computer specialist, for their guidance and assistance.
• The University of South Africa’s College of Accounting Sciences, Department of Auditing and Bureau of Market Research, for providing the opportunity as well as the resources that enabled the completion of this study.
• My husband, Deon, and our sons, Adrian and Rohan, for their support and patience during the entire process.
Abstract
South Africans carry high debt levels and many deal with the threat of over-indebtedness. In particular, the debt situation of the youth is of utmost concern. This study was undertaken to gain an understanding of how the liability usage of households fluctuates over the life course. The main objective was to identify and describe how debt is accumulated by young South Africans and how household characteristics and events may be related to the uptake of household liabilities. This study conducted a comprehensive literature review culminating with the development of a heuristic model that identified variables that may affect household debt uptake. Quantitative statistical analysis techniques were employed on secondary data acquired from the South African Audience Research Foundation’s All Media and Products Survey for the years 1999 until 2013.
The findings identified that household debt follows a familiar life cycle pattern. A number of independent variables were shown to affect household debt uptake. Furthermore, certain of these variables are related to the trajectories of the life course.
Key words
• Debt product uptake
• Frameworks for understanding consumption behaviour
• Household debt
• Household debt indicators
• Liabilities
• Life course
• Life stages
• Unsecured debt
• Variables affecting debt uptake
Table of contents
Declaration ii
Acknowledgements iii
Abstract iv
List of figures ix
List of tables xii
List of abbreviations and acronyms xvi
CHAPTER 1INTRODUCTION 1
1.1. BACKGROUND INFORMATION 1
1.2. PROBLEM STATEMENT 5
1.3. PURPOSE AND SIGNIFICANCE OF THE STUDY 6
1.4. RESEARCH OBJECTIVES 7
1.5. RESEARCH DESIGN AND METHODS 8
1.6. LIMITATIONS OF SCOPE 10
1.7. DEFINITIONS 10
1.8. ETHICAL CONSIDERATIONS 11
1.9. CHAPTER OUTLINE 12
CHAPTER 2HOUSEHOLD DEBT IN SOUTH AFRICA 15
2.1. INTRODUCTION 15
2.2. DEFINITIONS AND COMPONENTS OF SOUTH AFRICAN
HOUSEHOLD DEBT 17
2.2.1. Household 17
2.2.2. Household debt and liabilities 18
2.2.3. Summary 26
2.3. INDICATORS USED TO MEASURE TRENDS IN HOUSEHOLD
DEBT 27
2.3.1. Introduction 27
2.3.3. The National Credit Regulator 29
2.3.4. Statistics South Africa 32
2.3.5. Financial Services Board 33
2.3.6. Financial institutions 33
2.3.7. Summary 37
2.4. THE CHANGING CREDIT SITUATION IN SOUTH AFRICA 37 2.5. THE SITUATION FACED BY THE YOUTH OF SOUTH AFRICA 45
2.6. CONCLUDING REMARKS 49
CHAPTER 3HOUSEHOLD DEBT OVER THE LIFE COURSE 51
3.1. INTRODUCTION 51
3.2. LIFE COURSE THEORY 52
3.2.1. Introduction 52
3.2.2. Background to life course theory 53
3.2.3. Conceptual frameworks for understanding consumption behaviour 62
3.2.4. Summary 73
3.3. A PERSPECTIVE OF HOUSEHOLD DEBT OVER THE LIFE
COURSE 74
3.3.1. Introduction 74
3.3.2. Characteristics that determine household participation in the debt
market 75
3.3.3. Increase in household debt 83
3.3.4. Impact of rising household debt on households 87
3.3.5. Summary 90
3.4. CONCLUDING REMARKS 90
CHAPTER 4RESEARCH DESIGN AND METHODOLOGY 93
4.1. INTRODUCTION 93
4.2. LITERATURE REVIEW 94
4.3. RESEARCH METHODOLOGY AND DESIGN 95
4.3.1. Introduction 95
4.4. DATA PREPARATION 102 4.4.1. Step 1: Evaluation of the suitability of the secondary datasets (AMPS
datasets) 103
4.4.1.1.Determination whether AMPS questionnaire included required
variables 104
4.4.1.2.Evaluation of the reliability and validity of the AMPS data collection
process 106
4.4.1.3.Evaluation of the integrity of the individual AMPS datasets 107 4.4.2. Step 2: Data preparation of the individual datasets 109 4.4.2.1.Ensuring extraction of comparable variables across all the different
datasets 110
4.4.2.2.Coding and re-coding to ensure comparability of variables across all
the different datasets 111
4.4.2.3.Data integrity tests to ensure data quality of recoded datasets 120 4.4.3. Step 3: Construct sample plan based on combined dataset 120
4.4.3.1.Combining the datasets 121
4.4.3.2.Visual inspection of data quality 123
4.4.3.3.Evaluation of data integrity of combined dataset 123
4.4.3.4.Compile a sample plan 124
4.4.3.5.Final validity and reliability of the sample 126
4.4.3.6.Description of realised sample 128
4.4.4. Step 4: Data Analysis 142
4.4.4.1.Visual inspection of data 143
4.4.4.2.Chi-Square test for independence 143
4.4.4.3.Cox proportional-hazards regression model 144
4.5. ETHICAL CONSIDERATIONS 147
4.6. LIMITATIONS 147
4.7. CONCLUDING REMARKS 148
CHAPTER 5RESEARCH FINDINGS 149
5.2. VARIABLES USED IN THE ANALYSIS 150
5.3. DEBT PRODUCT UPTAKE 151
5.3.1. Credit card uptake 151
5.3.2. Home loan uptake 157
5.3.3. Overdraft uptake 162
5.3.4. Student loan uptake 166
5.3.5. Vehicle finance uptake 171
5.3.6. Other loans uptake 175
5.4. SUMMARY OF VARIABLES THAT WERE STATISTICALLY
SIGNIFICANT PREDICTORS OF DEBT UPTAKE 180
5.5. CONCLUDING REMARKS 184
CHAPTER 6CONCLUSION 185
6.1. INTRODUCTION 185
6.2. RESEARCH OBJECTIVES AND A SUMMARY OF RESEARCH
FINDINGS 186
6.2.1. Research objective 1 186
6.2.2. Research objective 2 190
6.2.3. Research objective 3 191
6.2.4. Research objective 4 193
6.2.4.1.The effect of age on debt product uptake 194 6.2.4.2.The determinants of holding the various debt products 195 6.2.4.3.Variables that are significant indicators of debt uptake 196
6.2.5. Summary 200
6.3. LIMITATIONS OF THE RESEARCH 200
6.4. SUGGESTIONS FOR FUTURE RESEARCH 200
6.5. CONCLUDING REMARKS 201
List of figures
Figure 2.1: SARB’s composition of total household liabilities: 1997–2013 21 Figure 2.2: SARB’s composition of household debt: 2007 versus 2012 23 Figure 2.3: NCR’s composition of gross debtors’ book: Q4 2008 versus Q4
2013 25
Figure 2.4: Debt service ratio and ratio of household debt to disposable
income: 1997–2013 28
Figure 2.5: NCR’s credit standing of consumers: Q2 2008 versus Q2 2014 31 Figure 2.6: Consumer Financial Vulnerability Index 35
Figure 2.7: TransUnion Consumer Credit Index 36
Figure 2.8: Comparison of final household consumption expenditure by
households to disposable income of households 50
Figure 3.1: Basic concepts of the life course perspective 59 Figure 3.2: An example of an individual’s educational trajectory and family life
trajectory 61
Figure 3.3: The life cycle model 63
Figure 3.4: Household income and consumption over the life cycle 69
Figure 4.1: Taxonomy of accounting research 98
Figure 4.2: Data preparation process 103
Figure 4.3: Data preparation process: Step 1 103
Figure 4.4: Data preparation process: Step 2 110
Figure 4.5: Data preparation process: Step 3 121
Figure 4.6: Overall debt usage 128
Figure 4.8: Household income 130
Figure 4.9: Personal income 131
Figure 4.10: Work status in numbers 132
Figure 4.11: Respondents who are self-employed 133
Figure 4.12: Marital status of respondents 134
Figure 4.13: Level of education 135
Figure 4.14: Household size 136
Figure 4.15: Respondents who are responsible for dependents 137
Figure 4.16: Number of financial assets 138
Figure 4.17: Housing assets 139
Figure 4.18: Life events in the past 12 months 140
Figure 4.19: Respondents who live with their parents 141
Figure 4.20: Data preparation process: Step 4 142
Figure 4.21: Cox Regression 147
Figure 5.1: Respondents making use of credit card facilities 152 Figure 5.2: Hazard function for credit card use 157 Figure 5.3: Respondents making use of home loans 158
Figure 5.4: Hazard function for home loan use 161
Figure 5.5: Respondents making use of overdraft facilities 162
Figure 5.6: Hazard function for overdraft use 166
Figure 5.7: Respondents making use of student loans 167 Figure 5.8: Hazard function for student loans use 171 Figure 5.9: Respondents making use of vehicle finance 172
Figure 5.10: Hazard function for vehicle finance use 175 Figure 5.11: Respondents making use of other loans 176 Figure 5.12: Hazard function for other loan use 179 Figure 6.1: NCR: Credit standing of consumers for the quarter ended June
2008 188
Figure 6.2: NCR: Credit standing of consumers for the quarter ended June
2014 188
List of tables
Table 2.1: SARB’s compilation of liabilities in the household balance sheet 22 Table 2.2: Compilation of household liabilities according to the NCR 24
Table 2.3: Classification of liabilities 26
Table 2.4: Indicators sourced from the South African Reserve Bank 28
Table 2.5: Indicators provided by the NCR 30
Table 2.6: Enquiries made on consumer records: Q2 2008 versus Q2 2014 32 Table 2.7: Events shaping the financial sector in present-day South Africa 38 Table 2.8: Differences in the ages used to describe youth 46 Table 2.9: Unemployment rate for 15–24 year-olds from 2010–2013 47 Table 3.1: Life stages presented in the study performed by Wilkes 54 Table 3.2: Life stages presented in the study performed by Baek and Hong 54 Table 3.3: Life stages presented in the study performed by Schooley and
Worden 55
Table 3.4: The nine life stages as depicted by SAARF in the AMPS
questionnaire (1999–2007) 56
Table 3.5: The eight life stages as depicted by SAARF in the AMPS
questionnaire (2008–2013) 57
Table 3.6: Variables that have been shown to have an influence on debt
holding 76
Table 3.7: Abbreviations of variables used in Table 3.8 and Table 3.9 77 Table 3.8: Empirical studies on variables affecting household debt 78 Table 3.9: Empirical studies on variables affecting specific types of
household debt 79
Table 3.11: Heuristic model of variables affecting debt uptake 91 Table 4.1: Heuristic model of variables affecting debt uptake 94 Table 4.2: Fundamental differences between quantitative and qualitative
research 99
Table 4.3: Dependent variables required: Liability uptake per type of liability
product 105
Table 4.4: Independent variables required as per heuristic model 105 Table 4.5: Independent variables of interest (not required as per heuristic
model) 106
Table 4.6: Dataset sizes 108
Table 4.7: Structure of Excel spreadsheets 110
Table 4.8: Codebook for dependent variables 112
Table 4.9: Coding of the independent variables that were consistent across
the years 113
Table 4.10: Recoding of the life stage variables to make them comparable
across all the surveys 114
Table 4.11: Recoding of household income and personal income to make
them comparable across all the survey years 115
Table 4.12: Recoding of total males and females living in the household to
make it comparable across all the survey years 117
Table 4.13: Coding for children in the household to make them comparable
across all the survey years 118
Table 4.14: Coding for financial assets 119
Table 4.15: Coding of independent variables of interest 119 Table 4.16: Neural Network results of individual datasets 120
Table 4.18: Output from Neural network on combined dataset 124 Table 4.19: Cross tabulation of the filtered dataset 125
Table 4.20: Summary table of respondents 126
Table 4.21: Hierarchical cluster analysis 127
Table 5.1: Covariates included in the analysis 150
Table 5.2:Chi-square test Credit card and Age 153
Table 5.3: Impact of the independent variables on the usage of credit cards
by the respondents 154
Table 5.4: Chi-square test Home loan and Age 159
Table 5.5: Impact of the independent variables on the usage of home loans
by the respondents 160
Table 5.6: Chi-square test Overdraft and Age 163
Table 5.7: Impact of the independent variables on the usage of overdraft by
the respondents 164
Table 5.8: Chi-square test Student loan and Age 168 Table 5.9: Impact of the independent variables on the usage of student loans
by the respondents 169
Table 5.10: Chi-square test Vehicle finance and Age 172 Table 5.11: Impact of the independent variables on the usage of vehicle
finance by the respondents 173
Table 5.12: Chi-square test Other loans and Age 176 Table 5.13: Impact of the independent variables on the usage of other loans
by the respondents 177
Table 5.14: Summary of the results of the Cox-proportional hazards model
for variables shown to be statistically significant 180
Table 6.2: Ranking of variables shown to have an influence on debt holding 192 Table 6.3: Heuristic model of variables affecting debt uptake 193 Table 6.4: Statistically significant relationship between age and debt product 194 Table 6.5: Summary of the results of the proportional hazards model for
variables shown to be statistically significant 196 Table 6.6: Highlighting the statistically significant variables 197
List of abbreviations and acronyms
AMPS All Media and Products Survey ATM Automated teller machine
BASA Banking Association of South Africa BMR Bureau of Market Research
CFVI Consumer Financial Vulnerability Index DTI Department of Trade and Industry
EC European Commission
FSB Financial Services Board GDP Gross domestic product
HFCS Household Finance and Consumption Survey HSRC Human Sciences Research Council
IASB International Accounting Standards Board IFRS International Financial Reporting Standards IMF International Monetary Fund
LCH Life cycle hypothesis
MAMCA Media and Marketing Collection Agency
MBD/BMR MBD Credit Solutions/Bureau of Market Research NCR National Credit Regulator
NDP National Development Plan NPC National Planning Commission NYDA National Youth Development Agency
OECD Organisation for Economic Co-operation and Development OHMSA Out of Home Media South Africa
PDMSA Print and Digital Media South Africa PFRU Personal Finance Research Unit
PIH Permanent income hypothesis
REPIH Rational expectations permanent income hypothesis
SAARF AMPS South African Audience Research Foundation’s All Media and Products Survey
SAARF South African Audience Research Foundation SAICA South African Institute of Chartered Accountants SAMRA South African Market Research Association SARB South African Reserve Bank
SCF Survey of Consumer Finance SNA System of National Accounts
SPSS Statistical Package for the Social Sciences Stats SA Statistics South Africa
UK United Kingdom
UN United Nations
UNISA University of South Africa
CHAPTER 1
INTRODUCTION
1.1. BACKGROUND INFORMATION
“Youth is in danger until it learns to look upon debts as furies” – Edward G. Bulwer-Lytton (Inspirational quotes, words, sayings, 2015) Household debt is an area of research that holds great interest for researchers across the globe. The financial difficulties that are endured by many households in South Africa, as well as the rest of the world, are constantly in the spotlight. One only has to watch the daily news to be reminded that the youth in particular are facing extreme financial hardship by taking on too much unsustainable debt. This was at the forefront of the student protests in 2015 at the majority of the universities throughout the country. The students demanded that there should be no increment to university fees for 2016 as they are already unable to afford their fees. Thus, due to outstanding balances on their accounts, the affected students would not be able to obtain their results and consequently be unable to progress with their studies.
South Africa has experienced an increase in the number of people making use of credit and, according to the National Credit Regulator, statistics illustrate that there were 22.84 million credit-active consumers for the fourth quarter in 2014 (NCR, 2014b). According to the Consumer Credit Market Report issued by the National Credit Regulator, the total outstanding consumer debt for the fourth quarter of 2014 was R1.59 trillion (NCR, 2014c). This debt is made up of the following; mortgages, credit cards, vehicle finance, store cards, personal loans, short-term loans, insurance backed loans and developmental credit pension.
National Treasury (2012a) has expressed particular concern about the growth of unsecured lending as a percentage of total consumer borrowing and it appears that households may be using credit to cover monthly living expenses, in other words for consumption purposes. Finmark Trust (2014) has indicated, based on the information obtained from their 2014 survey, that of the people who borrow, mainly from formal institutions, 42 percent used the borrowings to pay for food and
17 percent used the borrowings to pay bills (Finmark Trust, 2014). The National Credit Regulator has also issued a report on research conducted on the increase of unsecured personal loans in South Africa’s credit market. One of their conclusions was that further consumer-related research is required to analyse the factors that act as credit demand (NCR, 2012:19).
National Treasury, together with the Banking Association of South Africa (BASA), reached an agreement regarding responsible lending on the 19th of October 2012. The purpose of the agreement was to enhance responsible lending and to prevent households from being trapped in a debt spiral. One of their objectives was to prevent future indebtedness and address current over-indebtedness (National Treasury, 2012a). They announced in April 2013 that changes were being planned to amend the lending rules in respect of unsecured lending (Business Day Live, 2013).
From the aforementioned paragraphs, it appears as though the stakeholders of the credit industry in conjunction with the policymakers are determined to find a solution to the increasing debt problem among South African consumers.
In the preceding discussion, the terms indebtedness and over-indebtedness were mentioned. De Clercq (2013) highlights the difference between these two concepts, explaining that indebtedness refers to the amount of debt and does not take into account whether the debt is affordable or not. Over-indebtedness, on the other hand, is an indicator of whether too much debt has been accumulated and therefore provides an indicator of unaffordable debt (De Clercq, 2013). Therefore, it is not so much that debt is problematic, but as soon as households are unable to service the debt and in turn become over-indebted, the household financial situation becomes difficult.
Various useful indicators may be used when analysing indebtedness. One of the indicators for indebtedness in South Africa is the debt to disposable income ratio. The South African Reserve Bank Quarterly Bulletin for June 2013 announced that South Africa had a debt to disposable income ratio of 75.4 percent (SARB, 2013c). This reflects a drastic fall from 82.4 percent in 2008 following the recession of 2008/2009 and a fall in the prime overdraft interest rates from 15.5 percent in 2008
to 8.5 percent in 2013. Notwithstanding the decrease, the high debt to disposable income ratio is indicative that household debt levels are still too high. It is worth mentioning that South Africa’s debt to disposable income ratio compares favourably with a number of developed countries that have much higher debt to disposable income ratios (Meniago, Mukuddem-Petersen, Petersen & Mongale, 2013:482). However, South Africa is a country with many unique problems, such as high unemployment, poor education, slow growth in income earned, lack of household savings, and high income disparities. All these problems exacerbate the unfavourable liability position of households.
Another indicator of household indebtedness is the household debt service ratio. In South Africa the household debt service ratio as a percentage of household income was 7.7 percent, at the end of the second quarter for 2013, which shows an improvement since 2008 when it was 12.5 percent (SARB, 2014a). In spite of this, the improvement is not a result of a decrease in consumer borrowing. On the contrary, household borrowing is increasing but the low interest rate environment has had a favourable effect on repayment of debt. When interest rates rise, this percentage will increase and households will consequently again face hardship in servicing their debt. When households carry excessive levels of debt they face the danger of being exposed to various risks that make them extremely vulnerable to financial hardship. These risks are broadly classified as interest rate risk, investment risk and unemployment risk (Meng & Mounter, 2009:17).
It could be said that high debt levels have an adverse effect on the economy as a whole. An economy in a good financial situation is related to a household sector with favourable debt levels (Meniago et al., 2013:482). Thus, if the debt situation of households improves, the effect on the South African economy would also be positive.
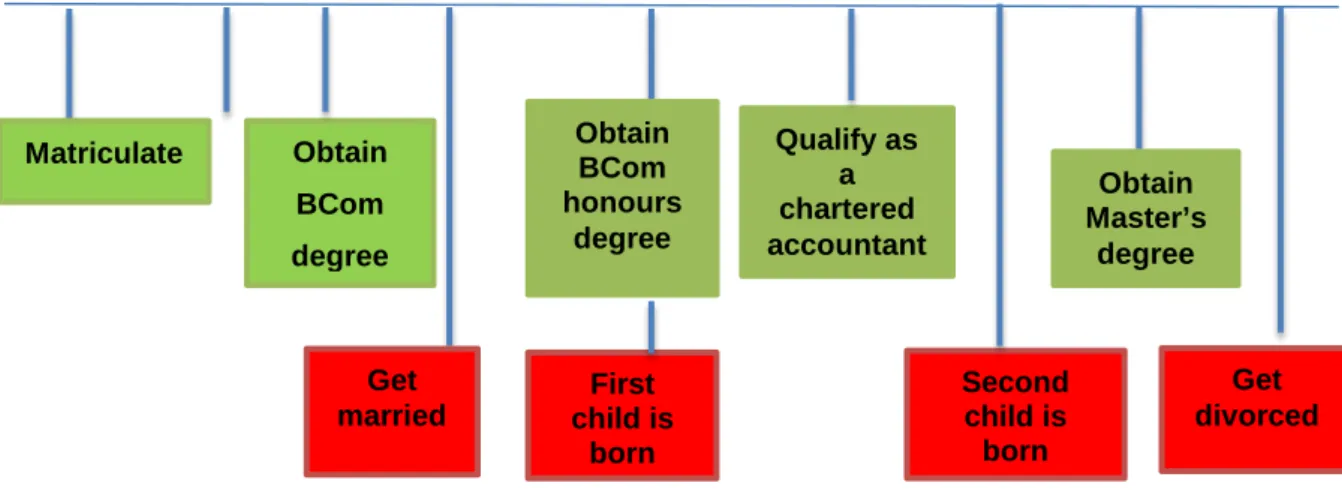
As individuals age, they go through various life stages, for example matriculating, obtaining an education, being employed for the first time, moving into their own house, getting married, having children, and then having their own children leave home. Thus, it can be deduced that people will make use of different types of debt at distinct times during their lives, depending on which stage of the life cycle the household finds themselves in. There are also certain factors that have been
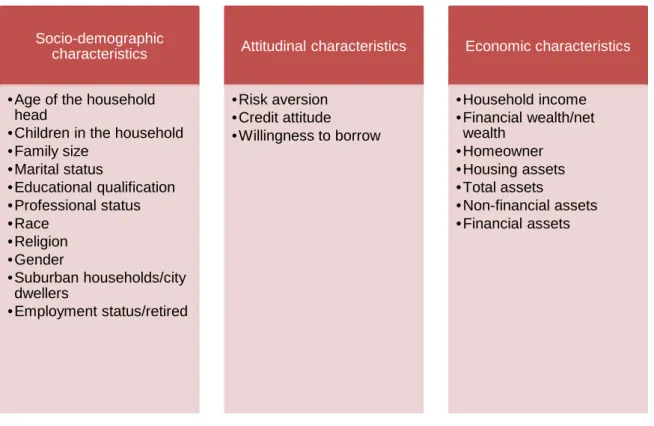
found to influence debt take-up by households; these are classified as socio-demographic characteristics, attitudinal characteristics and economic characteristics (Vandone, 2009:32).
Having provided an outline of the debt situation of South African households, the study will follow a life course approach to gain an understanding of how the demand for liabilities will fluctuate over the life course of households.
The life course approach is well known in the social and applied sciences (Sandoval, Rank & Hirschl, 2009:718). It is a practical framework for understanding how the lives of individuals unfold and how specific events and transitions may affect trajectories over the life course (Elder, 1994). Furthermore, previous empirical research has revealed that the life cycle hypothesis (LCH) provides valuable insight into the pattern of debt holding across the life course (Baek & Hong, 2004; Cox & Jappelli, 1993; Crook, 2003; Debelle, 2004).
To date, the life cycle hypothesis is one of the dominant frameworks for understanding consumption and savings behaviours in economics (Tippett, 2010:16). The life cycle hypothesis predicts that people will smooth their consumption independently of their income and as such may take on more debt in times when income is lower or absent in order to maintain a steady level of consumption (Baek & Hong, 2004:361; Gourinchas & Parker, 2002:7; Schooley & Worden, 2010:267). This appears to be the case with many young adult South Africans taking up debt to finance consumption in order to smooth their consumption expenditure. International studies have reported that unsecured credit is being utilised to meet their financial needs and that young consumers choose to borrow large amounts; causing their saving to be in a negative position in early working life (Gourinchas & Parker, 2002:75). Younger households are also more likely to face liquidity constraints (Debelle, 2004:54).
Young South African adults are in the spotlight of facing financial hardship by taking on high levels of debt and then being unable to repay it. They may face the situation of being in a debt trap from which they cannot escape and may thus face a bleak future in terms of financial wellness as they move through their life course. A report by Finney, Collard and Kempson (2007) for the Personal Finance
Research Centre at the University of Bristol, on borrowing over the life cycle in the United Kingdom (UK), revealed that young adults appeared to be particularly susceptible to intense pressure from society to consume and were prepared to borrow for consumption purposes. It is interesting to note that Gourinchas and Parker (2002:75) reported that consumption lies above income up to the late twenties, thereafter consumption and income both increase from about the age of 30–45 and then consumption drops below income. This aptly explains why the youth of South Africa experience elevated levels of debt.
By acquiring an understanding of the risks households face relating to debt over the life course, this study will assist the National Treasury in developing proactive approaches to debt policy in order to achieve one of their strategic goals as identified in the Consumer Financial Education Strategy Development workshop, namely ensuring household stability (South Africa. KwaZulu-Natal Treasury, 2014). The results of the study will enable the National Credit Regulator to assist consumers with debt counselling procedures, as well as the application of the National Credit Act. This research will contribute to the overall explanation of household debt and could assist financial service providers in making decisions regarding the granting of credit by ensuring that the possible risks to both financial service providers and the consumer are identified. The results could assist consumers in changing their attitudes about borrowing and contribute to their financial discipline during the various life cycle stages. Households will also benefit from gaining information about the determinants of debt holding over the life cycle and its effect on the household’s financial well-being.
1.2. PROBLEM STATEMENT
Various stakeholders have expressed concern that South African households’ debt burden is increasing at an alarming rate. High debt levels play a large contributing part to households finding themselves in detrimental financial positions.
In addition to households being heavily indebted, the increase in the use of credit coupled with the fact that the household sector has continued to experience elevated levels of financial stress has resulted in households also facing the risk of being over-indebted. This risk is intensified by rising inflation and a sluggish growth in real disposable income (SARB, 2013a).
In particular, various policy decision makers have expressed concern that young South African adults are at great risk of becoming over-indebted (Finmark Trust, 2014; SARB, 2013a; NCR, 2014c). At the root of the problem is the fact that a large number of young adults are facing unemployment. The official unemployment figure in 2013 for the youth stands at 52.9 percent (SARB, 2013a). Also of grave concern is the high debt that many students carry to enable them to study at tertiary institutions. The affordability of this debt is currently in the spotlight as students protest against an increase in student fees.
1.3. PURPOSE AND SIGNIFICANCE OF THE STUDY
Limited research has been done in South Africa on understanding how the holding of households’ liabilities fluctuate over the life course and which events and characteristics may have an influence on this debt variation. Of particular concern is the debt holding of young adults, as they are one of the population groups that were identified in the preceding paragraph as having a greater need of intervention to enable them to be financially sound. The stakeholders have the power and authority to intervene and this research will greatly assist them in their efforts to regulate and monitor the credit usage of young adults. This study will also assist in the formulation of fiscal policy.
The purpose of this research study was to identify and describe how debt is accumulated by young adult South Africans and how household characteristics and events may be related to the uptake of household liabilities.
The study aimed to assist in the identification of the extent of the financial demands and challenges at the young adult life stage, including why debt is accumulated by South Africans and which characteristics and events may act as a trigger for households becoming over-indebted.
The research will provide insight to regulatory bodies and policy decision makers including National Treasury, the National Credit Regulator (NCR), and the Banking Association of South Africa, amongst others. The results may assist them in providing and implementing policies whereby the public will be more educated and informed about how to manage household debt and avoid being caught in a debt spiral.
1.4. RESEARCH OBJECTIVES
The objective of the study, which addressed the research problem, was to identify and describe how liabilities are accumulated by young adult South Africans and how household characteristics and events may be related to the uptake of household liabilities.
The following sub-objectives were formulated in order to address the primary research objective:
1) To investigate household debt in South Africa based on the available sources. This objective was achieved by:
• Defining the different definitions relevant to households and household liabilities and discussing the components of household debt (section 2.2).
• Describing the various indicators used to measure household debt trends (section 2.3).
• Describing the changing credit situation in South Africa (section 2.4).
• Describing the situation of the youth in South Africa (section 2.5).
2) To review the life course theory based on available sources. This objective was achieved by:
• Performing a bibliographic search and a discussion of the most important contributions to the literature (section 3.2.2).
• Discussing the various conceptual frameworks for understanding consumption behaviour (section 3.2.3).
3) To obtain a perspective of household debt over the life course based on available sources. This objective was achieved by:
• Identifying characteristics that may determine a households’ participation in the debt market (section 3.3.2).
• Identifying the reasons for the increase in household debt on an international level (section 3.3.3).
• Discussing the impact of rising household debt (section 3.3.4).
4) To identify the characteristics that may determine the holding or use of the different types of household debt by young South African adults. This objective was achieved by:
• Identifying how age affects debt product uptake (section 5.3).
• Identifying the determinants of holding each type of debt classified as follows according to the AMPS survey: credit card facilities, home loans/mortgage bonds, overdraft facilities, student loans, vehicle finances with a financial institution, and other loans (section 5.3).
• Identifying, analysing and grouping the factors that are seen to have a statistically significant influence on the pattern of debt holding (section 5.4).
1.5. RESEARCH DESIGN AND METHODS
The main research objective of this study that addresses the research problem is to identify and describe how liabilities are accumulated by young adult South Africans and how household characteristics and events may be related to the uptake of household liabilities.
The researcher conducted this study in two phases. During the first phase of the study, a literature review was performed. The literature review consisted of two sections: the first section (Chapter 2) investigated household debt in South Africa. The second section (Chapter 3) discussed household debt over the life course. The literature review concluded in a heuristic model that indicates a number of independent variables that may affect the debt uptake of a household.
During the second phase of the study, quantitative statistical analysis was conducted on secondary data obtained from the South African Audience Research Foundation’s All Media and Products Survey (SAARF AMPS) for the years 1999– 2013.
In order to represent the population of South Africa, a large probability sample is taken. The sample has the following characteristics; it is scientifically drawn,
multi-stage and area stratified. Population estimates were used and the sample was weighted up to the total population. The data was collected by means of personal in-home interviews and a new sample was taken for each survey. The SAARF AMPS survey covers the total adult population of South Africa. The AMPSsample is currently amongst approximately 25 100 South African adults (15 years and older) per annum in two national fieldwork waves (January–June and July– December) (SAARF, 2013). The selection of communities, addresses and respondents was done by SAARF AMPS based on their sample design, which was applied throughout the surveys (SAARF, 2013). SAARF employs techniques designed to ensure the validity and reliability of the data collected. Data preparation steps were used to prepare the data for analysis and the individual datasets were combined into one dataset with a population size of 358 645 respondents. The sample was then selected by filtering the population. That is, only 18-year-olds were included in 1999 and 19-year-olds in 2000 until 2013 where only 32-year-olds were included in the sample. This sample selection process ensured that individuals’ debt behaviour could be tracked across the life course as the person progressed from 18 to 32 years of age. In order to ensure the validity, reliability and stability of the data, relevant tests were carried out by the researcher and these are discussed in Chapter 4. The diagnostic results to ensure data validity, integrity and stability include neural networks and hierarchical cluster analysis. Also, the ethical approach applied, during the data collection, data cleaning and data preparation, by SAARF was considered by the researcher. Descriptive and inferential statistics were used to analyse the results of the questionnaires. The descriptive techniques employed in the study were obtained by making use of frequency distributions. Inferential statistics were employed by means of chi-square test for independence and cox proportional-hazards regression models, which form part of event history analysis (Adams, 1996:271). A longitudinal study was performed, across fifteen years, with reference to the life course approach. The life course approach provides a valuable framework for understanding how individuals’ lives unfold over a period of time (Sandoval et al., 2009:717). It is concerned with how certain events, transitions or characteristics affect the sequential order of events that take place (Marshall & Mueller, 2003).
Thus, by making use of a life course approach, valuable information was obtained in identifying why certain events act as predictors of the hazard. The hazard, in this instance, is the take-up of the particular debt product. A Cox proportional-hazards regression model was utilised, as it is an event history method that enables the researcher to predict the length of time it takes for an individual to take up a particular debt product. The independent variables (covariates) that were entered into the cox-proportional-hazards regression model were based on the variables that were indicated in the heuristic model developed by the researcher in the conclusion to the first phase of this study. The dependent variables were credit card debt, home loan debt, overdraft facilities, student loans, vehicle finance and other loans.
1.6. LIMITATIONS OF SCOPE
It should be noted that this study was limited to the financial services that are listed in the AMPS survey. The analysis was performed based on the classification of the financial services as reflected in the AMPS survey. The study was limited to formal debt held by households. The AMPS survey only makes provision for the different types of debt and not for the amount of debt held. Due care was taken to be explicit regarding any limitations encountered during the study.
This study is limited to analysing the debt product uptake of the youth. The reason for this was that this age group appears to be most at risk of being financially vulnerable, as alluded to previously in this section.
1.7. DEFINITIONS
For the purposes of this study, the terms below are defined in the following way:
Definition of a household:
The definition of a household according to the South African Audience Research Foundation All Media and Products Survey (SAARF, 2012) is the definition that is applied in this research, namely:
A household consists either of one person living alone or a group of persons, usually but not always members of one family, who live together and whose expenditure on food and other household items is jointly managed. Boarders and lodgers may be included as members of a household, provided that they have at least one main
meal a day communally. Resident domestic workers are, however, excluded and are regarded as forming a household of one or more persons in their own right.
Definition of household debt:
Household debt refers to a liability or obligation that arises as a result of borrowing money or receiving goods or services on credit. (Prinsloo, 2002:63).
Definition of liabilities:
The terms liabilities and debt are used interchangeably throughout this study. Liabilities are debt and obligations. “Liabilities” is an accounting term and is formally defined by International Accounting Standard 1 (IASB, 2010) as follows:
A liability is a present obligation of the entity arising from past events, the settlement of which is expected to result in an outflow from the entity of resources embodying economic benefits.
Definition of life course:
Elder (1994) describes life course as follows:
The life course generally refers to the interweave of age-graded trajectories, such as work careers and family pathways, that are subject to changing conditions and future options, and to short-term transitions ranging from leaving school to retirement.
Definition of youth:
In South Africa, the National Youth Development Agency (NYDA) was established by Act no. 54 of Parliament in 2008. It describes youth as being between the ages of 14 and 35. Statistics South Africa regard youth as being persons between the ages of 15 and 34 (Stats SA, 2014b). The South African Reserve Bank classifies youth as being 15–24 year-olds (SARB, 2015a). For the purposes of this study, the respondents aged 18–32 are considered as youth due to the availability of reliable data for this age group.
1.8. ETHICAL CONSIDERATIONS
Ethical clearance to conduct the research, involving the secondary data obtained by the South African Audience Research Foundation (SAARF) All Media and
Products Surveys (AMPS), was obtained from the School of Accounting Sciences Ethical Review Committee meeting.
Permission was obtained from SAARF to use the secondary data obtained from the AMPS surveys. SAARF is a member of the South African Market Research Association (SAMRA). SAMRA is a professional association that has a code of conduct to which its members must subscribe. This data is widely used in the financial services industry and is the only data source available that provides answers to many of the financial services research questions. Permission was granted by SAARF to the Bureau of Market Research (BMR) to use their data for their research projects and it is extensively used for this purpose.
SAARF complies with their ethical code and obtains consent from all the participants to the surveys prior to performing the at-home interviews in two national fieldwork waves per annum.
1.9. CHAPTER OUTLINE
This study was conducted in two phases. During the first phase, a literature review was conducted, as described in Chapters 2 and 3. This phase culminated in the development of a heuristic model by the researcher, identifying variables that may affect debt uptake in South Africa. During the second phase, empirical data was analysed, as described in Chapters 4 and 5. The analysis of this empirical data was based on the heuristic model developed during the literature review.
Chapter 1: Introduction
The first chapter provides an introduction and background to the study. The purpose of the study, the research objectives, the problem statement, the significance, motivation, definitions, limitations and brief chapter overviews are presented.
Chapter 2: Household debt in South Africa
The second chapter highlights important findings from the available literature relating to household debt in South Africa. Definitions of key terms are provided and the various components and classifications of household debt are considered. A number of useful indicators used by the stakeholders in the credit industry are
discussed. The chapter includes a description of how household debt has changed following the financial liberalisation process and discusses the situation of the youth with regard to their debt position.
This chapter addresses the first research objective and forms the first part of phase one of the study.
Chapter 3: Household debt over the life course
The third chapter explains the changing needs of a household’s demand for liabilities over the life cycle. This chapter outlines life course theory, discusses certain conceptual frameworks for understanding consumption behaviour, and identifies international trends in the holding of household liabilities. It also includes a perspective on household debt over the life course, dealing with characteristics of indebted households, the reasons for the increase in household debt on an international level, and the impact of rising household debt.
This chapter addresses the second and third research objectives and forms the second part of the first phase of the study.
Chapter 4: Research design and methodology
The fourth chapter discusses the research design and methodology applied for the empirical part of this study. A perspective of mainstream accounting research is followed and the researcher maintains an objective viewpoint. The research design is quantitative and a longitudinal study was undertaken in terms of the life course approach.
The study analysed secondary data obtained from the SAARF AMPS for the years 1999–2013. This chapter includes details on the manner in which the empirical study was conducted, including an explanation of how the data was prepared and a description of the sample. The demographic profile of the respondents included in the sample is considered. Ethical considerations are addressed and any limitations of the study are discussed.
This chapter addresses the fourth research objective and forms part of the second phase of the study.
Chapter 5: Research findings
The fifth chapter focuses on the presentation and analysis of the research findings. Inferential analyses of the secondary data from the AMPS questionnaires are conducted, reported on and interpreted.
The chapter provides information of the relationship between age and the take-up of the debt products and the results of the chi-square analyses are presented. The chapter also discusses the results of the Cox proportional-hazards regression model and indicates which of the variables derived from the heuristic model are shown to be statistically significant predictors of debt uptake.
This chapter addresses the fourth research objective and forms part of the second phase of the study.
Chapter 6: Conclusion
The sixth chapter concludes the research. Summaries of the findings are presented and an evaluation of the importance of the research is provided. The limitations to the study and recommendations for further research are considered.
CHAPTER 2
HOUSEHOLD DEBT IN SOUTH AFRICA
2.1. INTRODUCTION
South Africa has experienced an increase in the number of people making use of credit. The National Credit Regulator in the fourth-quarter Credit Bureau Monitor of 2014 revealed that statistics illustrate that there are 22.84 million credit-active consumers (NCR, 2014b). This is indeed a significant increase from the end of September 2007, which was the National Credit Regulator’s first release of data, when there were 16.9 million credit-active consumers (NCR, 2007).
Previous research has indicated several reasons as to why consumers take on debt. These include smoothing of consumption during periods when they experience temporary income downturns; when expecting an increase in future income; for financing the purchase of housing or durable items; for financing education or to attend training; for an investment in financial assets when the returns on these assets look promising; and for offsetting excess savings implied by occupational pension rules (Aron & Muellbauer, 2006:32). Some of these reasons for taking on debt will be elaborated on in Chapter 3, which will deal with the various events and transitions that a household experiences as it moves through the various life stages. These events and/or transitions may act as triggers for the household demanding debt at a particular point in time.
One only has to read daily newspapers or watch the daily news to realise that high debt levels may play a large contributing part in households finding themselves in the detrimental financial position that many consumers in South Africa are facing. It is alarming that 9.6 million of the credit-active consumers mentioned above have impaired records (NCR, 2014a). This is a disturbing figure, as it translates into 44.2 percent of all credit-active consumers having impaired records. An impaired record is defined as “A record on which a consumer and/or any of the accounts, are either classified as three or more payments or months in arrears, or which has an ‘‘adverse listing’’, or that reflects a judgement or administration order” (NCR, 2014a). Households who have impaired records are clearly not financially healthy, which could in turn lead the respective household to feeling financially vulnerable.
As explained by De Clercq (2013:164), a number of independent variables could have an effect on a household’s perception of being financially vulnerable. She lists the various exogenous variables as being population group, province, gender, age, economic outlook, structure of the household, monetary policies and fiscal policies. The endogenous variables include area in which the household resides, confidence in the economy, health of the consumer, level of education, employment status, level of income, source of income, assets held, liabilities held and expenditure patterns relating to consumption.
Household debt is one of the factors that play a part in determining a country’s consumption expenditure and the current lack of growth of consumption expenditure of the South African population is worrying. The Monetary Policy Committee issued a statement in March 2014 stating that, as a result of the slow growth in the rate of both employment and credit extension, the high levels of consumer debt, as well as the higher interest rate environment, the outlook for growth in consumption expenditure is expected to be constrained (SARB, 2014b). This unfavourable outlook for consumption expenditure does not represent a favourable position with regard to South Africa’s economic growth, as household consumption expenditure forms a large component of gross domestic product (GDP), with the ratio of final consumption expenditure by households to gross domestic product being 60.8 percent (SARB, 2014a). De Clercq (2013:31) presents the components of gross domestic product according to Keynes (2008) as follows: gross domestic product is equivalent to investment expenditure plus household consumption expenditure plus government expenditure plus “exports minus imports” plus residual. Dasgupta (2007:476) explains that the value of all the final goods produced by its residents in a year is the country’s gross domestic product and is the measurement of an economy’s total output (Dasgupta, 2007:476). He also points out that it is widely held that economic growth means growth in real gross domestic product per capita. Following on from this discussion, it is apparent that high debt levels as previously mentioned have an adverse effect on the percentage growth in gross domestic product, which in turn has a detrimental effect on the economy as a whole.
The main research objective of the study, which addressed the research problem, is as follows:
To achieve the main research objective, this study was carried out in two phases. This chapter together with Chapter 3 forms part of the first phase of this study. This chapter will address the first research objective of the study (section 1.4): To investigate household debt in South Africa based on the available sources. This objective will be achieved by:
• Defining the different definitions relevant to households and household liabilities and discussing the components of household debt (section 2.2).
• Describing the various indicators used to measure household debt trends (section 2.3).
• Describing the changing credit situation in South Africa (section 2.4).
• Describing the situation of the youth in South Africa (section 2.5).
2.2. DEFINITIONS AND COMPONENTS OF SOUTH AFRICAN HOUSEHOLD DEBT
This chapter will investigate household debt in South Africa based on the literature. The definitions of a household, household debt and liabilities will be important throughout the study and will be discussed below before providing information on the various classifications of household debt in South Africa.
2.2.1. Household
As households are the focus of this study, it is necessary to arrive at a definition of a “household”. A household is defined by the System of National Accounts (SNA, 2008:462) as;
To identify and describe how liabilities are accumulated by young adult South Africans and how household characteristics and events may be related to the uptake of household liabilities.
A group of persons who share the same living accommodation, who pool some, or all, of their income and wealth and who consume certain types of goods and services collectively, mainly housing and food.
The SNA (2008) was produced and released with the assistance of the United Nations (UN), the European Commission (EC), the Organisation for Economic Co-operation and Development (OECD), the International Monetary Fund (IMF) and the World Bank Group (WBG) (SNA, 2008:iii). This definition is therefore widely used throughout the world. Another definition of a household, already mentioned in section 1.7, by the South African Audience Research Foundation’s All Media and Products Survey (SAARF, 2012), is similar and states that:
A household consists either of one person living alone or a group of persons, usually but not always members of one family, who live together and whose expenditure on food and other household items is jointly managed. Boarders and lodgers may be included as members of a household, provided that they have at least one main meal a day communally. Resident domestic workers are, however, excluded and are regarded as forming a household of one or more persons in their own right.
2.2.2. Household debt and liabilities
When referring to household debt, Prinsloo (2002:63) states that household debt refers to a liability or obligation that arises as a result of borrowing money or receiving goods or services on credit.
Households utilise credit for a number of reasons and there are various characteristics which influence their participation in the debt market and which will be explored in greater detail in Chapter 3. Thus, households will take on various types of debt depending on the reason for acquiring the debt instrument.
In this study the terms liabilities and debt are used interchangeably. A liability is described by the International Financial Reporting Standards (IASB, 2010) as follows:
A liability is a present obligation of the entity arising from past events, the settlement of which is expected to result in an outflow from the entity of resources embodying economic benefits.
In South Africa, there are various classifications of debt which are similar in concept but which have slight variations. Scheepers (2013:62) points out that when considering household liabilities, an essential characteristic is that the household has a present obligation or the responsibility to perform in a particular manner. She adds that it is therefore necessary that an irrevocable agreement must be in existence to acquire an item on credit and delivery of the item must take place in order for an obligation to arise.
Stakeholders in the credit industry use various classifications. The classifications provided by the following institutions will be examined in detail: the System of National Accounts, the International Accounting Standards Board, the South African Reserve Bank and the National Credit Regulator. The liability classification developed by Scheepers (2013) in the dissertation entitled “Developing a statement of financial position model for the South African household sector” will also be described.
The System of National Accounts 2008 was designed to accommodate the needs of all countries that are at various stages of economic development. It is a statistical framework that has the purpose of providing a comprehensive, flexible and consistent group of macroeconomic accounts for policymaking, research and analysis (SNA, 2008:xlvii). According to the System of National Accounts (2008:230), loans are divided between short term and long term. A short-term loan is classified as a loan that has an original maturity of one year or less and a long-term loan is a loan that has an original maturity of greater than one year. The System of National Accounts also states that it may be valuable to make a distinction between loans that were originally taken out for a period longer than a year but in the current accounting period have less than one year to maturity, and loans that have mortgages as security (SNA, 2008:230).
The International Accounting Standards Board (IASB) is a standard setting foundation and is responsible for the development and maintenance of International Financial Reporting Standards (IFRS), which is a single set of accounting standards that are accepted globally (SAICA, 2010). According to Scheepers (2013:8), International Financial Reporting Standards is the vehicle used both internationally and in South Africa that enhances reliability and ensures
that all the elements can be compared. The various elements comprise assets, liabilities, income, expenditure and equity. Liabilities are classified according to the International Accounting Standards (IAS 1) as either current liabilities or non-current liabilities (IASB, 2010). International Accounting Standards 1 paragraph 69 classifies a liability as current when:
a) The liability is expected to be settled in its normal operating cycle; b) The liability is primarily held for the purpose of trading;
c) The liability is due for settlement within twelve months subsequent to the reporting period; or
d) The liability does not have an unconditional right to defer settlement for at least twelve months after the reporting period.
International Accounting Standard 1 paragraph 70 classifies non-current liabilities as all other liabilities.
Currently the South African Reserve Bank (SARB) is the only institution in South Africa that presents a household balance sheet based on macroeconomic data (Scheepers, 2013:320). Household balance sheets play a crucial role as they provide important information regarding household wealth (Walters & National Accounts Division, 2011:69) and they are also necessary for assessment of the distribution of wealth and liquidity (Aron, Muellbauer & Prinsloo, 2007:5). The first official household sector balance sheets were published in the South African Reserve Bank June 2006 Quarterly Bulletin in an article by Aron et al. with the title “Estimating household-sector wealth in South Africa” (Kuhn, 2010:66). These household sector balance sheets are compiled on a market value basis from long quarterly time series of wealth estimates (Aron et al., 2006:61) and are the most comprehensive in respect of any emerging market or economy that is in the developmental stage (Aron & Muellbauer, 2013:S163). Kuhn (2010:66) used the above-mentioned estimates for 1975 to 2005 compiled by Aron et al. (2006) as a basis for refining the South African Reserve Bank’s household balance sheets for the period subsequent to 2005 by taking standard international practice and new sources into account. Information on household debt was gathered from the Bank Supervision Department of the South African Reserve Bank and, subsequent to
2008, more detail has become available following the implementation of the Basel II framework. The South African Reserve Bank classifies household debt as mortgage advances and other debt (Kuhn, 2010:68). Other debt includes open accounts, personal loans, credit card debt and instalment sale and leasing finance extended by banks (Kuhn, 2010:69). The composition of household liabilities according to the South African Reserve Bank’s Balance Sheet is reflected in Figure 2.1.
Figure 2.1: SARB’s composition of total household liabilities: 1997–2013
Source: SARB, 2013a.
Figure 2.1 reveals the growth in debt from 1997–2013. It is evident that household debt is steadily increasing and that the amount of other debt taken up by households is steadily growing in comparison to mortgage advances, which have gradually increased from 2008. Hence, the growth in total household debt is largely attributable to the surge in other debt.
An extract from Scheepers’ (2013) compilation of the South African Reserve Bank’s household balance sheet, which includes the source of the information, is reflected in Table 2.1 (Scheepers, 2013:99). The information presented in Table 2.1 is useful in gaining an understanding of the various components and
sub-0 200 400 600 800 1000 1200 1400 1600 1800 19 97 19 98 19 99 20 00 20 01 20 02 20 03 20 04 20 05 20 06 20 07 20 08 20 09 20 10 20 11 20 12 20 13 Other debt Mortgage advances R Billions
components. The information was sourced from Kuhn (2010) and Walters and National Accounts Division (2011) (Scheepers, 2013:99).
Table 2.1: SARB’s compilation of liabilities in the household balance sheet
Liabilities Compilation Source
Mortgage advances
Loan financing from the commercial banking sector.
Value is obtained from monthly returns provided by the banks. Other debt Trade credit (open account credit). Includes
retail debt and amounts owing to buy-aid institutions.
Personal bank loans including overdraft facilities and other advances granted.
Credit card debt.
Instalment sale agreements and lease agreements. Including commitments of hire purchase agreements and financial lease agreements.
Other personal loans including loans given by long-term insurers.
Non-bank loans that consist mainly of credit granted by micro-lenders.
Value is obtained indirectly from retail credit sales information.
Value is obtained from monthly returns from the banks.
Value is obtained from monthly returns from the banks.
Values are obtained from the banks and hire purchase values are obtained from the trade sector.
Values are published in the Quarterly Bulletin.
Values are obtained from the Micro Finance Regulatory Council (MFRC).
Source: Scheepers, 2013.
According to the South African Reserve Bank Annual Economic Report (SARB, 2013a), the situation with respect to household debt in 2007 is compared to the composition of household debt in 2012 and it is evident from the information reflected in Figure 2.2 that the percentage of other loans has dramatically increased. This phenomenon can also be witnessed when looking at Figure 2.1 above, as unsecured lending forms a large part of other debt. This concern expressed by stakeholders in respect of unsecured lending will be dealt with in section 2.4.
Figure 2.2: SARB’s composition of household debt: 2007 versus 2012
Source: SARB, 2013a.
When looking at the increase in other loans in Figure 2.2, it is evident that the increase is because the percentage of general loans has doubled since 2007. General loans are categorised as part of other loans, as already mentioned. In 2007, general loans contributed just over seven percent to total household debt and in 2013 it contributed 14.8 percent (SARB, 2013a).
The National Credit Regulator (NCR, 2013b) classifies household debt as presented in Table 2.2 and the definition of each of the categories is listed.
15.99% 15.69% 61.28% 67.86% 22.74% 16.45% 0% 20% 40% 60% 80% 100% 2012 2007
Instalment sale credit and leasing
Mortgage advances
Table 2.2: Compilation of household liabilities according to the NCR
Liabilities Definitions
Mortgage agreements These are agreements that are secured by a pledge of immovable property.
Secured credit These are credit transactions that do not fall into any of the other named categories but exclude mortgages and credit facilities.
Includes motor vehicle accounts, insurance-backed loans, pension-backed loans, retail furniture accounts, other durable accounts and other security.
Credit facilities Agreements that meet all the criteria set out in section 8(4) of the National Credit Act. The following are included: credit cards, garage cards, bank overdraft, service agreements, store cards and other facilities.
Unsecured credit transactions Agreements that are not secured by any pledge or personal security (other than credit facilities or short-term credit).
Short-term credit transactions This includes agreements not exceeding R8000 and that are repayable within 6 months.
Development credit transactions
Agreements included are educational loans, small business, building or expansion of low income housing, rehabilitation or any other purpose in terms of subsection (2)(a).
Sources: NCR 2013b; Author’s own.
As per the National Credit Regulator Consumer Credit Market Report for the fourth quarter in 2008 (NCR, 2008b) and the fourth quarter in 2013 (NCR, 2013b), the total outstanding gross debtors’ book on consumer credit is held according to Figure 2.3.
Figure 2.3: NCR’s composition of gross debtors’ book: Q4 2008 versus Q4 2013
Sources: NCR, 2008b & 2013b.
It is evident from Figure 2.3 that the percentage holding of mortgages has decreased considerably. This may be a result of more stringent criteria that have to be adhered to by the banking sector since 2008 (refer to Table 2.7 in section 2.4). Also, as discussed previously, there has been a surge in unsecured lending which, as the name suggests, is not backed by any collateral. In 2008, other credit agreements referred to all credit that was secured, excluding mortgages and credit facilities (NCR, 2008a), and was thus categorised the same as secured credit agreements in 2013.
Scheepers (2013:251) prepared a household statement of financial position of households which is in accordance with the requirements of the South African Institute of Chartered Accountants (SAICA) Conceptual Framework (2010a) and which classifies the classes of liabilities as non-current liabilities and current liabilities. Non-current liabilities include mortgage loans on both residential and other property (Scheepers, 2013:266) and financial liabilities which are sub-classified into financing (vehicle finance, content finance, other hire purchase agreements and cell phone contracts) and loans which include all other loan types.
0% 10% 20% 30% 40% 50% 60% 70% 80% 90% 100%
Q4 2013 Q4 2008
Mortgages Credit agreements Credit facilities Unsecured credit Short term credit Developmental credit
Current liabilities are also sub-classified into household bills, credit card debt, bank overdrafts, store cards and petrol/garage cards (Scheepers, 2013:270).
2.2.3. Summary
This section has explained the definitions of a household and household debt. The classification of liabilities by various institutions and some detail was provided on the percentages of the various debt components. The classification of liabilities, as discussed in this section, is shown in Table 2.3.
Table 2.3: Classification of liabilities
Source: Author’s own.
The various role players mentioned in this section have various debt classifications, as shown in Table 2.3. They essentially classify debt as long term or non-current and short term or current. This section has explained how the composition of debt has changed over the last few years. The aftermath of the
The System of National Accounts Long-term loans Short-term loans The International Accounting Standards Board Non-Current liabilities Current liabilities The South African Reserve Bank Mortgage advances Other debt The National Credit Regulator Mortgage agreements Secured credit Credit facilities Unsecured credit transactions Short-term credit transactions Development credit transactions Scheepers Non-current liabilities Current liabilities
financial crisis resulted in a structural change in credit composition. Section 2.4 will discuss the possible reasons for the shift in the composition of household debt over time. However, it is first necessary to deal briefly with the various measurements and indicators to determine whether the shift is problematic or not. Section 2.3 will offer detail on the various indicators that provide valuable information regarding household sector wealth but more specifically to debt uptake by households.
2.3. INDICATORS USED TO MEASURE TRENDS IN HOUSEHOLD DEBT
2.3.1. Introduction
As described in the previous section, the type of debt that households are making use of has changed over the past few years, most notably with an increase in other debt taken up, which is generally unsecured (SARB, 2014c).
Various indicators are available in South Africa that are used by stakeholders to monitor the changes that take place in household wealth and that are useful in gauging the situation of consumers with regard to household debt.
According to Heymans (2008:5) in a review of data collated and published by private and government institutions, there are close to a hundred indicators that relate to South African indebtedness. These institutions include but are not limited to the following: the South African Reserve Bank, the National Credit Regulator, Statistics South Africa, the Financial Services Board and financial institutions. The sections that follow will provide more insight into some of the indicators that have been developed to assist the stakeholders in monitoring the situation of households.
2.3.2. The South African Reserve Bank
The indicators that are sourced from the South African Reserve Bank and that are useful in this study are presented in Table 2.4 together with an explanation of their purpose. The credit market information supplied by the South African Reserve bank is considered one of the most reliable sources available in South Africa (Heymans, 2008:9).
Table 2.4: Indicators sourced from the South African Reserve Bank
Indicator Calculation Description Importance
Debt service ratio Debt-service cost divided by household
disposable income
This ratio measures the cost of servicing debt as a percentage of disposable income.
A high ratio may indicate that households are struggling to service their debts. Ratio of household debt to disposable income Household debt divided by household disposable income
This ratio indicates the extent to which household’s income levels compare to their debt levels.
A high ratio indicates that households have high debt levels compared to their disposable incomes. Sources: SARB, 2014a; Heymans, 2008; De Clercq, 2013.
The debt service ratio and the household debt to disposable income ratio described Table in 2.4 above are important in signalling the position of household debt in South Africa. These ratios are closely monitored on a quarterly basis. The movements in the debt service ratio and the household debt to disposable income ratio are illustrated in Figure 2.4.
Figure 2.4: Debt service ratio and ratio of household debt to disposable income: 1997–2013
Sources: SARB, 2014a; Author’s own.
0 10 20 30 40 50 60 70 80 90 19 97 19 98 19 99 20 00 20 01 20 02 20 03 20 04 20 05 20 06 20 07 20 08 20 09 20 10 20 11 20 12 20 13 Ratio of debt service cost to disposable income Household debt to disposable income of households %