The Evidence on Class Size
43
0
0
Full text
(2) The Evidence on Class Size. Eric A. Hanushek. Occasional Paper Number 98-1. W. Allen Wallis Institute of Political Economy University of Rochester. February 1998.
(3) Abstract. While calls to reduce class size in school have considerable popular appeal, the related discussion of the scientific evidence has been limited and highly selective. The evidence about improvements in student achievement that can be attributed to smaller classes turns out to be meager and unconvincing. In the aggregate, pupil-teacher ratios have fallen dramatically for decades, but student performance has not improved. Explanations for these aggregate trends, including more poorly prepared students and the influence of special education, are insufficient to rationalize the overall patterns. International comparisons fail to show any significant improvements from having smaller pupil-teacher ratios. Detailed econometric evidence about the determinants of student performance confirms the general lack of any achievement results from smaller classes. Finally, widely cited experimental evidence actually offers little support for general reductions in class size. In sum, while policies to reduce class size may enjoy popular political appeal, such policies are very expensive and, according to the evidence, quite ineffective.. For further information, contact: W. Allen Wallis Institute of Political Economy University of Rochester Rochester, NY 14627-0158. Copyright © 1998 W. Allen Wallis Institute of Political Economy.
(4) The Evidence on Class Size Eric A. Hanushek*. No topic in education has received the public and professional attention that class size has received. Interest in reducing class size is sweeping the country. Calls for reductions in class sizes are a rallying point for parents, teachers, and administrators across the nation, and politicians have rushed to claim credit for introducing policies aimed at reducing class sizes. The pupil-teacher ratio in a district, for example, is frequently used as the fundamental metric for quality, and comparisons across districts become indices of equity. Yet, the surprising fact is that the enormous amount of research devoted to studying class size has failed to make a very convincing case that reducing class size is likely to improve student performance. It will increase costs dramatically, but performance is another matter. A prime reason for the attention to class size is that it represents such an extremely convenient policy instrument, one amenable to general political action. A legislature or a court, wishing to alter student outcomes, can easily specify changes in class sizes – while other potential policy changes are much more difficult to effect. The rediscovery and publicizing of putative positive findings from experimental evidence (Mosteller 1995) has apparently provided sufficient scientific support so that legislators can confidently pursue politically popular programs either mandating smaller classes or providing substantial fiscal incentives for reductions. The findings of the general ineffectiveness of reducing class sizes tend to be controversial if for no other reason than they tend to defy common sense, conventional wisdom, and highly publicized accounts of the available scientific evidence. Unfortunately, in order to support calls for class size reductions, there has been a tendency to pick and choose among available studies and evidence. Therefore, it is useful to review the existing evidence and to reconcile the varying conceptions of what might be expected from class size reductions. The first section begins with what aggregate data indicate about the effectiveness of class size policies. Teachers have been used with increasing intensity throughout the 20th century, making the current push for smaller classes more of an extension of past. *. Professor of Economics and Public Policy and Director, W. Allen Wallis Institute of Political Economy, University of Rochester. This is an expanded version of a paper by the same title prepared in conjunction with the Conference on Meritocracy and Inequality, Harvard University, September 1996. Financial support was provided by the William H. Donner Foundation.. -1-.
(5) policies than something new. Over the period that student achievement data are available (the past quarter century) there are no discernible improvements in performance even though there have been large and steady declines in pupil-teacher ratios. The second section reviews international data. The countries of the world employ surprisingly different ways of running their schooling systems, including very different pupil-teacher ratios. When combined with data on student performance, however, the wide discrepancies in pupil-teacher ratios show little relationship to achievement. The third section summarizes the available extensive econometric evidence about the effectiveness of reducing class sizes. This evidence, which incorporates almost 300 different estimates of the effect of altering class size on achievement, gives no indication that general reductions in class size will yield any average improvement in student achievement. These studies, by separating out the influences of families and other school factors, effectively eliminate the primary interpretative concerns raised with the aggregate data. The lack of evidence about class size effects resulting from viewing achievement differences across individual classrooms is particularly persuasive. The fourth section turns to the evidence developed in Project STAR, an experiment conducted by the State of Tennessee in the mid1980s. This work involved direct comparisons of achievement by students randomly assigned to small (13-17 students) and large classes (21-25 students) in kindergarten through third grade. While there is some ambiguity, the overall findings suggest that small kindergartens (15 students per teacher) might improve initial learning but that additional resources in later grades did not have a significant influence on the growth in student achievement. This work and related follow-up analyses in Tennessee, summarized in Mosteller (1995), form much of the scientific basis for the current political debates. Unfortunately, most of the policy discussions go considerably beyond the experimental evidence. The final section provides possible interpretations for the lack of any results from reducing class size. It then relates the evidence to prospective educational policies.. -2-.
(6) 1. Basic Aggregate Data It is common to hear it said that “it is not surprising that achievement is what it is, given the large classes that teachers must face.” In reality it is just the history of added teachers without any commensurate increases in student achievement that makes a strong prima facie case about the ineffectiveness of class size policies. There have been consistent and dramatic falls in pupil-teacher ratios over most of the 20 century. Figure 1 displays the pattern of pupil-teacher ratios for the period 195094. Over this period the overall pupil-teacher ratio fell 35 percent. This decline is the result of steady drops in the pupil-teacher ratio at both the elementary and the secondary school level. The obvious conclusion from this is that, if there is a problem of class size today, there must have been larger problems in the past. th. Figure 1. Pupil-Teacher Ratios Overall and elementary and secondary. Pupil-teacher ratio. 32. 27. 22. 17. 12 1949-50. 1960-61. overall. 1971-72 Year elementary. -3-. 1982-83. secondary. 1993-94.
(7) Fig. 2--Instructional Staff and Other Expenditure per Student: 1890-1990. Spending/pupil (1990 $). 5000 4000 3000 2000 1000 0. 1890 1900 1910 1920 1930 1940 1950 1960 1970 1980 1990. Year Instructional Staff. Other current spending. One closely related trend is that spending per student has grown dramatically over this same period. Because the pupil-teacher ratio indicates the intensity with which school and classroom resources are applied to student education, the greater intensity translates directly into greater spending. Figure 2 displays real spending per student over the period 1890-1990. The growth in spending, after adjusting for inflation, amounts to some 3½ percent per year over the entire period. Figure 2 also splits spending per pupil into that related to salaries of instructional staff and all other spending. If we look at the growth in total instructional staff salaries, we find that 20 percent of the growth over the entire century can be attributed to increased intensity of instructional staff (Hanushek and Rivkin 1997). This percentage rises in recent periods, reaching 85 percent in the period 1970-90.1 In other words, the. 1. The change in spending over the period 1970-90 is complicated by fact that the school age population actually declined from the mid-1970s through the mid-1980s. As the population declined,. -4-.
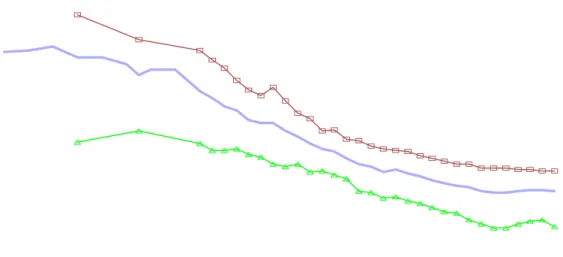
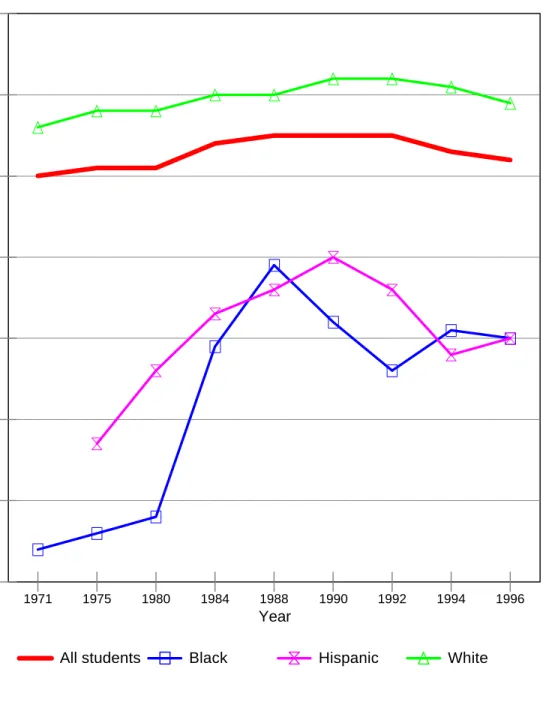
(8) reductions in pupil-teacher ratios shown in figure 1 do translate into strong effects on spending. While instructional staff salaries and other spending moved together over the long period, it is also clear from figure 2 that nonsalary spending has grown more rapidly in the past two decades. Thus, the total growth in spending per pupil is not linked in any simple, mechanical way to pupil-teacher ratios, even though increased intensity of instructional staff obviously is an important element.2 The other component of the basic aggregate picture is the pattern of student performance. While we do not have representative student achievement data over the entire century, the National Assessment of Educational Progress (NAEP) does provide data since the 1970s.3 Figures 3-5 display the patterns of NAEP scores in mathematics, science, and reading. These scores are provided for all 17-year-olds and for separate racial and ethnic groups. Three aspects stand out. First, overall performance is approximately the same in 1970 as it is in the mid1990s. While some differences in patterns exist across the subject areas, the composite picture is one of flat scores over the quarter of a century covered by testing. Second, there has been some convergence of scores between whites and either blacks or Hispanics. For the period up to 1990, the average black-white gap across subject areas narrowed by 0.4 standard deviations (Hauser and Huang 1996), even though the differences remain substantial. Third, the convergence of scores by race and ethnic groups may have stopped during the 1990s. In school systems tended to keep the same numbers of teachers, leading to a decline in the pupil-teacher ratio. With the increase in student population, however, there was no tendency for the pupil-teacher ratio to increase. For just the 1980-90 period, increased intensity of teachers accounted for 34 percent of the growth in total instructional staff spending (Hanushek and Rivkin 1997). 2. While no systematic analysis is available, it seems plausible that the increased intensity of instructional personnel is directly related to parallel increases in noninstructional personnel. At least a portion of the increase in other costs is undoubtedly attributable to various legal changes including mandates for special education (see below) and desegregation efforts. 3. A longer time series can be constructed from the Scholastic Aptitude Test (SAT), although using those data introduces some added interpretive issues. The SAT actually fell dramatically from the mid1960s until the end of the 1970s–suggesting that the achievement decline in the NAEP data neglects an earlier period of achievement fall off. The primary interpretive issue, however, revolves around the voluntary nature of the SAT and the increase in the proportion of high school seniors taking the test. The SAT is taken by a selective group of students who wish to enter competitive colleges and universities. As the proportion taking the test rises, so the hypothesis goes, an increasingly lower achieving group will be drawn into the test, leading to lower scores purely because of changes in test taking. While the exact magnitude of any such effects is uncertain, it seems clear that this change in selectivity has caused some of the SAT decline but not all of it (e.g., see Wirtz et al. 1977; Congressional Budget Office, 1986).. -5-.
(9) fact, since 1990 there has been a noticeable widening of the racial and ethnic achievement gaps not captured in the calculations above. The challenge is to reconcile the data on pupil-teacher ratios and resources with the data on student outcomes. On the surface, they suggest that increases in the intensity of teachers and the commensurate increases in spending have had minimal effect on student achievement. But a variety of explanations have been suggested to explain how these data could arise for reasons other than the general ineffectiveness of reduced class size.. -6-.
(10) Fig. 3--Mathematics Achievement (NAEP) 17-year-olds by race/ethnicity:1973-96. 320. 310. Average scale score. 300. 290. 280. 270. 260 1973. 1978. 1982. 1986. 1990. 1992. 1994. Year All students. Black. -7-. Hispanic. White. 1996.
(11) Fig. 4--Science Achievement (NAEP) 17-year-olds by race/ethnicity:1970-96. 320. Average scale score. 300. 280. 260. 240. 220 1970. 1973. 1977. 1982. 1986. 1990. 1992. 1994. Year All students. Black. Hispanic. -8-. White. 1996.
(12) Fig. 5--Reading Achievement (NAEP) 17-year-olds by race/ethnicity:1971-96. 305. 295. Average scale score. 285. 275. 265. 255. 245. 235 1971. 1975. 1980. 1984. 1988. 1990. 1992. 1994. Year All students. Black. -9-. Hispanic. White. 1996.
(13) Table 1. Changes in family characteristics, 1960-1990 1970. 1980. 1990. 14.9. 17.9. 19.9. 85. 77. 73. % high school graduate or more, population age 25-29. 73.8. 84.5. 85.7. % families with children with 3 or more children. 36.3. 22.9. 20.1. % children in poverty % children under 18 years old living with both parents. Source: U.S. Statistical Abstract, 1992. A. Changes in the student population One simple explanation for why added resources yield no apparent performance improvement is that students are more poorly prepared or motivated for school, requiring added resources just to stay even. To bolster this view, some point to the increases in children living in single-parent families and the related increases in child poverty rates–both of which are hypothesized to lead to lower student achievement. Table 1 displays these major changes. Between 1970 and 1990, children living in poverty families rose from 14.9 to 19.9 percent, while children living with both parents declined from 85 to 73 percent. But, there have also been other trends that appear to be positive forces on student achievement. As Table 1 also shows, family sizes have fallen, and parental education levels have improved. Over the same period, adults aged 25-29 with a high school or greater level of schooling went from 74 to 86 percent (up from 61 percent in 1960). Moreover, among all families with children, the percentage with three or more children fell from 36 to 20 percent. It is difficult to know how to net out these opposing trends with any accuracy. Extensive research, beginning with the Coleman Report (Coleman et al. 1966) and continuing through today (Hanushek 1997), has demonstrated that differences in families are very important for student achievement. Most of these studies have not focused their primary attention on families, however, and thus have not delved very far into the measurement and structure of any family influences. Instead, it appears that most have been willing to employ whatever measure of family structure or socio-economic status -10-.
(14) might be available. Mayer (1997) suggests that the direct causal impact of family income might be fairly small and that the past works have more identified associations than true causal impacts. This analysis, nonetheless, cannot conclusively indicate whether or not there have been trends in the underlying causal factors (that are correlated in crosssections with income). Hanushek (1992) indicates that family size may have particularly powerful effects on achievement and indeed may be partly responsible for the narrowing in black-white achievement indicated in Figures 2-4, but again it is difficult to compare the influence of the various trends that have been identified. Grissmer et al. (1994) attempts to sort out the various factors. That analysis uses econometric techniques to estimate how various family factors influence children’s achievement. It then applies these cross-sectionally estimated regression coefficients as weights to the trended family background factors identified above. Their overall findings are that black students performed better over time than would be expected from the trends in black family factors. They attribute this better performance to improvements in schools. On the other hand, white students performed worse over time than would expected, leading presumably to the opposite conclusion that schools for the majority of students actually got worse over time. There are again reasons to be skeptical about these results. First, they do not observe or measure differences in schools but instead simply attribute unexplained residual differences in the predicted and observed trends to school factors. In reality any factor that affects achievement, that is unmeasured, and that has changed over their analysis period would be mixed with any school effects. Second, in estimating the crosssectional models that provide the weights for the trending family factors, no direct measures of school inputs are included. In the standard analysis of misspecified econometric models, this omission will lead to biased estimates of the influence of family factors if school factors are correlated with the included family factors in the crosssectional data that underlie their estimation. For example, better educated parents might systematically tend to place their children in better schools. In this simple example, a portion of the effects of schools will be incorrectly attributed to the education of parents.2 Such biased estimates will lead to inappropriate weights for the trended family inputs and will limit the ability to infer anything about the true changes in student inputs over time. Third, one must believe either that the factors identified are the true causal influences (cf. Mayer 1997) or that they maintain a constant relationship with the true causal influences.. 2. While it is sometimes possible to ascertain how such statistical misspecification affects the estimated results, the complications here – with multiple factors omitted from the modeling of achievement – make that impossible.. -11-.
(15) In sum, a variety of changes in family inputs has occurred over time, making it possible that a portion of the increased school resources has gone to offset adverse factors. The evidence is nonetheless quite inconclusive about even the direction of any trend effects, let alone the magnitude. At the same time, the only available quantitative estimates indicate that changing family effects are unable to offset the large observed changes in pupil-teacher ratios and school resources. Indeed, for the nation as a whole, these trends are estimated to have worked in the opposite direction, making the performance of schools appear better than it was. Thus, the most frequently given explanation for the perceived ineffectiveness of historic resource policies does not resolve the puzzle.. B. Special Education and the Changing Structure of Schools The discussion until now has focused on pupil-teacher ratios, but pupil-teacher ratios are not the same as class sizes. These data on pupil-teacher ratios reflect the total number of teachers and the total number of students at anytime, not the utilization of these. Take a trivial example. Consider a district that only has two teachers, one of whom spends all day in class with the available students and the other of whom is department head and spends all day evaluating the lesson plans of the classroom teacher. In this case, the pupil-teacher ratio is half that of the class size seen by students. More to the point, if teachers are required to meet fewer classes during the day than the number of classes each student takes, the pupil-teacher ratio will again be less than the average class size. Thus, many people correctly note that typical class sizes observed in schools tend to be larger than the measured pupil-teacher ratio. The only data that are available over time reflect pupil-teacher ratios. This situation is quite natural, because reporting on actual class sizes requires surveying individual districts about their assignment practices. It is not sufficient to have just the readily available data about numbers of teachers and students. Moreover, class sizes will be influenced by the range of choices given to students and the number of separate courses that individual students are taking. The conceptual ideal behind any measurement is itself not well defined because measuring the actual class sizes faced by students requires a variety of decisions about which classes to count and which not to count. For example, should physical education courses be counted? driver’s education? and so forth. This discussion is not meant to imply that we would not like to have data about the varying aspects of schools that influence assignments and class sizes. It merely provides an explanation for why class size data have never been readily available. Having described the differences, however, it remains to be seen how large the influence of any divergence of class size and pupil-teacher ratios might be on the -12-.
(16) aggregate trends previously discussed. In order to influence the trends (as opposed to the observed level during any period), it must be the case that the relationship between pupilteacher ratios and class sizes is changing over time. While this relationship could change for a variety of reasons from altered work days for teachers to expanded curricular offerings, one possible influence – the increased emphasis on special education – has received the most attention. The growth in students with identified handicaps coupled with legal requirements for providing educational services for them has increased the size of the special education sector. Therefore, the expansion of the more staff-intensive special education sector could reduce the overall pupil-teacher ratio without commensurate decreases in regular class sizes. To the extent that mandated programming for handicapped students is driving the fall in the pupil-teacher ratio, regular class sizes may not be declining and, by extension, one might not expect any improvement in measured student performance.3 This section, which draws on the Hanushek and Rivkin (1997) analysis, provides a simple analysis of the potential importance of special education in explaining the pupil-teacher ratio fall and commensurate increase in educational expenditure. Concerns about the education of children with both physical and mental disabilities were translated into federal law with the enactment of the Individuals With Disabilities Education Act (IDEA) in1976.4 This Act prescribed a series of diagnostics, counseling activities, and services to be provided for handicapped students. To implement this and subsequent laws and regulations, school systems expanded staff and programs, developing entirely new administrative structures in many cases. The general thrust of the educational services has been to provide regular classroom instruction where possible ("mainstreaming") along with specialized instruction to deal with specific needs. The existence of partial categorical funding from outside and of intensive instruction for individual students creates incentives for school systems to expand the population of identified special education students and incentives for parents to seek admission of their children into special education programs (see Hartman[1980], Monk[1990]). The result has been growth of students classified as special education students even as the total student population was falling.. 3. While little evidence is available, it is frequently asserted that special education students are not generally included in tests and other measures of performance. Therefore, in assessing performance, it would be appropriate to link expenditure on regular-instruction students with their test performance. On the performance side, however, if a larger proportion of students are identified as special education and if these are generally students who would perform poorly on tests, the shift to increased special education over time should lead to general increases in test scores ceteris paribus. 4. The Act, P.L. 94-142, was originally titled the Education for All Handicapped Children Act.. -13-.
(17) The aggregate changes between 1978 and 1990 in the population identified as disabled is shown in Table 2.5 Despite the fact that overall public school enrollment declines by over 1.5 million students between 1980 and 1990, the number of students classified as disabled increases from 4.0 million in 1980 to 4.7 million in 1990. Therefore the percentage of students classified as disabled increases from 9.7 to 11.6 percent during this period. Moreover, the number of special education teachers increases much more rapidly than the number of children classified as disabled. Table 2 shows that the number of special education teachers and other instructional staff increases by over 50 percent between 1978 and 1990;6 special education teachers rise from 195,000 to 308,000 while other special education instructional personnel (including teacher aides) rise from 140,000 to 220,000. Noninstructional special education staff, while rising before 1980, remains roughly constant during the 1980s. These numbers suggest that the previously noted decline in the pupil-teacher and pupil-staff ratios during the 1980s might have been due to a growth in the number of students receiving special education services and to an increase in the intensity of special education (i.e., a decrease in the effective pupil-teacher ratio for special education). While it is not possible to calculate directly special education intensity (since many of the students classified as disabled attend regular classes for much of the day), the maximum impact of the special education changes on overall pupil-teacher and -staff ratios can be estimated. Specifically, by assuming historic values for special education students, instructional staff, and classroom teachers, we can roughly approximate the impact of the growth in special education on the overall ratios.. 5. Data on special education comes from annual reports required as part of the Individuals With Disabilities Education Act of 1976. Prior to this Act, no consistent data on handicapped students or their schooling are available. 6. Precise accounting for special education personnel is frequently difficult, suggesting that these data contain more error than the other aggregate data presented.. -14-.
(18) Table 2. Special Education Population and School Personnel: 1980-1990. Disabled Children (age 0-21 years) [1,000s]. Percentage of ElementarySecondary Students. Teachers. Other Instructional. Noninstructional. 1978. 3,777. 8.7. 195. 140. 32. 1979. 3,919. 9.2. 203. 178. 37. 1980. 4,036. 9.7. 221. 159. 56. 1981. 4,178. 10.2. 233. 167. 40. 1982. 4,233. 10.6. 235. 168. 46. 1983. 4,298. 10.9. 241. 168. 57. 1984. 4,341. 11.1. 248. 173. 53. 1985. 4,363. 11.1. 275. 172. 54. 1986. 4,370. 11.1. 292. 183. 47. 1987. 4,422. 11.1. 296. 175. 48. 1988. 4,494. 11.2. 301. 192. 49. 1989. 4,587. 11.4. 303. 208. 48. 1990. 4,688. 11.6. 308. 220. 53. Year. Source:. Special Education Personnel [1,000s]. U.S. Department of Education, To Assure the Free Appropriate Public Education of All Children with Disabilities, Thirteenth Annual Report to Congress on the Implementation of the Individuals with Disabilities Education Act, 1991, p. 4, for student numbers and various individual annual reports for teachers and other personnel.. -15-.
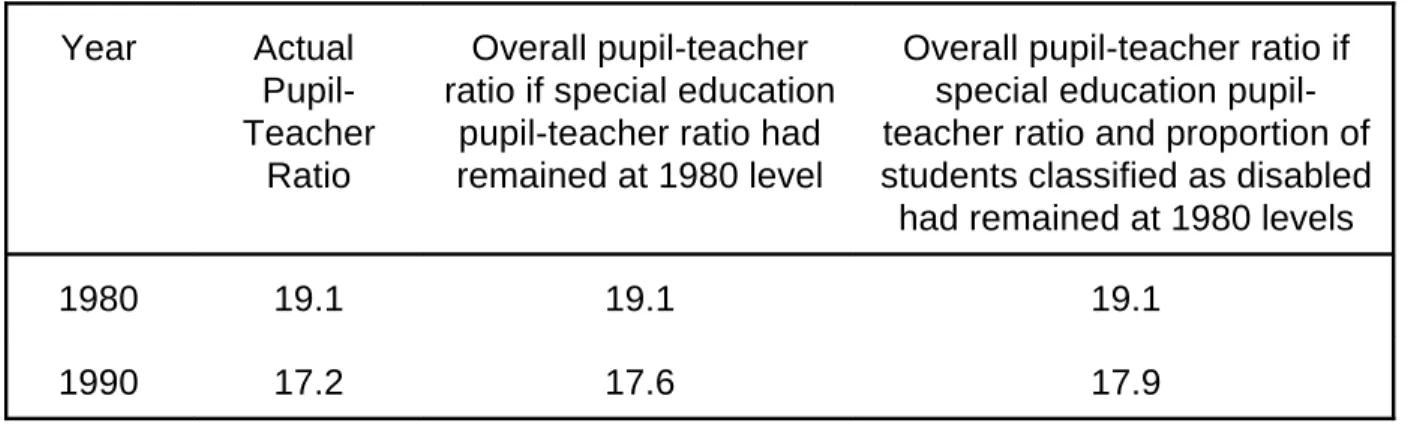
(19) Table 3. Estimated Effects of Changes in Special Education on Pupil-Teacher Ratios: 1980-1990. Year. Actual PupilTeacher Ratio. Overall pupil-teacher ratio if special education pupil-teacher ratio had remained at 1980 level. Overall pupil-teacher ratio if special education pupilteacher ratio and proportion of students classified as disabled had remained at 1980 levels. 1980. 19.1. 19.1. 19.1. 1990. 17.2. 17.6. 17.9. As shown in Table 3, the actual pupil-teacher ratio counting all students and teachers for the years 1980 and 1990 falls from 19.1 to 17.2—a decline of ten percent. The third column estimates what the overall pupil-teacher ratio would have been in 1990 if the observed special education pupil-teacher ratio had remained at its 1980 level instead of falling. The last column shows what the 1990 pupil-teacher ratio would have been if, additionally, the proportion of students classified as disabled would have remained at the 1980 level instead of climbing as it did. The simulations indicate that most of the fall in the pupil-teacher ratio during this period was not caused by the expansion of special education. If the proportion of students classified as disabled and the observed special education pupil-teacher ratio had remained constant, the aggregate pupil-teacher ratio would have fallen at least to 17.9. In other words, by these calculations just over one third of the fall in the pupil-teacher ratio could possibly be attributed to increases in special education. These calculations are designed to investigate how large the effect of special education could be on pupil-teacher and pupil-staff ratios. The overall conclusion is that special education could have had a significant effect, but that much more has also been going on during recent times. In terms of the basic issue of flat student performance over recent decades, it is also clear that this remains a puzzle with respect to resources and class sizes, because there have been clear increases in resources available for those in regular classrooms.. -16-.
(20) C. Black-White Differentials An alternative interpretation of the trends follows the observation that there has been a noticeable narrowing of the racial gap in NAEP performance, particularly during the 1980s. A variety of commentators have taken this as evidence that school resources have an important effect. They point in particular to the increase in federal compensatory programs during the 1970s and 1980s, including Title 1 and Head Start. By this argument, since these programs were aimed at disadvantaged students and since blacks and Hispanics are disproportionately disadvantaged, the narrowing of the differential merely reflects the importance of resources. One problem with this argument is, however, the magnitude of specific programs for the disadvantaged. At the federal level, where people employing this argument generally point, compensatory education spending amounted to just $7 billion in 1995. These programs go to poor students of all race and ethnic groups, so they do not just help racial and ethnic minorities. Moreover, the amount is relatively small, compared to total spending on elementary and secondary schools of over $300 billion.7 Cook and Evans (1996) analyze the black-white achievement differential using the panel of NAEP data. They attempt to decompose the differences in performance into family, school and other factors. Their analysis indicates that school resources and specific school-wide factors cannot account for the narrowing of the gap. In related analysis, Grogger (1996) analyzes the effects of specific school resources on black-white differences in earnings. He also concludes that school resources have not had a significant effect on these differences. Furthermore, there is no indication that pupilteacher ratios have a significant effect on subsequent earnings by students. Again, while there is some surface plausibility to the general arguments, detailed analysis does not confirm them. D. Summary of Aggregate Trends The available evidence and data suggest some uncertainty about the underlying forces related to families, school organization, class size, and achievement. Allowing for changes in family background and in special education, however, it remains difficult to make a case for reduced class sizes from the aggregate data. A natural experiment in. 7. The federal government has other relevant programs: Head Start added $3.5 billion, and child nutrition was $7.6 billion. Such expenditures, even if included in the totals for elementary and secondary spending, still yield small relative total spending.. -17-.
(21) class size reduction has been on-going for a long period of time, and overall achievement data do not suggest that it has been a productive policy to pursue. Nonetheless, the aggregate data are quite limited, restricted to a small number of performance observations over time and providing limited information about other fundamental changes that might affect school success. Therefore, it is useful to turn to other evidence, including more detailed, school-level information.. 2. International Evidence Somewhat surprisingly, similar kinds of results are found if one looks across countries at the relationship between pupil-teacher ratios and student performance. While it is clearly difficult to develop standardized data across countries, to control for the many differences in populations and schools, and the like, there remains some appeal in looking across countries. The variations in class sizes and pupil-teacher ratios are larger than found within the U.S., leading to some hope that the effects of alternative intensities of teacher usage can be better understood. Even given the wide differences, there is no evidence that lower pupil-teacher ratios systematically lead to increased performance. During 1995, the Third International Mathematics and Science Study (TIMSS) was conducted. A series of mathematics and science tests were given to a group of voluntarily participating nations. As a simple exercise, the 8th grade math and science scores can be correlated with the primary school pupil-teacher ratio in each country.8 For the 17 nations with consistent test and pupil-teacher ratio data, there is a positive relationship between pupil-teacher ratio and test scores, and it is statistically significant at the 10 percent level for both tests. The statistical significance does go away but the positive result remains when Korea, the sampled country with the largest pupil-teacher ratio, is left out of the analysis. Nonetheless, international evidence points to a surprising result that performance is better when there is less intensive use of teachers, even though there is not much confidence that such differences are more than statistical artifacts. A more systematic attempt to investigate the relationship between student performance and pupil-teacher ratios uses the six prior international tests in math or science given between 1960 and 1990 (Hanushek and Kim, 1996). This analysis, which utilizes 70 country-test specific observations of test performance, finds a positive but statistically insignificant effect of pupil-teacher ratios on performance after allowing for. 8. Test scores are reported in Beaton et al. (1996a, 1996b). Primary pupil-teacher ratios for public and private schools are found in OECD (1996).. -18-.
(22) differences in parental schooling. Again, while there are very large differences in pupilteacher ratios, they do not show up as significantly influencing student performance.9 Finally, while uniform data are not available on class size differences, some intensive investigations have shown that class size differences vary more internationally than pupil-teacher ratios. Specifically, Japan and the United States have quite similar pupil-teacher ratios, but, because of choices in how to organize schools and to use teachers, Japanese class sizes are much larger than U.S. class sizes (Stevenson and Stigler, 1992). Japanese student performance is on average much better than U.S. student performance. Of course, there are many differences in the schooling and societies of the sampled nations, so it would be inappropriate to make too much of these results. They do, however, underscore further that the normal presumptions about the achievement effects of pupil-teacher ratios and class size are not found in the evidence.. 3. Econometric Evidence The most extensive information about the effects of class size comes from attempts to estimate input-output, or production functions, for schools. The investigation of the effects of school resources began in earnest with the publication of the “Coleman Report” (Coleman et al., 1966). This Congressionally mandated study by the U.S. Office of Education startled many by suggesting that schools did not exert a very powerful influence on student achievement. Subsequent attention was directed both at understanding the analysis of the Coleman Report10 and at providing additional evidence about the effects of resources. Over the past thirty years, a steady stream of analyses has built up a consistent picture of the educational process. This summary concentrates on a set of published results available through 1994,11 as described in greater detail in Hanushek (1997). The. 9. At the same time, differences in test performance are extraordinarily important in determining differences in national growth rates (Hanushek and Kim, 1996). 10. These analyses suggested serious flaws in the statistical methodology and interpretation of the Coleman Report, but most of those discussions is not relevant for this discussion. See Bowles and Levin (1968), Cain and Watts (1970), Hanushek and Kain(1972). 11. The tabulations do include results in Hanushek, Rivkin, and Taylor (1996), since this updating was conducted as part of that research. Some analyses have subsequently been published but including their results will not affect the overall conclusions here (see Hanushek, 1997).. -19-.
(23) basic studies include all available that meet minimal criteria for analytical design and reporting of results.12 The summary relies on all of the separate estimates of the effects of resources on student performance. For tabulation purposes, a "study" is a separate estimate of an educational production function found in the literature. Individual published analyses typically contain more than one set of estimates, distinguished by different measures of student performance, by different grade levels, and frequently by entirely different sampling designs. If, however, a publication includes estimates of alternative specifications employing the same sample and performance measures, only one of the alternative estimates is included.13 Thus, the 90 individual publications that form the basis for this analysis contain 377 separate production function estimates. While a large number of studies were produced as a more or less immediate reaction to the Coleman Report, half of the available studies have been published since 1985. These econometric estimates relate class size or teacher intensity to measures of student performance, while also allowing for the influence of family and other inputs into education. The precise sampling, specification of the relationships, measurement of student performance, and estimation techniques differ across studies but here I concentrate on just the summary of any relationship across studies. To do this, studies. 12. Specifically, the studies must be published in a book or journal (to ensure a minimal quality standard); must include some measure of family background in addition to at least one measure of resources devoted to schools; and must provide information about statistical reliability of the estimate of how resources affect student performance. 13. Some judgment is required in selecting from among the alternative specifications. As a general rule, the tabulated results reflect the estimates that are emphasized by the authors of the underlying papers. In some cases, this rule did not lead to a clear choice, at which time the tabulation emphasized statistically significant results among the alternatives preferred by the original author. An alternative approach is followed by Betts (1996). He aggregates all of the separate estimates of a common parameter that are presented in each individual paper.. -20-.
(24) Table 4.. Percentage Distribution of Estimated Influence of Teacher-pupil on Student Performance, By Level of Schooling. Statistically significant. Statistically insignificant. number of estimates. Positive. Negative. Positive. Negative. Unknown sign. All schools. 277. 15%. 13%. 27%. 25%. 20%. Elementary schools. 136. 13. 20. 25. 20. 23. Secondary schools. 141. 17. 7. 28. 31. 17. School level. are aggregated according to the estimated sign and statistical significance of the relationship.14 Table 4 summarizes the available results for estimates of the effects of teacherpupil ratios on student outcomes. Of the total of 377 available econometric studies of the determinants of student performance, 277 consider teacher-pupil ratios. (Estimates of the effect of class size or pupil-teacher ratios are reversed in sign so that conventional wisdom would call for a positive effect in all cases). The top row of the table shows that just 15 percent of all studies find a positive and statistically significant relationship between teacher intensity and student performance–the expected result if class size systematically matters. At the same time, 13 percent of all studies have negative and statistically significant relationships with student performance. Ignoring the statistical significance, or the confidence that we have that there is any true relationship, we find that the estimates are almost equally divided between those suggesting that small classes. 14. More details about the methodology and the available studies can be found in Hanushek (1979, 1997). Some controversy also exists about the best way to summarize the results of different studies, but these issues have little bearing on the discussions here; see Greenwald, Hedges, and Laine (1996) and Hanushek (1996a, 1997). Other discussions and controversies about the estimation strategies can be found in Card and Krueger (1996), Heckman, Layne-Farrar, and Todd (1996), and Hanushek (1996b). The issues raised in those latter discussions, while relevant to some of the considerations here, are very technical and, in my opinion, do not affect the policy conclusions here.. -21-.
(25) are better and those suggesting that they are worse.15 This distribution of results is what one would expect if there was no systematic relationship between class size and student performance. Fully 85 percent of the studies suggest either that fewer teachers per student are better (i.e., yield negative estimates) or that there is less confidence than usually required that there is any relationship at all (i.e., are statistically insignificant). The table also shows the results divided by level of schooling. Some people have suggested that the effect of class size may differ by point in the schooling process (including the interpretation of the STAR study discussed below). The initial summary looks across all grades and could mask differences between earlier and later schooling. To consider this possibility, the overall estimates of the effects of teacher-pupil ratios are divided into elementary and secondary schools. As Table 4 shows, there is little difference between the estimated effects in elementary and in secondary schools, but, if anything, there is less support for increasing teacher-pupil ratios at the elementary level. For elementary schools, more estimated effects (both for all studies and for ones with statistically significant estimates) are negative as opposed to positive; i.e., indicate that smaller classes are worse. There are, nonetheless, too few studies to permit looking at individual grades as opposed to all elementary grades combined. Returning to the prior discussion, these estimates do contain a mixture of studies that explicitly measure class size (or the teacher-pupil ratio for specific classes) and those that contain aggregate measures of teacher-pupil ratios for a school, district, or state. In fact, studies that investigate performance within individual classrooms invariably measure class size, while those at higher levels of aggregation most often measure average teacher-pupil ratios. In particular, studies that are highly aggregated, such as those investigating performance across entire districts or entire states, are almost always forced to consider just the overall teacher-pupil ratio. Table 5 displays the results of estimates according to the level of aggregation of the teacher-pupil measure. As the table shows, analyses conducted at the state or district level are more likely to indicate that teacherpupil ratios have a positive and statistically significant relationship with student performance. Nonetheless, while this pattern coincides with the less precise measure of class size at the class room level, the pattern is more likely to come from other fundamental analytical problems than from the pure measurement issues. As described in Hanushek, Rivkin, and Taylor (1996), the more aggregated. 15. Twenty percent of the studies do not report the sign of any estimated relationship. Instead, they simply note that the estimates were statistically insignificant.. -22-.
(26) Table 5.. Aggregation. Percentage Distribution of Estimated Effect of Teacher-Pupil Ratio on Student Performance by Level of Aggregation of the Resource measures number of estimates. Statistically significant. Statistically insignificant. Positive. Negative. Positive. Negative. Unknown sign. 277. 15%. 13%. 27%. 25%. 20%. Classroom. 77. 12. 8. 18. 26. 36. School. 128. 10. 17. 26. 28. 19. District. 56. 21. 16. 39. 20. 4. County. 5. 0. 0. 40. 40. 20. State. 11. 64. 0. 27. 9. 0. Total. analyses are subject to a series of specification problems (independent of the ones considered here) that are exacerbated by the aggregation of the analysis. In particular, the more aggregated analyses leave out all consideration of state-by-state differences in school policies, and this appears to bias the results toward finding stronger effects of teacher-pupil ratios and school resources in general. At a minimum, we can conclude that the insignificance of the results appears real and is not just an artifact of measuring teacher-pupil ratios instead of actual class size. The best studies with the most precise measurement of class size and school resources arrive at the same general conclusions, indicating that the results are not easily explained away by poor research methods. One type of statistical investigation—those employing a value-added specification—is generally regarded as being conceptually superior and likely to provide the most reliable estimates of education production functions. These studies relate an individual’s current performance to the student’s performance at some prior time and to the school and family inputs during this intervening time. The superiority of this approach comes from the use of prior achievement to ameliorate any problems arising from missing data about past school and family factors and from differences in innate abilities of students (Hanushek 1979).. -23-.
(27) Table 6.. Percentage Distribution of Other Estimated Influences of Teacher-Pupil ratio on Student Performance, Based on Valueadded Models of Individual Student Performance. Statistically significant. Statistically insignificant. number of estimates. Positive. Negative. Positive. Negative. Unknown sign. All valueadded studies. 78. 12%. 8%. 21%. 26%. 35%. Studies within a single state. 23. 4. 13. 30. 39. 13. Resources. Table 6 provides a summary of value-added results, both for all 78 separate estimates of class-size effects and for the 23 estimates that come from samples in a single state. Clearly, the number of these estimates is very much reduced from the overall set that is available, and thus any conclusions are subject to more uncertainty just due to limited number of underlying investigations. On the other hand, because of the superiority of these analyses, each study deserves more weight than one of the general studies reviewed previously. The restriction to samples within single states corrects for differences in state school policies to avoid the biases previously discussed. There is simply little reason from the results in table 6 to believe that smaller classes systematically lead to improvements in student achievement. Of the best available studies (single-state, value-added studies of individual classroom achievement), only one out of 23 (4 percent) shows smaller classes to have a statistically significant positive effect on student performance. As pointed out by Krueger (1997), if the effects of class size on performance are small, a number of the reported econometric studies may simply not have adequate data to distinguish between “small effect” and “no effect”–leading to the pattern of statistically insignificant results reported. Preliminary analysis of achievement data for several entire cohorts of students in the State of Texas provides partial support for this hypothesis (Rivkin, Hanushek, and Kain, 1998). With over 300,000 observations of gains in student performance across the schools of Texas, statistically significant positive results are found for smaller classes in fourth and fifth grade mathematics and reading. -24-.
(28) performance.16 Even with such large samples, however, class size is a statistically insignificant determinant of sixth grade performance in either subject. More importantly, the estimated magnitudes are very small. A class size reduction of 10 students, which approximately cuts average class size in half and represents a 2½ standard deviation movement, is never estimated to yield more than 0.12 standard deviations improvement in student achievement for the results that are statistically significant. When results are separated for students eligible for free or reduced lunches, the performance of disadvantaged students is found to be more sensitive to class size: A 10 student reduction in class size reductions could yield as much as 0.19 standard deviations (in fifth grade math performance). Estimated class size effects for students ineligible for free or reduced lunch are, however, less than half the size of those for disadvantaged students and are more frequently insignificant. A final set of questions about the econometric studies of teacher-pupil ratios involves the underlying mechanism for establishing small and large classes. If, for example, a school district used a subjective method of assigning “weaker” students to small classes and “stronger” students to large classes, the econometric methods might not provide an accurate assessment of the direct, causal influence of class size. One example of a correction for this is Hoxby (1996), which employs other information about the source of class size decisions in order to correct for any such problems. When this is done, class size still has no consistent effect on student outcomes.17 The econometric evidence is clear. There is little reason to believe that smaller class sizes systematically yield higher student achievement. While some studies point in that direction, an almost equal number point in the opposite direction. Moreover, restricting attention to the best of these studies, including those with the most accurate measurement of individual class sizes, merely strengthens the overall conclusion. 16. The analysis of student performance employs a complicated statistical analysis (regression of differences in achievement growth) in order to eliminate both unmeasured individual ability differences and the potential effects of student selection into specific schools. The small results reported here are also consistent across alternative estimation strategies based on simple models of achievement growth. 17. Note, moreover, that this problem arises only when decisions are made on the basis of unmeasured student characteristics. If, for example, students are assigned to specific classes on the basis of their early test scores and if these test scores are controlled for in the econometric analysis as in the value-added estimation, these problems do not arise. The statistical analysis in Rivkin, Hanushek, and Kain (1998) provides an alternative approach to the selection problems. One other attempt to correct for possible influences of school decision making does find significant class size effects (Angrist and Lavy, 1996). This study considers special features of Israeli law which permit alternative statistical approaches to identifying small class effects. Its applicability to U.S. schools is unclear.. -25-.
(29) 4. The STAR Experiment In the mid1980s, because of ambiguity about the effects of class size on student performance, the State of Tennessee launched a random-assignment experiment in reducing class sizes (Word et al., 1990; Finn et al, 1990; Finn and Achilles, 1990). The design was heavily influenced by an early summary of research by Glass and Smith (1979). That latter study combined the evidence from different experimental studies and suggested that student achievement was roughly constant across class sizes until the class size got down to approximately 15-to-1. After 15-to-1, reductions in class size appeared to yield significant gains in student performance. Based on this and a desire to find ways of improving student performance, the Tennessee legislature mandated an experimental study of the effects of class size on student achievement. The result, Project STAR, is a large and complicated experiment. Beginning in 1985, a group of kindergarten through third graders in Tennessee was randomly assigned to either regular classes (22-24 students) or small classes (14-16 students). The regular classes were broken into two groups, one with teacher aides and one without aides. To be eligible for participating in the experiment, a school also had to be large enough so as to ensure that there was at least one small and one large class of each type. Students placed in small classes remained in these classes from kindergarten through third grade and were followed over time as they progressed through the grades. Over 7,000 students in 79 different schools participated in the program. A variety of natural and design factors, discussed below, introduce uncertainty into the analysis and interpretation of the results. Nonetheless, without going into any controversies, it is clear that many popular interpretations of the STAR results are not supported by the basic data. The basic STAR data indicate that there are at best very specific and limited achievement effects that might follow from class size reductions. Figures 6 and 7 present a graphical display of the basic achievement results of the STAR program. These figures plot average reading and math scores through the grades of the program for students randomly assigned to the three different classroom situations (Word et al., 1990).18 Three facts are immediately obvious from these charts.. 18. A series of different tests were given. The figures report on the results from the nationallynormed Stanford Achievement Test. Using data from the alternative criterion-referenced tests would not change the patterns or conclusions.. -26-.
(30) •. First, for both reading and mathematics, students in small classes have significantly greater average achievement at the end of kindergarten.19. •. Second, on average students in regular classes and in regular classes with aides perform virtually the same throughout the experiment.. •. Third, the kindergarten gap between small and regular classrooms is maintained at essentially the same level through the first, second, and third grades.. The original analyses of the experiment separately reported the differences in performance between the small and regular classes at each grade, giving the impression that the added classroom resources in each grade from kindergarten through third led to significant gains in achievement in each grade. This interpretation was reinforced by the widely cited review of the study’s findings by Harvard statistician Frederick Mosteller (Mosteller 1995). For example, “After four years, it was clear that smaller classes did produce substantial improvement in early learning and cognitive studies ...” (Mosteller, 1995, p. 113). In reality, the differences were clear in kindergarten and simply reappeared in subsequent years. The key to interpretation for policy purposes revolves around expectations about student performance over time. Perhaps the most standard interpretation from learning theory begins with the view that education is a cumulative process, building on past achievement. From this view, if students learn certain skills in the first grade, they tend to carry over to later grades, albeit possibly with some depreciation. According to this view, the basic evidence of the STAR study suggests that smaller classes may be important at kindergarten but have no average effect subsequently. Specifically, since the growth in achievement across experimental and control students is the same from first through third grade, the added resources of the smaller classes appear to add nothing to student performance. Early differences simply remain the same over time. If resources had a continuing impact, we should observe a widening of achievement as more and more resources are applied.. 19. A series of questions about the effects of initial randomization, of sample attrition, and of student mobility do remain. Unfortunately, the data from the STAR experiment have not been made generally available to researchers, so the analysis and interpretation of the results must rely on just the published reports of the original researchers.. -27-.
(31) Figure 6. Project STAR results Stanford Achievement Test -- reading 650. SAT test score. 600. 550. 500. 450. 400 K. 1. 2. 3. Grade small class. regular class. regular + aide. Figure 7. Project STAR results Stanford Achievement Test -- math 650. SAT test score. 600. 550. 500. 450. K. 1. 2. 3. Grade small class. regular class. -28-. regular + aide.
(32) Some have argued that the observed pattern could be consistent with small classes making a difference in all grades if students are expected to fall back to a common mean performance each year. This is equivalent to a view that educational performance is not cumulative. Under this set of expectations, maintaining the difference in performance at the end of kindergarten requires continuing infusion of additional resources–and lowered class size might be effective if it stemmed the ‘inevitable’ reversion of achievement to lower levels if the resources were removed. Such interpretations are most common when discussing the education of disadvantaged students, since that view is one common (but largely untested) way of explaining achievement reversions from initial gains in Head Start and other early childhood programs for disadvantaged children. (At the same time, it is important to remember that Project STAR was not a program for disadvantaged students but instead for the broad spectrum of Tennessee children. Therefore, interpretation of the results must be consistent with underlying notions of the learning process for all children, not just the disadvantaged). The way to identify the effects of class size in the presence of these alternative interpretations would be to assign some of the experimental children to larger classes after they had been in small classes in the earliest grades. Unfortunately, this was not done within the experiment. However, follow-ups of the STAR students after they had returned to regular class settings provide important information. The Lasting Benefits Study, which has traced students after the end of the STAR experiment, showed that students from the small K-3 classes maintained most of the prior differences through the sixth grade (Nye et al., 1993). Comparisons of small versus regular classrooms yielded effect sizes on the norm-referenced third grade tests of 0.24 and 0.21 for reading and math, respectively (Word et al., 1990).20 In the sixth grade, three years after the end of any differential resources for the two groups, the effect sizes for comparisons of students previously in small versus regular classrooms were 0.21 and 0.16 for reading and math, respectively (Nye et al., 1993). In other words, the differentials in performance found at kindergarten remain essentially unchanged by third grade after class size reductions of one-third were continuously applied (see figures 6 and 7) and remain largely unchanged by sixth grade after class size returned to its prior levels for another three years. This latter finding leads to rejection of the fall-back model and indicates that class size reductions after kindergarten have little potential effect on achievement. A third interpretation–which helps to reconcile the basic data–is that small classes, particularly if they occur early in the schooling process, have a one-time effect on student performance that is not linked to the acquisition of cognitive skills per se. This one time. 20. Effect sizes indicate the differences in average performance for the two groups measured in units of standard deviations of the test; see Mosteller, 1995.. -29-.
(33) effect could reflect early training in the “activity of school.” Students in small classes, by this view, learn the norms, behavior, and learning patterns that are useful in subsequent years, so that they are able to continue achieving at a higher level.21 In fact, this last interpretation is the one most consistent with the STAR data (ignoring the other possibilities of flaws in the underlying experimental design and data collection). It provides a parsimonious explanation of why there is a one-time but lasting effect of class size reductions in kindergarten. But, this interpretation also has powerful implications for any policy discussions. The most expansive conclusion that can be reached from Project STAR and the Lasting Benefits Study is that they might support an expectation of positive achievement effects from moving toward small kindergartens, and maybe small first grades. None of the STAR data support a wholesale reduction of class sizes across grades in schools. The achievement results also come from large reductions (one-third of the existing regular class sizes) that take the small classes to quite low levels compared to most existing situations (15 students per class). It does not provide evidence about what might happen with smaller changes that take class sizes down from the current levels to levels above the Tennessee experiment, say, to 18-20 students. (Remember that the original motivation for Project STAR involved research results suggesting no effects for class sizes above 15to-1). This policy interpretation is quite different from that commonly attributed to the STAR analysis, which many cite when they wish to justify any sort of reduction in class size at any grade in school. Project STAR and related programs do support one aspect of the econometric results from Texas that were mentioned previously: Disadvantaged students appear more sensitive to class size variations than the majority of students (Mosteller, 1995). Again, however, disadvantaged students on average are not currently in larger classes than more advantaged students, and the effects appear small relative to costs of programs and alternative policy approaches. As mentioned, some aspects of the experimental design introduce additional uncertainty into the analysis. The most important concerns are: 1) that not all students 21. In fact, Krueger (1997) employs the STAR data for a re-analysis and finds that there is a large “first-year” effect but little continuing effect from reduced class size, supporting this last view. Krueger’s results are slightly different from the simple graphs, because he incorporates the fact that some students begin with small classes in the first grade and not just in kindergarten. If students were not in small kindergartens, he suggests that they can achieve gains from small classes in the first grade, i.e., their first year with small classes.. -30-.
(34) started the experiment at the same time, because kindergarten was not mandatory or universal in Tennessee; 2) sizable attrition occurred over the course of the experiment because of mobility and other factors, and this attrition was likely not random; 3) parents, teachers, and schools knew they were part of an experiment and, because of pressures from parents, part of the experiment was compromised by re-assignments of students;22 4) no achievement tests were given before kindergarten, making it difficult to analyze whether elements of the random-assignment process contributed to any subsequently observed achievement differences;23 5) approximately 6 percent of the students were transferred across treatment groups at the end of the first year of the experiment;24 and, 6) there was some drift from the target class sizes of 15 and 22 so that there is actually a distribution of realized class size outcomes over time in both treatment groups. Each of these issues has been raised by the initial researchers (e.g., Finn and Achilles, 1990) and by later interpreters of the results (e.g., Mosteller (1995) and Krueger (1997)), but the experimental data do not provide information that permits fully ascertaining the effects of such possible problems. Quite incredibly, the data from this experiment have not been generally available to researchers who were not involved in the original design and analysis. While many appear to have thought, for example, that the widely cited article by Mosteller (1995) involved new data analysis, in fact it simply compiled the results of the previously published original analyses of the STAR data. Indeed, Mosteller concludes:. 22. After the first year, students in the regular and the regular with aide classes were randomly reassigned. Preliminary analyses from kindergarten had indicated that these two treatments did not result in significantly different performance, but the re-assignment made analysis of aide effects difficult. Small class assignments were not altered. Virtually no attention has been given to how teachers responded to the experiment. Teachers knew that they were participating in an experiment to ascertain the effectiveness of reduced class size. Each teacher clearly knew whether they were part of the small or regular class portion of the experiment. And, teachers in general would prefer smaller to larger classes. Whether these factors influenced work effort or behavior is not known. 23. Considerably controversy exists about how early in schooling reliable achievement testing is possible, but few people suggest that pre-kindergarten testing is either reliable or useful. Thus, while the lack of pretesting in the experimental assignment is understandable, it still introduces some uncertainty into the analysis. Krueger (1997) does demonstrate that there does appear to be random assignment based on key student characteristics such as race or eligibility for free or reduced lunch, providing a prima facie case that kindergarten differences are not just the result of any simple biases in treatment assignment. 24. The transfers were “intended to separate incompatible children and ‘to achieve sexual and racial balance’“(Mosteller, 1995, p. 124). Such transfers potentially bias simple comparisons of small and regular classrooms, because treatments are no longer independent of student characteristics.. -31-.
(35) Because a controlled education experiment (as distinct from a sample survey) of this quality, magnitude, and duration is a rarity, it is important that both educators and policymakers have access to its statistical information and understand its implications. Thought should be given by both public and private organizations to making sure that this information is preserved and well documented and that access to it is encouraged. (Mosteller 1995, p. 126) A decade after the experiment nothing has been done to permit general access to these data, even though truly enormous decisions are being made based on the limited set of available analyses of the experimental data.25 It is particularly important to note that Project STAR has never been replicated. The ambiguities arising from the contaminating conditions cited above clearly suggest that further experimentation would be useful in reducing uncertainties arising from the original study. Indeed, practical problems of experimental implementation suggest that no single experiment is likely to be entirely free of ambiguities. Nonetheless, the power of random-assignment experimentation–a routine contributor, for example, to advances in medical knowledge–should not be ignored. One of the strongest messages of Mosteller (1995) is the power of random-assignment experiments to circumvent some of the difficulties of relying on statistical analyses of observations from natural outcomes of the schooling process. (On this point, see also Hanushek with others, 1994). An explanation that has been cited for the lack of any replication or extension of Project STAR’s experimental approach is that experiments are expensive. Project STAR involved appropriations of about $3 million per year (Word et al., 1990). Yet the proper frame of reference is the cost of a full scale program, such as the 1996 California class size initiative for K-3 that involves a $1 billion annual expenditure. Proposed national programs go far beyond this expenditure. The potential costs of implementing an ineffective policy on that scale simply dwarf the costs of designing, implementing, and evaluating a series of extensive random-assignment studies designed to investigate alternative policy proposals (Hanushek with others, 1994). Further, when class size reductions are implemented for an entire state, they defy subsequent analysis of their effectiveness. In other words, we will be unlikely ever to obtain reliable evaluations of whether or not the $1 billion annual expenditure in California is achieving any positive educational results. Of course, if the class size reductions are viewed more as policies 25. The data have been archived at the Center of Excellence for Research in Basic Skills of Tennessee State University. The data have not been made available to outside researchers despite many requests to gain access to them. Krueger (1997) employs the basic STAR data, although his copy of the data was supplied personally by one of the initial principal investigators and not by the Center.. -32-.
(36) with political rather than educational objectives, it is perhaps the case that policy makers do not want to know whether there are performance improvements.. 5. Interpretation and Conclusions The extensive investigation of the effects of class size on student performance has produced a very consistent picture. There appears to be little systematic gain from general reductions in class size. This story comes through at the aggregate level, where pupil-teacher ratios have fallen dramatically over the past three decades and where student performance has remained virtually unchanged. It also comes through from international data, where extraordinarily large differences in class sizes are found without commensurate differences in student performance. But, since the aggregate analyses could be misleading for a variety of analytical reasons, more weight should be put on school level analyses and on experimental data. From production function estimates, there is little reason to believe that overall reductions in class size will yield much in the way of positive achievement gains. With several hundred separate estimates of the effects of reduced class size, positive and negative effects almost evenly balance each other, underscoring the ineffectiveness of overall class size policies such as those being currently advocated. Finally, the one major random-assignment experiment – Tennessee’s Project STAR study – provides no support for widespread class size reductions, although it holds out hope for gains from reduced-size kindergartens. None of this says that smaller classes never matter. Indeed, the micro-evidence, which shows instances where differences in teacher-pupil ratios appear important, suggests just the opposite. My own interpretation is there are likely to be situations – defined in terms of specific teachers, specific groups of students, and specific subject matters – where small classes could be very beneficial for student achievement. At the same time, there are many other situations where reduced class size has no important effect on achievement, even if it always has very significant impacts on school costs. Thus, across-the-board policies of class size reductions, such as those enacted in 1996 for elementary education through grade three across the State of California, are unlikely to have a beneficial effect on overall student achievement.26 The complexity of the situation is that we do not know how to describe a priori situations where reduced class size will be beneficial. Thus, it is not possible to legislate 26. In the short run, it is quite conceivable that the California program could have negative effects. By being introduced unexpectedly and with little lead time, many districts found themselves without existing classrooms or teachers to permit desired reductions in class sizes–leading to transitional difficulties that could have negative consequences for a number of years.. -33-.
(37) just the good outcomes from the state capital or to institute just the good outcomes from the courtroom. Policies developed there can only expect average gains, which appear to be very small. The California policy, which many other states appear to be on the verge of emulating, illustrates another aspect of the relationship between research evidence and policy making. The California program was designed to move classes down to around that of the regular sized classes in the Tennessee experiment. No evidence from STAR relates to the likely effects of such a policy change (as opposed to moving classes down to the level of 15-to-1). Moreover, the original Glass and Smith (1979) analysis itself casts serious doubts on the potential for any improvement in student performance from this policy. Much of the case for reduced class size rests on common sense arguments. With fewer students, teachers can devote more attention to each child and can tailor the material to the individual child’s needs. But, consider, for example, a movement from class sizes of 26 to class sizes of 23. This represents an increase in teacher costs alone of over ten percent. It is relevant to ask whether teachers would in fact notice such a change and alter their approach. The observational information from teacher and classroom process effects of the one-third reductions in Project STAR suggested no noticeable changes (Finn and Achilles, 1990). The policy issue is not defined exclusively by whether we should expect positive effects from reducing class sizes. Even if we were confident of positive effects, the case for general policies to reduce class size would not yet be made. Class size reduction is one of the most expensive propositions that can be considered. The policy experiment of Project STAR involved increasing the number of classroom teachers by one-third, a policy with massive expenditure implications if implemented on a wide- scale basis. In recognition of fiscal realities, the expense of such policies puts natural limits on what is feasible, leading many reductions to be in the end rather marginal. Marginal changes, however, are even less likely to lead to underlying changes in the behavior of teachers. But could reducing classes hurt? Many argue (correctly) that improving the quality of U.S. schools should be a very high priority for policy at the local, state and national levels. Moreover, this argument is (correctly) supplemented by noting the special concerns about equity and equality of opportunity that follow from significant disparities in outcomes across economic and racial groups. Faced with these real concerns and given the strong advocacy of reducing class sizes by teachers and parents, politicians appear frequently to find supporting proposals to reduce class size simply irresistible. After all, some students will undoubtedly benefit from smaller classes even if all do not. The primary argument against this is that bad policy drives out good policy. -34-.
Figure


+7

![Table 2. Special Education Population and School Personnel: 1980-1990 Year Disabled Children (age 0-21 years) [1,000s] Percentageof Elementary-SecondaryStudents](https://thumb-us.123doks.com/thumbv2/123dok_us/10736992.2961839/18.918.112.807.162.832/education-population-personnel-disabled-children-percentageof-elementary-secondarystudents.webp)


Outline
Related documents
Edith Mirzaian, Pharm.D., BCACP, Assistant Professor of Clinical Pharmacy, University of Southern California Janice Hoffman, Pharm.D., CGP, FASCP, Assistant Professor of
We estimated mortality rates associated with live births and legal induced abortions in the United States in 1998 –2005 by combining published data from several national data sets..
We aspire to change the routing and forwarding fabric of the global inter-network so as to operate entirely based on the notion of information (associated with a notion of labels
As part of that inquiry, Amgen utilized the Conflict Minerals Reporting Template (“CMRT”) created by the Conflict- Free Sourcing Initiative (“CFSI”) to facilitate the transfer
Internet users post a manylarge number of audio, video clips onaudio, video-sharing websites and social network(Facebook, Twitter) applications everyday [1]. The number of audio,
The main objective of this research study is to determine whether bonding, trust, commitment, communication, competence and conflict handling dimensions
(finding that such communications will be limited under the FDCPA if they are “inconvenient, annoying, or harassing, or may harm their reputations at work”). The Mini-Miranda
Given the diversity of process management scenarios that are commonly found in enterprises which BPM technologies should be able to address, and given the importance of being able
