Discussion
Papers
Statistics Norway Research department No. 855•
January 2017Elin Halvorsen and Axel West Pedersen
Closing the gender gap in pensions.
A microsimulation analysis of the
Norwegian NDC pension system
Discussion Papers No. 855, January 2017 Statistics Norway, Research Department
Elin Halvorsen and Axel West Pedersen
Closing the gender gap in pensions.
A microsimulation analysis of the Norwegian NDC
pension system
Abstract:
In this paper we use an advanced micro-simulation model to study the distributional effects of the reformed Norwegian pension system with a particular focus on gender equality. The reformed Norwegian system is based on the NDC-formula with fixed contribution/accrual rates over the active life-phase and with accumulated pension wealth being transformed into an annuity upon retirement. A number of redistributive components are built into the system that makes it deviate from complete actuarial fairness: a unisex annuity divisor, a ceiling on annual earnings, generous child credits, a possibility for widows/widowers to inherit pension rights from a deceased spouse, a targeted guarantee pensions with higher benefit rates to single pensioners compared to married/cohabitating pensioners, and finally the tax system that is particularly progressive in its treatment of pensioners and pension income. Taking complete actuarial fairness as the point of departure, we conduct a stepwise analysis to investigate how these different components of the National Insurance pension system impact on the gender gap in pensions and on inequality in the distribution of pension income within a cohort of pensioners.
Keywords: pensions, gender gap, inequality, micro simulation
JEL classification: D31, E47, H55
Acknowledgements: We thank Ola Vestad, Nils Martin Stølen and seminar participants at the Foundation for International Studies on Social Security (FISS) conference (Sigtuna, June, 2016), the ESPAnet conference (Rotterdam, September, 2016), and IMA European conference (Budapest, September, 2016) for comments and suggestions. This work has been supported by the Norwegian Research Council (grant no 238202).
Address: Elin Halvorsen, Statistics Norway, Research Department. E-mail: [email protected]
Axel West Pedersen, Institute for social research, Oslo,
Discussion Papers comprise research papers intended for international journals or books. A preprint of a Discussion Paper may be longer and more elaborate than a standard journal article, as it may include intermediate calculations and background material etc.
© Statistics Norway
Abstracts with downloadable Discussion Papers in PDF are available on the Internet:
http://www.ssb.no/en/forskning/discussion-papers http://ideas.repec.org/s/ssb/dispap.html
3
Sammendrag
Denne artikkelen bruker mikro-simuleringsmodellen MOSART til å studere fordelingsvirkningene av det reformerte pensjonssystemet i Folketrygden. Vi undersøker hvilken betydning ulike komponenter i det nye systemet - blant annet kjønnsnøytralt delingstall, omsorgsopptjening og arv av pensjons-rettigheter mellom ektefeller - har for forskjellen mellom menns og kvinners pensjon og for den generelle ulikheten i pensjonsinntekt blant fremtidige alderspensjonister. Våre analyser skiller seg på en rekke punkter fra tidligere studier av fordelingsvirkningene av det reformerte pensjonssystemet. Vi konsentrerer oppmerksomheten om hvordan opptjeningsreglene i det nye pensjonssystemet slår ut for én fødselskohort, og vi ser på tre ulike utfall: fordelingen av pensjonsinntekt tidlig i pensjonerings-fasen, fordelingen av gjennomsnittlig pensjonsinntekt over hele individets pensjoneringsforløp og summen av pensjonsinntekter over pensjoneringsforløpet. Videre ser vi, i motsetning til tidligere studier, ikke bare på fordelingen av individinntekt men også på ekvivalert husholdsinntekt og et (nyutviklet) individuelt inntektsbegrep som tar høyde for forskjell i stordriftsfordeler mellom enslige og gifte/samboende pensjonister.
1 Introduction
Due to enduring gender differences in labour market behaviour and outcomes, marriage behaviour, and longevity, men and women have different outcomes in national pension systems and have different interests with respect to pension design. It is a universal finding from developed countries that male pensioners on average receive higher benefits than female pensioners, have a lower poverty risk (OECD 2015: 170-171), and (on average) enjoy a higher level of economic well-being (Whiteford and Kennedy 1995; Pedersen 1999: 289).
The so-called gender gap in pensions – typically measured as 1 minus the ratio between average benefits received by female and male pensioners at a given point in time - has received considerable attention in recent years from international organisations like the OECD (OECD 2012)1 and the EU (European Commission and Social Protection Committee 2015). According to the latest “Pension Adequacy Report”, the weighted gender gap in pensions across the entire EU-27 population of pensioners aged 65+ stood at 40% in 2011 (European Commission and Social Protection Committee 2015: 151). According the same source, cross-national variation is huge: from a gender pension gap of only 3% in Estonia to a gap of 46% in the Netherlands.
The observed cross-national variation in the size of a gender gap in pensions can be attributed to three main sources: a) variation in the historical labour market behaviour of women and the male/female wage gap, b) variation in marriage and divorce patterns and the scope of gender differences in longevity, and c) variation in pension design that to a different degree allows differences in lifetime earnings between men and women and demographic differences between the two genders to be reflected in the distribution of pension benefits.
Gender differences in the participation in paid work and unpaid care-work is the most important explanation for the universal existence of gender gap in pensions and an important source of variation in size of the gap across time and space. In most OECD-countries and in the Nordic welfare states in particular female labour force participation has grown significantly since the 1950-60s – the heyday of the male breadwinner model – and this will inevitably result in a gradual narrowing of the gender gap in pensions in the long run. However, as long as women continue to achieve lower life-time earnings than men – due to more career breaks, more
1See also https://www.oecd.org/gender/data/newoecddataandanalysisrevealingthewidegapinpen
part-time work and lower wages - it is virtually inevitable that there will be a gender gap in old age pensions as well.
Gender differences in longevity and marriage/partnering behaviour is another source of gender differences in pension outcomes and economic well-being over the retirement phase. The lower mortality and higher life-expectancy of women compared to men imply that women can expect to spend more years and a larger share of their life-course being dependent on the receipt of old age pensions. While the average yearly benefits received by female pensioner are typically lower than the benefits of men, the difference in lifetime benefits tend to be smaller, or even be negative. The higher life-expectancy of women also means that the returns on pension contributions typically are higher for women than for men (Stålberg et al. 2005), unless gender differences in longevity are somehow taken into consideration in the benefit formula. It is also worth noting that the higher life-expectancy means that women have a stronger interest in the payment of life-annuities as opposed to lump-sum benefits or benefits paid out over a fixed number of years, and for the same reason women have a stronger interest than men in generous indexation rules (James 2012).
Another demographic difference between men and women with important implica-tions for pensions and economic well-being in retirement is the propensity for women to marry (or cohabitate with) partners who are somewhat older than themselves. In Norway, the average age gap between spouses is currently 3.5 years.2 Together with
the difference in longevity, the age gap between spouses implies that females have a far higher risk of becoming widows and females can expect to spend a longer part of the retirement phase as single pensioners. As a consequence female pensioners would enjoy a lower level of economic wellbeing compared to male pensioners, even if their old age pension benefits were equal to those of men. In other words, women have a stronger interest than men in pension mechanisms or benefit components that compensate widows/widowers for the loss of economies of scale that come with sharing expenses in a household.
Of course these gender differences in labour market behaviour and in demographic variables do not directly decide the final outcome in retirement. Instead they interact with features of the pension system to produce a particular distribution of pensions and economic wellbeing among a generation of old age pensioners. National pension systems in developed economies have developed historically from two rather different traditions: a Bismarckian approach relying on earnings-related social insurance and a Beveridgeian approach to pension provision concentrating on providing a minimum
income guarantee in old age through flat-rate or means-tested benefits (Pedersen 1999).
While there is (virtually) no gender gap in public pension benefits in countries following a Beveridgeian approach to pension provision with flat-rate or means-tested benefits only (like the Netherlands, Denmark and Iceland), a considerable gender gap is likely to emerge in countries following a Bismarckian social insurance approach where public pension benefits are more or less tightly linked to prior contributions and lifetime earnings. The gender gap tends to be particularly large in countries that do not offer any effective minimum provision to individuals (married women) who have had low or no earnings over the life-course – like the continental European countries including Germany, Austria and Italy. In the first group of Beveridgeian countries, private occupational pensions tend to play a large role, and when these are taken into consideration a significant gender gap tends to emerge also in these countries. In fact the Netherlands appears to have the highest gender gap in total pension benefits among the EU-27 countries while the gender gap is relatively low in Denmark (European Commission and Social Protection Committee 2015: 151).
The Norwegian public pension system has since the late 1960s belonged to an intermediate group of countries combining the provision of (relatively generous) minimum benefits to all elderly through a combination of flat-rate and targeted benefits with an earnings-related second tier. The earnings-related second tier is based on a point system in which a full pension is achieved after 40 years of participation in gainful work and in which benefits were calculated on the 20 best earnings-years.
Currently the gender gap in public pension benefits measured over the present generation of old age pensioners amounts to 27% (the average benefits of female pensioners are 73% of the average benefits received by males) (Claus et al. 2013), and the figure is only slightly higher when taking account also of supplementary occupational pensions. The gender gap in pensions has been declining over the last decade and was heading for a further gradual decline over the coming decades, due to the massive entry of women into the labour force from the 1970s onwards and the resulting comparatively high labour force participation rates among younger generations of Norwegian women (Koren 2012). It has been estimated that the gender gap in pensions would decline further to about 15 percent in 2050 if the old system had been continued without any changes in the benefit formula (NOU 2004:1; Christensen et al. 2012).
2 The Norwegian pension reform
Over a period of ten years, between 2001 and 2011, a major pension reform was prepared, enacted and put into force. In the policy making process leading up to the enactment of the reform in 2009, the potential consequences for the gender gap in pensions and gender equality more generally was a hotly debated topic (Bay et al. 2015).
The Norwegian reform is strongly inspired by the path-breaking Swedish pension reform and based on the Notional Defined Contribution (NDC) approach. The accrual of pension rights will in the new system take place continuously over the life-course with a fixed rate (in the Norwegian case) of 18.1 percent of annual earnings up to a ceiling at approximately 1.3 times the average fulltime wage. The accumulated deposits on individual notional accounts will eventually be transferred into an annuity upon retirement based on the individual’s age at take-up and the remaining life expectancy of the cohort to which the individual belongs.
A key rationale for abandoning traditional defined benefit systems and replacing them with the NDC framework is to achieve a closer and more transparent link between lifetime earnings and lifetime contributions on the one hand and (expected) pension benefits on the other. This is assumed to improve both the fairness and the economic sustainability of the system. Arguably, fairness is enhanced by re-moving “opaque” and sometimes directly regressive redistributive elements found in traditional systems (Myles 2002, Eriksen and Palmer 2004), while economic sustainability is improved by an assumed strengthening of the incentives to work when contributions to the pension system can be viewed as a form of forced savings rather than as an ordinary tax (Lindbeck & Persson 2003; Disney 2004).
However, a tight link between lifetime earnings and (expected) pension benefits is likely to produce a significant gender gap in pensions as long as women continue to have lower lifetime earnings due to a much higher propensity for part-time work and lower wage levels compared to men, as is the case also among the present generation in Norway. While the core of the reformed pension system is an NDC-system in which pension rights are in principle strictly proportional to lifetime earnings, a number of mechanisms and additional components contribute to break or weaken the link between previous earnings and expected pension benefits and hence to deviate from the principle of perfect actuarial fairness (Lindbeck and Persson 2003). These redistributive mechanisms and components can be divided into three main groups: 1. General redistributive mechanisms that (are intended to) reduce inequality in the distribution of benefits as compared to previous earnings. The most
obvious mechanisms in this category are the social security ceiling on annual earnings that give rise to pension rights (fixed at 7.1 base amounts or about 1.3 times the average fulltime wage) and an individual guarantee pension that truncates the distribution of old age pensions from below. The guarantee pension is comparatively high – with a gross level for a single pensioner at about 36 percent of an average fulltime wage – and the benefit is tested against accrued pension rights in the NDC-system with an 80 percent taper. In this category we can also include the tax system which is particularly mild and progressive with respect to pensioners and pension income. The rules are so constructed that pensioners with low incomes (at or just above the guarantee level) do not pay any income tax, while relatively high marginal tax-rates apply to pension income in a large interval above the minimum.
2. Specific family/household related redistributive mechanisms. A system for granting of child credits to parents of children under the age of 6 belongs to this category. The credits take the form of a guaranteed minimum yearly pension accrual for one of the parents (almost always the mother) corresponding to the accrual based on earnings at 80 percent of an average fulltime wage. In the old system spouses could inherit part of the pension rights of a deceased spouse and a similar rule is supposed to apply also in the reformed system.3
Finally in this category we include the existing differentiation of the level of the guarantee pension between married and cohabitating couples on the one hand and single pensioners on the other. The minimum benefit is somewhat higher for single pensioners in order to compensate for higher living expenses per person compared to pensioner couples. This differentiation according to the household situation of the pensioner has been very significantly reduced in recent years, but some remains.
3. Finally, we can talk of a category of more latent redistributive mechanisms
related to the fact that the reformed pension system – just like the old system – provides life-long annuities and is an insurance scheme in which groups with a relative high life-expectancy participate on equal terms with groups with a relatively low life-expectancy. In the new system each cohort will have to pay for its own (estimated) life-expectancy, but the annuity divisor is gender neutral despite the significant difference in life-expectancy between men and women. The implicit redistribution from men to women that follows from
3The legislative details of this have yet to be decided. In the present work we assume that the
rules applied to the reformed system will be identical to the rules that have so far been applied in old system.
the use of a gender neutral as opposed to a gender specific annuity divisor is however somewhat reduced due to an explicit under-indexation of running pension benefits by 0.75 percent. If running benefits had been subject to full wage indexation, the redistribution embedded in the gender neutral annuity divisor would have been even stronger (James 2012).
3 Research questions and hypotheses
In this article we set out to investigate the contribution made by the different components in the reformed system to the expected distributive outcomes of the system with a primary focus on the gender gap in public pension benefits and income and economic wellbeing more generally. We also look at the contribution made to within (gender) group inequality and overall inequality among a pensioner cohort. Our analysis differs in a number of respects from previous studies of the distributive implications of the Norwegian pension reform (see for instance Christensen et al. 2012; Fredriksen and Stølen 2014; Nicolajsen and Stølen 2016). Rather than looking at a cross-section of pensioners in a particular year, we analyse how the new system for accruing pension rights decides the distribution of pension benefits and economic well-being among one particular birth cohort, and we look at three different types of outcomes: the distribution of yearly pension benefits early in the retirement phase, the distribution of the total sum of pensions received during retirement and the distribution of average yearly pensions received during the retirement phase. Furthermore, in contrast to previous studies, we look at not just the distribution of individually received pension benefits (as in the standard measurement of a gender gap in pensions), but also at the distribution of equivalised household pension income. Finally we look at the distribution of a new individual income concept that avoids the assumption of an equal sharing of resources between couples but takes account of differences in economies of scale between single and married/cohabitating pensioners.
All the different components and features of the reformed pensions system that entail deviation from complete actuarial neutrality are likely to be redistributive to a varying degree in favour of women as a group. Among the family/household related mechanisms in group 2, particularly the rather generous system of child credits was presented and discussed in the reform process as an important “female friendly” component that would compensate for a closer earnings/benefit link and the removal of the (presumed) women friendly 20 best year rule (Bay et al. 2015). Rules allowing spouses to inherit pension rights from each other have also been judged as important from a female perspective, while the differentiation of the guarantee pension has
received relatively little attention as a potentially “female friendly” component of the reformed pension system. However, the effect of these components on within group inequality among women (and men) and the overall effect on inequality among a cohort of pensioners is not entirely obvious a-priori.
Concerning the more general redistributive mechanisms in group 1, there is reason to believe that they too contribute to modify the final distribution of pension benefits to the advantage of women as a group compared to men. Redistribution from individuals with high life- time earnings to individuals with low life-time earnings will typically result in more equality at the group level between men and women, in addition to reducing the degree of inequality within each respective group (gender).
Finally, the gender neutral annuity divisor with its implicit redistributive effect in favour of women was simply taken for granted and never questioned in the policy making process. We expect that it will have a fairly strong redistributive effect in favour of women, while it should have no effect on the intra group inequality among men and women, respectively.
With respect to outcomes we expect the gender gap to be small or perhaps even negative when focussing on the sum of benefits received over the retirement phase, intermediate when looking at yearly benefits early in retirement, and largest when defined in terms of the average yearly benefits received over the retirement phase. Concerning the three alternative income concepts we expect the gender gap to be largest when measured in terms of individual income, smallest when measured in terms of equivalised household income and intermediate when measured in terms of individual income adjusted for economies of scale.
We should emphasise that our aim is purely descriptive and analytical as opposed to normative. We do not intend to engage in a discussion about the normative justification for mechanisms and benefit components that entail a deviation from actuarial fairness. Neither do we want to defend specific ideas about what the ideal policy target would be in a gender perspective – whether a narrowing of the gender gap is in and by itself a legitimate policy objective and if so how it should be weighed against other (potentially) legitimate objectives, like general inequality reduction or improving work incentives.
It should be pointed out, however, that there are inherent tensions between compensating women for lower labour market participation and lower wages on the one hand and stimulating and rewarding women for increasing their investment in human capital and increasing labour force participation on the other. We see here a specific version of the more general conflict between equality and efficiency and between redistribution and labour market incentives (Stålberg et al. 2005).
Seemingly “female friendly” components of the reformed Norwegian pension system like the child credits, the right to inherit pension rights after a deceased spouse and the guarantee pension, all contribute to weaken the pension-related incentives to labour supply, particularly for women. They also tend to subsidise the pensions of couples who have divided paid and unpaid work in accordance with traditional gender roles at the expense of singles and couples who have tended to share both formal and informal work more equally (Bay et al. 2015). We come back to this dilemma in the concluding section.
4 Data-source and simulation assumptions
The analysis is done using the Norwegian microsimulation model MOSART. This is a dynamic microsimulation model that simulates lifetime trajectories for the entire Norwegian population (see Fredriksen 1998 for an introduction to the model). The version used starts in 2013, and simulates a wide range of lifetime events and processes, mainly demographics, educational choices, income and pensions. Up until 2013 the information about historical events is based on different national registers such as the Central population register, and registers in the Norwegian Tax Administration and the Labour and Welfare Service. Transition probabilities depending on individual characteristics are estimated from observed transitions in a recent period. Events included in the simulation are migration, deaths, births, household formation, educational activities, retirement, labour force participation, income and wealth. Public pension benefits are calculated from the simulated labour market earnings and other characteristics included in the simulation according to an accurate description of the public pension system. The pensions covered by the model include old age pensions, disability pensions, survival pensions and early retirement benefits. Changes in the pension system may be analysed by calculating several pension systems in parallel while keeping the stochastic events constant.
We have chosen to follow one specific birth cohort, those born in 1963. By restricting the analysis to one single birth cohort we avoid the cohort effects that would usually be present in a cross sectional analysis where the differences between individuals are influenced by past historical fluctuations that may have had different impact on different birth cohorts. The 1963-cohort is the first cohort whose pensions are fully determined by the new system. It is also a cohort for whom we have most of the crucial demographic decisions and labour income development already resolved. In 2013 members of this cohort were 50 years old, so the events up till then are historically determined while the remaining life-course is simulated with respect to labour earnings and potential divorces, remarriages etc.
To make the analysis as clean as possible, focusing on how the system for accruing pension rights affects women and men, we restrict all persons to work until they are 67 years old, and be retired afterwards, even though the new system allows for a flexible combination of pensions and earnings between ages 62 and 75 with full actuarial adjustments for the timing of pension take-up. This is to ensure that the results are not driven by behavioural adjustments to this feature of the pension system. As shown by Fredriksen and Stølen 2014, since this new flexibility was introduced in 2011 men have been much more likely than women to take out pension rights from age 62 often in combination with continued full-time work, and as a result of this their annual pension income will be lower and their total income becomes low when they eventually withdraw from the labour market. Since the decision to take out pension rights while in full-time work is a voluntary, calculated act, we believe that the consequences of this choice in terms of lower annual benefits later in retirement do not belong in a distributive analysis.
We wish to highlight the advantages of sharing incomes between spouses/partners, and take account of both economies of scale and intra-household redistribution of income. However, as we want to concentrate on the distributive effects of the pension system, we set the partner’s labour income to zero and only use the partner’s pension income in the definition of household income.
5 Descriptive statistics
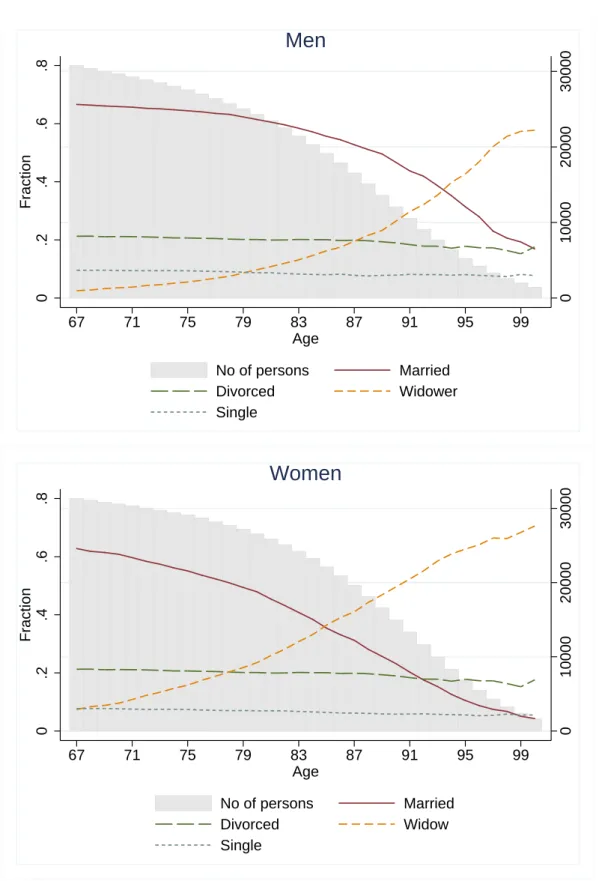
Figure 1 shows the development in sample sizes and demographic characteristics by age over the entire retirement phase. According to the simulation the 1963 cohort will consist of 30 771 men and 31 319 women at age 67.4 The bars represent number of observations and we note how mortality is lower for women than for men so the decline in sample size is slower for women than for men. The simulated life expectancy at age 62 is 86 years old for men and 88 years old for women.
Furthermore, the figure shows how the share who are married decreases more sharply while the share of widows increases faster for women compared to men. In the early stage of retirement, at age 68, 62 percent of the men and 66 percent of the women are married. The difference corresponds to a higher share of widows (8 percent) compared to widowers (3 percent). When reaching age 78 the share of married women has decreased to 51 percent due to an increase in the share of widows – going up from 8 to 20 percent. Among males the share of widowers has gone up from 3 to 8 percent. The higher risk of widowhood among females
4948 individuals have been excluded from the sample if they are registered as married but no
Figure 1. Sample size and demographic characteristics. Development over the retirement phase. 0 .2 .4 .6 .8 Fraction 0 10000 20000 30000 67 71 75 79 83 87 91 95 99 Age No of persons Married Divorced Widower Single
Men
0 .2 .4 .6 .8 Fraction 0 10000 20000 30000 67 71 75 79 83 87 91 95 99 Age No of persons Married Divorced Widow SingleWomen
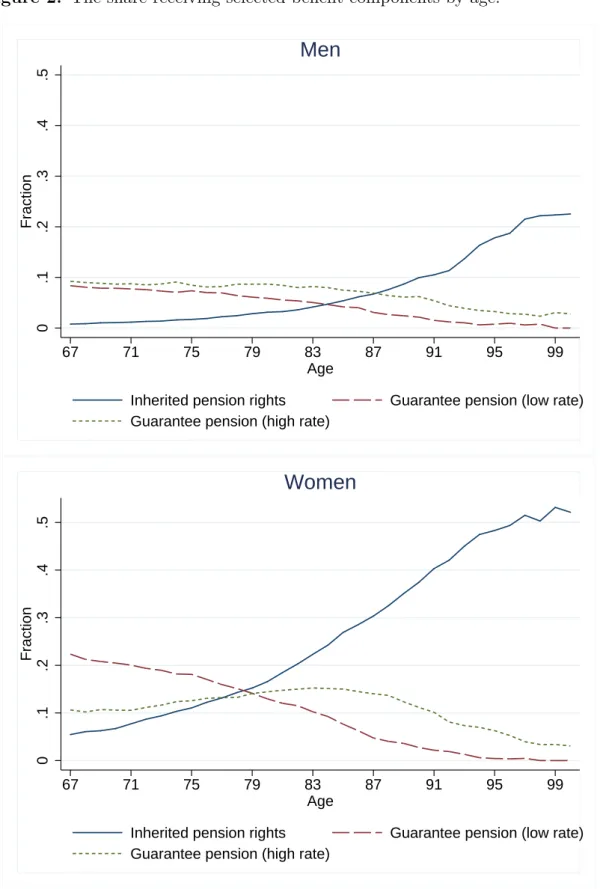
Figure 2. The share receiving selected benefit components by age. 0 .1 .2 .3 .4 .5 Fraction 67 71 75 79 83 87 91 95 99 Age
Inherited pension rights Guarantee pension (low rate) Guarantee pension (high rate)
Men
0 .1 .2 .3 .4 .5 Fraction 67 71 75 79 83 87 91 95 99 AgeInherited pension rights Guarantee pension (low rate) Guarantee pension (high rate)
is partly result of their lower mortality compared to men and the tendency for women to marry/cohabitate with men that are slightly older than themselves (the age difference is about 2 years in our data on the 1963 cohort). From age 85 (when more than half of the female cohort are still alive) there are more widowed than married women, while the corresponding age where the two curves cross for males is 94 years – an age at which only a small minority of males are still alive.
Figure 2 shows how the fraction receiving inherited pension rights is much higher for women than men and increasing with age. At age 88 – the average life-expectancy at age 62 for this cohort of women – almost 40 percent will receive inherited pension rights according to our simulations. The corresponding figure for males at this age is below 10 percent. The two other benefits shown in the graph are the guarantee pension for married/cohabitating pensioners (low rate) and the guarantee pension for singles (high rate). Women more often receive guarantee pension than men and at younger ages typically at the lower rate applied to married/cohabitating pensioners. Over time – as many female guarantee pensioners lose their spouse –the share receiving guarantee pension at the low rate declines, while the share receiving the high rate increases. Among males the share receiving guarantee pensions (both high and low rate) tends to decline, primarily as a result of selective mortality. Richer pensioners tend to live longer than their poorer peers.
Other important benefit components – like child credits and whether pension accrual has been affected by the income ceiling - are pre-determined and thus vary by age insofar as there is different mortality among the recipients. For instance, the fractions receiving guarantee pension is declining since low income individuals have higher mortality than high income individuals.
Not shown in the figure are the fractions receiving child credits and the fraction affected by the upper earnings limit. These fractions are high and quite stable over the remaining lifespan. Among men, approximately 70 percent reaches the upper earnings limit at some point in their working career. The corresponding figure for women is 40 percent. For child credits we have an opposite situation, since the majority of women (76 percent) have at some point in their life acquired some compensation of their pension rights because of care for children (or other family members). The model also simulates child credits to 31 percent of the men, although in reality it is likely to be closer to zero. Child credits are only given to one of the parents, and according to the rules it should be attributed to the one with income lower than the specified limit. In reality, the points are always given to the mother, and if the father is the rightful recipient, he must actively apply for a correction. We believe that very few do so. Therefore, the (modest) pension supplement given
to men because of care for children is likely to be overestimated in the model.
6 Analytic strategy
Our distributional analysis is done in a step-wise fashion. At the outset we simulate a hypothetical pension system that lacks all redistributive elements. Pension rights are proportional to lifetime earning without an upper limit.5 Thereafter, we add each of the redistributive elements in steps: the gender neutral annuity divisor, the ceiling on annual earnings, the child credits, the right to inherit pension rights from a diseased spouse, the minimum guarantee pension (but without higher rates for single pensioners), the guarantee pension with higher rate to single pensioners, and finally, tax on pension income. Here follows a closer description of the redistributive components that are added at each respective step of the analysis:
Step 0. Baseline. In the baseline version of the reformed pension system all redistributive components have been removed and we have applied gender specific annuity divisors taking account of estimated differences in life-expectancy between men and women in this cohort (about two years). This hypothetical pension system can be said to represent the ideal of perfect actuarial fairness where expected benefits (taking account of gender differences in longevity) are proportional to lifetime earnings.
Step 1. Gender neutral annuity divisor. In the next step we introduce the gender neutral annuity divisor that is actually applied in the reformed system. This hypothetical step reproduces the distribution of lifetime earnings in terms of annual pension benefits.
Step 2. Social security ceiling. In this step we take account of the fact that only annual earnings up to 7.1 base-amounts (about 1.3 times the average full time wage) give rise to pension rights. Since men tend to have higher annual earnings than women, we expect that the ceiling will reduce the gender gap in pensions/pension income as well as reduce overall inequality.
Step 3. Child credits. At this step we add child credits. The credits take the form of a yearly guaranteed minimum pension accrual for one of the parents of children below the age of six (as well as other carers). The parent with the lowest earnings is guaranteed a yearly pension accrual in the relevant year corresponding to annual earnings of 4.5 base-amounts (about 80% of an average fulltime wage).
5Ideally, we would have based it on lifetime earnings only. Unfortunately, the model did not
allow for a separation of the different income components, thus earnings include also taxable social security benefits that do actually count in the accrual of pension rights. In this respect a distributional element is already in place, before our analysis begins.
Step 4. Inherited pension rights. According to the rules applied in the old system (that we assume will be adopted also in the reformed system), a widow/widower is entitled to earnings-related pension benefits equal to at least 55% of the sum of the earnings-related benefits received by the couple before the spouse’s death. If the individual pension rights of the survivor exceeds this limit no addition with be granted.
Step 5. Guarantee pension without higher benefits for singles. The guarantee pension secures a comparatively high minimum benefit to individuals with low earnings-related entitlements. The benefit is tested against NDC-pension rights with an 80 percent taper. The benefit guarantee for pensioners living with a partner (married or cohabitating) is fixed at 1.85 base-amounts and in this step we apply
this level also to single pensioners.
Step 6. Guarantee pension with higher benefits for singles. In this step we introduce the actual differentiation of the guarantee whereby the benefit for single pensioners is raised to 2 base-amounts.
Step 7. After tax. In this step we apply income taxation according to current rules. The taxation of pensioners and pension income was modified in connection with the pension reform of 2011. The reformed system is highly progressive and designed to secure that pensioners living on minimum benefits do not pay any income tax.
The sequence in which the different components are entered is crucial for the results obtained. We believe, however, that the chosen sequence is the only possible given the intention to provide a consistent decomposition of the total redistributive effect obtained by the system compared to the benchmark system. The criterion used for establishing the sequence is that benefit components placed towards the end are distributed according to rules that take account of benefits distributed in earlier stages. For instance, the minimum guarantee pension is granted given the total accrual of NDC pension rights, including child credits and any inherited pension rights, while the entitlement to child credits does not depend on any of the subsequent elements. A possible alternative approach would be to look at the net effect of removing one component at a time while taking account of compensatory changes in other components. For instance, removing the child credits would mean that more individuals would be entitled to higher amounts of guarantee pension and the net effect would be smaller than the gross effect that is estimated by the sequential approach. The problem with this “partial” approach is that the estimated effects of the respected components will not add up to the total redistributive effect of all components combined. For selected benefit components we will, however, also
present the net effects of a partial removal of the component.
As we have already pointed out, we are primarily concerned with how different components in the Norwegian pension system affect the gender gap in pensions but we are also interested in inequality among the two genders and overall. The gender gap in pensions and pension income can be seen as a between-group component in overall inequality, while the average of inequality among male and female pensioners can be seen as a measure of within group inequality, and the two are components in the overall level of inequality in pension income.
When analysing the gender gap and inequality we consider three alternative statistics. Annual pension income is the most conventional of the three and here we measure at age 70, i.e. at an early stage in the retirement phase. Total pension income is the sum of all incomes received over the retirement period, deflated by a wage index.6 Finally we look at average pension income which is the total income divided by the number of retirement years (for an earlier contribution see Pedersen 1999: 380). The latter is our preferred outcome statistic because it takes account of income conditions experienced over the entire retirement age, but less driven by differences in longevity.7
Finally we use three alternative definitions of pension income: individual pension income, equalized household pension income (using the modified OECD-scale), and individual income adjusted for economies of scale. While the first is conventionally used in analyses of the distribution of pension benefits and the gender gap in pensions in particular, the second is the conventional choice in poverty and (income) inequality research. The third alternative definition is a novel concept that – as far as we know – has not been suggested and used before. It differs from equalized household income by adjusting individual income with a factor defined equal to the number of household members divided by the number of household units. In the case of two household members and using the modified OECD-scale, this factor will be 2/1.5 = 1.33. The conventional equalizing of incomes takes into account that due to economies of scale in consumption, a couple do not need to have a joint income that is two times as high as a single person to obtain the same level of living. However, the concept assumes equal sharing of incomes and expenses within the household and therefore equalizes any initial income differences between husband and wife.
6We do not use present values of future income since the timing of pension benefits is not
relevant in this setting. Receiving pensions in the form of an annuity represents an alternative cost to the individual because total pension benefits received in the form of a lump sum payment at retirement would have yielded future interest. The expected present value of future pension benefits is therefore a more relevant concept when comparing different types of income streams or different types of wealth.
Since we are concerned with the pension gap, also between spouses, the traditional method of household equivalent income is inadequate. Our alternative measure is a more stylized concept that retains income differences within the couple, while at the same time take into account the gains of economy of scale with respect to expenses.
7 Results
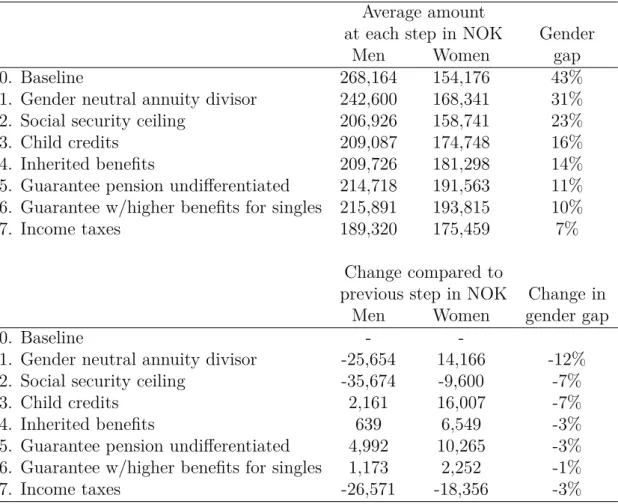
We start by showing each of the redistributive elements’ quantitative effect on (individual) average pension income over retirement for men and women respectively. As shown by Table 1, we estimate that for the 1963 cohort a hypothetical actuarially fair pension system would produce a gender gap of 43%, while the actual reformed system produces a gender gap of only 7% after taking account of income taxation.
Table 1. Individual pension benefits. Average over the retirement phase.
Average amount
at each step in NOK Gender
Men Women gap
0. Baseline 268,164 154,176 43%
1. Gender neutral annuity divisor 242,600 168,341 31% 2. Social security ceiling 206,926 158,741 23%
3. Child credits 209,087 174,748 16%
4. Inherited benefits 209,726 181,298 14% 5. Guarantee pension undifferentiated 214,718 191,563 11% 6. Guarantee w/higher benefits for singles 215,891 193,815 10%
7. Income taxes 189,320 175,459 7%
Change compared to
previous step in NOK Change in Men Women gender gap
0. Baseline -
-1. Gender neutral annuity divisor -25,654 14,166 -12% 2. Social security ceiling -35,674 -9,600 -7%
3. Child credits 2,161 16,007 -7%
4. Inherited benefits 639 6,549 -3%
5. Guarantee pension undifferentiated 4,992 10,265 -3% 6. Guarantee w/higher benefits for singles 1,173 2,252 -1%
7. Income taxes -26,571 -18,356 -3%
Compared to the baseline system, the gender neutral annuity divisor reduces the annual pensions received by men and increases the annual benefits received by women, and altogether the effect is a decrease in the gender gap by 12 percentage points to 31%. The social security ceiling reduces the average benefits received by
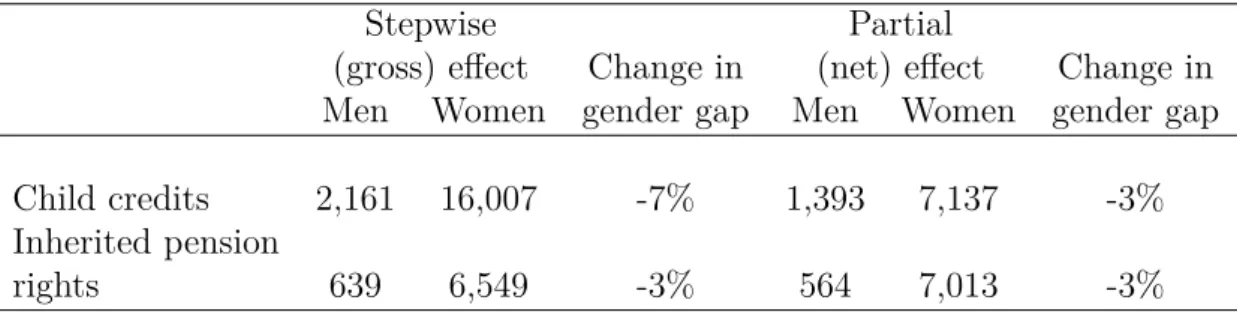
Table 2. Contribution by child credits and inherited pension rights to average pensions for men and women and the gender gap – gross and net effects in NOK and change in gender gap.
Stepwise Partial
(gross) effect Change in (net) effect Change in Men Women gender gap Men Women gender gap Child credits 2,161 16,007 -7% 1,393 7,137 -3% Inherited pension
rights 639 6,549 -3% 564 7,013 -3%
both men and women, but the reduction is much more severe among men. And the result is a further reduction in the gender gap by 7 percentage points to 23%. The system of child credits has a further substantial effect in narrowing the gender gap with 7 percentage points to 20%. As already mentioned this should be considered a lower bound estimate since the estimated average amount received by males due to child credits is likely to be somewhat overestimated. The possibility to take over pension rights from a deceased spouse reduces the gender gap with 3 percentage points on average. It raises the average amount of pension benefits received by female pensioners by 6500 NOK, but one should remember that most of the women who benefit from this only do it for a part of their retirement phase. The impact for those who do benefit the effect is much larger in the years spent in widowhood.
The guarantee pension reduces the gap by altogether 4 percentage points of which the differentiation in favour of single pensioners (step 6) is responsible for 1 percentage point. Finally income taxation reduces disposable income for both men and women, but the progressivity of taxation implies that the relative effect is stronger for men, reducing the gender gap by 3 percentage points.
In the political debate on the Norwegian pension reform, child credits and (to a smaller extent) the right to take over pension rights from a deceased spouse were discussed as women friendly (family related) components in the system. The results in table 1 indicate that child credits are the more important component of the two, but this hinges at least partly on the chosen sequence. Without child credits the effect of the right to inherit benefits would have been stronger, and it is possible that the two benefit components interact with the guarantee pension in different ways. In order to test for this we have for these two components calculated also the partial (net) effect of removing the component while leaving the other components in place and allowing them to automatically compensate for the removal. The results are shown in table 2.
The partial contribution of child credits to average pension would be 7,137 NOK for women, which is considerably lower than the stepwise (gross) contribution of 16,000 NOK, and the net effect on the gender gap is only 3 percentage points due to automatic compensation effects from increased inherited pension rights and the guarantee pension. From this perspective the two family related benefit components have rather similar effects on the gender gap.
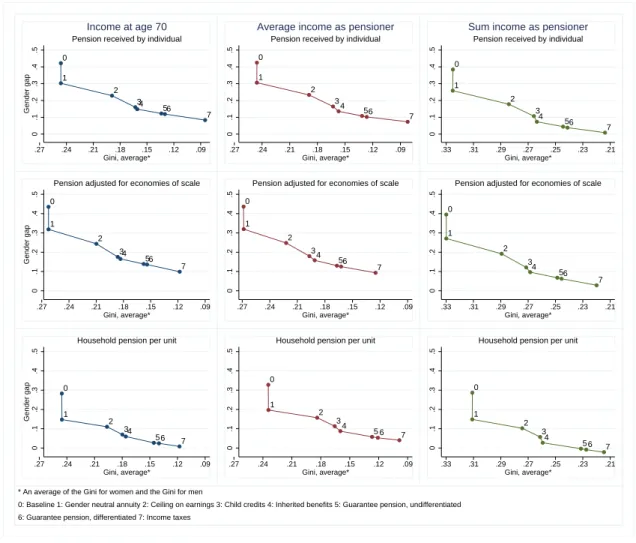
Figure 3. Gender gap and within gender Gini-inequality for three outcome measures and three alternative income concepts. Stepwise analysis.
0 1 2 34 56 7 0 .1 .2 .3 .4 .5 Gender gap .09 .12 .15 .18 .21 .24 .27 Gini, average* Pension received by individual
Income at age 70 0 1 2 3 4 56 7 0 .1 .2 .3 .4 .5 .09 .12 .15 .18 .21 .24 .27 Gini, average* Pension received by individual Average income as pensioner
0 1 2 3 4 56 7 0 .1 .2 .3 .4 .5 .21 .23 .25 .27 .29 .31 .33 Gini, average* Pension received by individual Sum income as pensioner
0 1 2 34 56 7 0 .1 .2 .3 .4 .5 Gender gap .09 .12 .15 .18 .21 .24 .27 Gini, average* Pension adjusted for economies of scale
0 1 2 34 56 7 0 .1 .2 .3 .4 .5 .09 .12 .15 .18 .21 .24 .27 Gini, average* Pension adjusted for economies of scale
0 1 2 3 4 56 7 0 .1 .2 .3 .4 .5 .21 .23 .25 .27 .29 .31 .33 Gini, average* Pension adjusted for economies of scale
0 1 2 34 56 7 0 .1 .2 .3 .4 .5 Gender gap .09 .12 .15 .18 .21 .24 .27 Gini, average* Household pension per unit
0 1 2 3 4 5 6 7 0 .1 .2 .3 .4 .5 .09 .12 .15 .18 .21 .24 .27 Gini, average* Household pension per unit
0 1 2 3 4 5 6 7 0 .1 .2 .3 .4 .5 .21 .23 .25 .27 .29 .31 .33 Gini, average* Household pension per unit
* An average of the Gini for women and the Gini for men
0: Baseline 1: Gender neutral annuity 2: Ceiling on earnings 3: Child credits 4: Inherited benefits 5: Guarantee pension, undifferentiated 6: Guarantee pension, differentiated 7: Income taxes
In Figure 3 we present results from the stepwise analysis for the three outcomes (annual income at age 70, average income over retirement, and the sum of income received over retirement) multiplied by our three alternative income concepts (in-dividually received pensions, individual pensions adjusted for economies of scale and equivalised sum of household pensions). The vertical axis shows the gender gap while the horizontal axis shows the weighted average of Gini-inequality measured for males and females respectively. Note that the axis has been turned so that it runs from high to lower Gini-values.
As is apparent in the figure, all the redistributive elements cause the gender gap to shrink. In addition most of the elements also cause a lower within-group inequality in income. By construction, going from a gender specific to a gender neutral divisor does not change the income inequality within each gender group, but the gender neutral annuity divisor is the redistributive component that contributes the most to reducing the gender gap in pensions compared to the baseline system with a gender specific annuity divisors. The redistributive element that contributes the most to reducing within-group inequality is the ceiling on earnings. As noted earlier, this ceiling affected 70 percent of the men and 40 percent of the women in our simulation.
The profiles are very similar across the different outcome measures and income concepts. However, while the right to take over pension rights from a deceased spouse/partner has a very small impact on annual incomes at age 70, the effect becomes more substantial when looking at the average over the retirement phase (both on the gap and on intra-gender inequality). Another difference to note is that the child credits have a smaller impact when looking at equivalised household income compared to the individual income concepts. Apart from that, the graphs appear to differ mostly in terms of the resulting level of the gender gap and inequality. In order to highlight these differences we complete our presentation of results by showing three tables summarising the final outcomes in terms of the gender gap (table 3), intra-gender inequality (table 4), and overall inequality (table 5).
Table 3. Gender gap in disposable pensions.
Annual income Sum over Mean over at age 70 retirement retirement
Individual pensions 8% 1% 7%
Equivalised household pensions 1% -2% 4% Individual pensions adjusted
for economies to scale 10% 3% 9%
As shown in table 4, the resulting gender gap in disposable pensions is everywhere positive except for the middle cell that refers to the sum over retirement of equivalised household pensions. In line with a-priori expectations, the gender gap is small or negative in all the cells of the second column looking at the sum of benefits received over retirement and the reason is of course that women tend to live longer than men and receive benefits for a longer time. The gender gap is, however, somewhat larger when incomes are measured annually in the first and the third columns – either early in retirement or as an average over the retirement phase - and particularly
it is larger in the four corner cells that refer to individual income with or without adjustment for economies of scale.
The outcomes illustrate how the different definitions operate. We see that the gender gap is small when measured in terms of equivalised household income. Equalization of incomes within couples basically means that the gender gap is driven entirely by single households. Single persons have a lower gender gap at age 70 than all persons since the economies of scale within couples allow the wife to work less. Conversely, with our new concept – individual income adjusted for economies of scale – the gender gap becomes higher than the conventional individual income concept because the gain from economies to scale is accounted for explicitly in addition to the actual income gap between men and women (both single and married). Looking at sum and mean over retirement the adjustment for economies of scale produces a larger gender gap than the standard individual income concept because it captures the fact that females tend to spend a higher fraction of the retirement phase as singles (widows). Apparently the associated loss of economies of scale is not fully compensated by the reformed system despite the right to inherit pension rights and the remaining differentiation of the minimum pension guarantee.
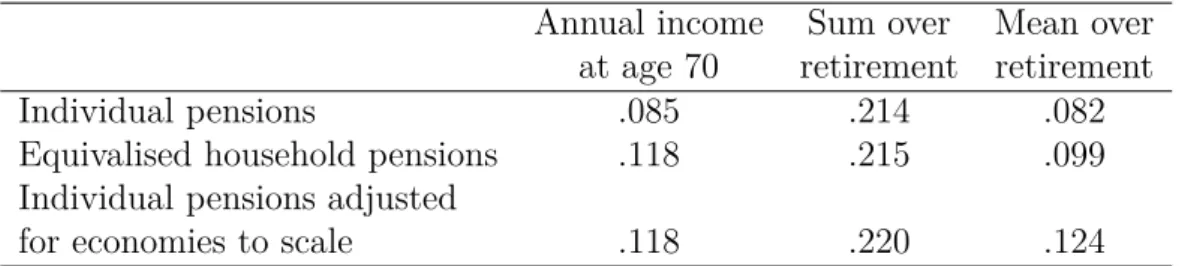
Table 4. Intra-gender Gini-inequality in disposable pensions.
Annual income Sum over Mean over at age 70 retirement retirement
Individual pensions .085 .214 .082
Equivalised household pensions .118 .215 .099 Individual pensions adjusted
for economies to scale .118 .220 .124
Intra-gender inequality is affected differently by the definitions of income. Both equivalised pensions and pensions adjusted for economies to scale represent an upward revision of married women’s incomes relative to single women’s income, thus increasing intra-gender inequality. Intra-gender inequality in pension income is significantly higher for the “sum over retirement” outcome compared to the other outcome statistics measuring annual pension income. The explanation is social inequalities in life-expectancy that tend to correlate with lifetime earnings and accumulated pension rights. The rich tend to live longer and receive benefits for more years and taking this into account adds to the inequalities found in annual incomes. Comparing across the three income concepts we find that within gender inequality tends to be highest for individual pensions adjusted for economies of scale.
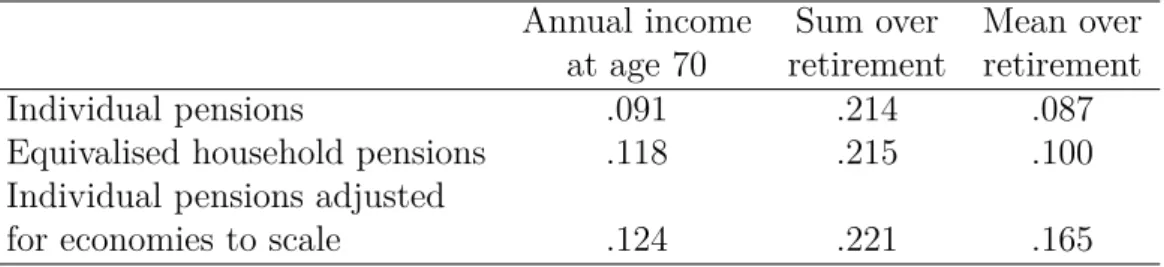
Table 5. Overall Gini-inequality in disposable pensions.
Annual income Sum over Mean over at age 70 retirement retirement
Individual pensions .091 .214 .087
Equivalised household pensions .118 .215 .100 Individual pensions adjusted
for economies to scale .124 .221 .165
Overall Gini-inequality in the distribution of pension income will reflect both the gender gap (between gender inequality) and within gender inequality. The results shown in table 5 can therefore be expected to be a simple positive function of the results shown in the two previous tables. Looking at our preferred outcome statistic, the distribution of mean annual pensions over retirement, we find that Gini-inequality is highest for individual income adjusted for economies of scale, reflecting the fact that both the gender gap and within gender inequality is high for this income concept.
8 Conclusion and discussion
Although the core of the reformed Norwegian pension system is built on the Notional Defined Contribution model and designed to achieve a close link between life-time earnings and expected pension benefits received over the retirement phase, a series of redistributive components ensure that the gender gap in pensions is very significantly reduced. Looking at individual pension income, the projected gender gap in average benefits received over the retirement phase for the 1963 cohort is reduced from 43% -the projected outcome of a hypo-thetical actuarially fair system – to only 7% with all the redistributive components in place, including the progressive system of pensioner taxation.
As expected, the final gender gap is smaller or even negative when looking at the sum of future benefits received over the retirement phase, and it tends to be smaller when looking at household equivalised income rather than individual income. The largest gender gap appears when we apply our new income concept: individual income adjusted for economies of scale. When this income concept is used in combination with our preferred outcome indicator (average yearly income received over the retirement phase) we find an after tax gender gap of 9%. The gap is somewhat larger when using our new income concept rather than the the conventional individual income concept because the former is sensitive to the fact that female pensioners can expect to spend a longer retirement phase as widows and
hence with the loss of economies to scale.
Our hypotheses for the effect of the different redistributive components are largely born out. The gender neutral annuity divisor gives the single most important contribution to close the gender gap, and the difference between a gender specific and a gender neutral annuity divisor would in fact have been even larger if benefits had been fully indexed with wages over the retirement phase. The redistributive effect of the gender neutral annuity divisor tends to be taken for granted since the introduction of a gender specific annuity divisor in the public pension system has never been seriously discussed. A fully proportional pension system with a gender neutral annuity divisor produces a gender gap in average annual income during retirement of about 30% for individual income and 20 percent for equivalised household income.
Among those components that we have classified as generally redistributive (from rich to poor) the income ceiling appears to be the most important followed by the guarantee pension and the tax system. An important caveat here is that the two latter components would have had a stronger impact without the other redistributive components in place.
Among the last group of redistributive components that we labelled family/household related, child credits have the strongest effect followed by inherited pension rights and the differentiation of the guarantee pension. Again – as we have seen – the sequence plays a role here. The size of pension rights derived from a deceased spouse/partner are reduced as a result of child credits received by the survivor and hence removing the child credits would to a certain degree be automatically compensated by higher inherited pension rights and higher guarantee pensions. The partial (net) effect of removing the child credits is therefore much smaller and about the same as the corresponding effect of removing the right to inherit benefits.
The family/household related benefits tend to reduce intra-gender inequalities as well as closing the gender gap. In particular the child credits have a fairly strong inequality reducing effect (particularly among women, of course), but also here it is likely that a significant share of the redistribution achieved would be automatically taken over by the guarantee pension if the child credits were simply removed.
The child credits and the right to inherit pension rights from a deceased spouse have been recognized and discussed as particularly “women friendly” components of the reformed system, and this study confirms that they do indeed help to close the gender gap in pensions. However, an alternative notion of women-friendliness and alternative criteria against which to evaluate the pension system would be to require that the pension system provides equally strong incentives to labour supply
for women compared to men, and to demand that the system does not systematically favour couples that distribute formal and informal work in line with traditional gender roles.
It is beyond the scope of this paper to provide a detailed empirical analysis of the incentive structure created by the reformed system, but a few observations can be made a priori. The gender neutral annuity divisor and the ceiling on earnings can be assumed to perform well also in terms of this alternative ideal because the first directly strengthens the incentives to work and earn pension rights for women relative to men, while the second weakens the pension incentives more for men than women.
The two women friendly components, however, perform very badly on this dimension as they systematically weaken the labour supply incentives, particularly for women. The child credits effectively remove almost all pension incentives to participate in gainful employment for women with children below six years of age. Rules that allow the survivor to inherit pension rights from a deceased spouse/partner also tend to weaken work incentives, particularly for women, and they systematically favour couples with and unequal sharing of life-time earnings and NDC-pension rights.
There is a further paradox here, however. We have already noted that the net effect on the gender gap of removing the two family components will be smaller than the gross effect because the removal will be partly compensated by the guarantee pension. This observation also applies to the incentive side of the coin. The improvement of the incentive structure that can be obtained by removing the two family related components will be reduced because of the automatic compensation by the guarantee pension. The guarantee pension weakens the incentive to participate in the labour market for the entire lower part of the earnings distribution where women are strongly overrepresented.
So while the reformed Norwegian pension system performs comparatively well in terms of closing the gender gap in pensions, it does so partly thanks to benefit components that weaken the incentives for women to work and reward couples who chose an unbalanced sharing of informal and formal work in accordance with traditional gender roles.
References
Bay, A.-H., M. Teigen, and A. W. Pedersen (2015). En kvinnevennlig pensjonsre-form? likestillingsperspektiver i den norske pensjonsreformdebatten. Tidsskrift for Velferdsforskning 18(3), 164–178.
Christensen, A. M., D. Fredriksen, O. C. Lien, and N. M. Stølen (2012). Pension reform in norway: Combining an ndc approach and distributional goals. In R. Holz-mann, E. Palmer, and D. Robalino (Eds.), Nonfinancial Defined Contribution Pension Schemes in a Changing Pension World, Volume 1: Progress, lessons, and implementation. Washington: The World Bank.
Claus, G., C. Romay, I. Melby, and F. Strøm (2013). Inntektsstatistikk for den eldre befolkning 2011. En kohortanalyse av inntektsutviklingen for aldersgruppen 60 år og eldre. SSB Rapporter 2013/27. Oslo: Statistics Norway.
Disney, R. (2004). Are contributions to public pension programmes a tax on employment? Economic Policy 19, 267–311.
Eriksen, T. and E. Palmer (2004). Swedish pension reform: comments and reflec-tions. In E. Øverbye and P. A. Kemp (Eds.), Pensions: challenges and reforms. International studies on social security, volume 9. Aldershot: Ashgate.
Fredriksen, D. (1998). Projections of Population, Education, Labour Supply and Public Pension Benefits. Social and Economic Studies 101, Oslo: Statistics Norway. Fredriksen, D. and N. M. Stølen (2014). Gender Aspects of the Norwegian Pension
Reform. In G. Dekkers, M. Keegan, and C. ODonoghue (Eds.), New Pathways in Microsimulation. Ashgate Publishing, Ltd.
James, E. (2012). Gender in the (Nonfinancial) Defined Contribution World: Issues and Options. In R. Holzmann, E. Palmer, and D. Robalino (Eds.), Nonfinancial Defined Contribution Pension Schemes in a Changing Pension World : Volume 2. Gender, Politics, and Financial Stability. Washington: The World Bank.
Koren, C. (2012). Kvinnenes rolle i norsk økonomi. Oslo: Universitetsforlaget. Lindbeck, A. and M. Persson (2003). The gains from pension reform. Journal of
Economic Literature 41, 74–112.
Myles, J. (2002). A new social contract for the elderly? In Why we need a new welfare state. Oxford: Oxford University Press.
Nicolajsen, S. and N. M. Stølen (2016). Fordelingsvirkninger av pensjonsreformen.
Søkelys på arbeidslivet 32(1-2), 24–44. NOU (2004). Modernisert folketrygd.
OECD (2012). Closing the gender gap. OECD Publishing, Paris. OECD (2015). Pensions at a Glance 2015. OECD Publishing, Paris.
Pedersen, A. W. (1999). The taming of inequality in retirement: A comparative study of pension policy outcomes. Fafo-report no. 317. Oslo: Fafo.
Stålberg, A.-C., A. Kruse, and A. Sundén (2005). Pension design and gender.
European Journal of Social Security 7(1), 57–79.
Whiteford, P. and S. Kennedy (1995). Incomes and living standards of older people: A comparative analysis. Department of Social Security Research Report, No. 34, HMSO, London.
Statistics Norway Postal address: PO Box 8131 Dept NO-0033 Oslo Offi ce address: Akersveien 26, Oslo Oterveien 23, Kongsvinger E-mail: [email protected] Internet: www.ssb.no Telephone: + 47 62 88 50 00 ISSN: 1892-753X