Modeling Consumer-Perceived Web Application Fault
Severities for Testing
Kinga Dobolyi
University of Virginia 151 Engineer’s Way Charlottesville, VA 22904[email protected]
Westley Weimer
University of Virginia 151 Engineer’s Way Charlottesville, VA 22904[email protected]
ABSTRACT
Despite the growing usage of web applications, extreme re-source constraints during their development frequently leave them inadequately tested. Because testing may be per-ceived as having a low return on investment for web applica-tions, we believe that providing a consumer-perceived fault severity model could allow developers to prioritize faults ac-cording to their likelihood of impacting consumer retention, encouraging web application developers to test more effec-tively. In a study involving 386 humans and 800 web appli-cation faults, we observe that an arbitrary human judgment of fault severity is unreliable. We thus present two models of fault severity that outperform individual humans in terms of correctly predicting the average consumer-perceived sever-ity of web application faults. Our first model uses human annotations of fault surface features, and is 87% accurate at identifying low-priority, non-severe faults. We also present a fully automated conservative model that correctly iden-tifies 55% of non-severe faults without missing any severe faults. Both models outperform humans at flagging severe faults, and can substitute or reinforce humans by prioritiz-ing faults encountered in web application development and testing.
Categories and Subject Descriptors
D.2.5 [Software Engineering]: Testing and Debugging
General Terms
Experimentation, Human Factors
Keywords
web application, fault, severity
Permission to make digital or hard copies of all or part of this work for personal or classroom use is granted without fee provided that copies are not made or distributed for profit or commercial advantage and that copies bear this notice and the full citation on the first page. To copy otherwise, to republish, to post on servers or to redistribute to lists, requires prior specific permission and/or a fee.
ISSTA’10,July 12–16, 2010, Trento, Italy.
Copyright 2010 ACM 978-1-60558-823-0/10/07 ...$10.00.
1.
INTRODUCTION
In the United States, 73% of the population used the In-ternet in 2008 [16], which contributed to the over $204 billion dollars in Internet retail sales in the same year [14]. Trans-actions for which order-taking is completed via the Internet total several trillions of dollars annually [5, 7]. However, customer loyalty to any particular website remains notori-ously low, and is primarily determined by the usability of the application [19]. Despite this, consumer satisfaction and retention are rarely formally addressed during the develop-ment and testing of web applications. We propose to ana-lyze consumer-perceived fault severities in web applications to provide a predictive model that can replace human judg-ments in assigning priority to fixes. Whiledeveloper-judged fault severities are a widely-known approach, we believe that
consumer-perceived severities are a more accurate way to represent the true possible consequences of defects in this domain, due to the inaccuracies associated with developer-based severity ratings [22].
The challenge of fickle customer allegiance in web applica-tions is compounded by high availability and quality require-ments: for example, one hour of downtime at Amazon.com has been estimated to cost the company $1.5 million dol-lars [24]. User-visible failures are endemic to top-performing web applications: about 70% of such sites are subject to user-visible failures, a majority of which could have been prevented through earlier detection [27].
In addition, there are other obstacles to delivering high-quality web applications. Most web applications are devel-oped without a formal process model [25]. Despite having high quality requirements that would normally dictate the need for testing and stability, web applications have short delivery times, high developer turnover rates, and rapidly-evolving user needs that translate into an enormous pressure to change [26].
Consequently, web application developers often deliver sys-tems without properly testing them [26]. We believe that targeting development and testing strategies toward con-sumer retention will make them more attractive to develop-ers; two insights suggest that it is possible to do so. First, al-though web applications are frequently complex, with opaque, loosely-coupled components, are composed in multiple pro-gramming languages, and maintain persistent session
This research was supported in part by, but may not re-flect the positions of, National Science Foundation Grants CNS 0716478 and CNS 0905373, Air Force Office of Sci-entific Research grant FA9550-07-1-0532, and NASA grant NAS1-02117, and Microsoft Research gifts.
quirements, they tend to fail in similar and predictable ways [9]. This similarity stems from the fact that web applications render output in HTML, where lower-level faults manifest themselves as user-visible output [24, 30]. This insight al-lows developers to focus their testing strategies on this top level of the application.
Second, web applications are meant to be viewed by a human user. While this implies that faults in the system will manifest themselves at the user level and may drive away consumers, we claim that this human-centric quality of web applications can be exploited. The acceptability of output becomes dependent on whether or not users are able to complete their tasks satisfactorily — a definition that en-compasses a natural amount of leeway. Rather than view-ing verification in absolute terms, developers may focus on reducing high severity faults that may cause consumers to discontinue using the application.
We present a study and formal model of consumer-perceived severities of web application errors. The main contributions of this work are as follows:
• We demonstrate that surface and semantic features re-lated to HTML rendering can be used tomodel consumer-perceived fault severities, based on a survey containing 12,600 datapoints from 386 humans. Our formal model agrees with the average human 84% of the time, and more than the humans agree with each other.
• We show that many of the features used in our model can be detected automatically, and thus that an au-tomated judgment of consumer-perceived fault severity
can be made with only a 1% drop in accuracy. We believe that such a model and the associated auto-mated tool may increase the return-on-investment for web application testing, since they can help developers to focus on bugs that consumers care about.
• We demonstrate that na¨ıvely-injected faults do not have a uniform consumer-perceived severity, and thus that standardfault seeding metrics are misleading for web application test suite evaluation. In other words, the assumption that all seeded faults have the same severity, and thus that a test suite that finds more faults is necessarily better, is not always true when considering consumer-rated severity.
The structure of this paper is as follows. In Section 2 we present some examples of faults with different consumer-perceived severities and highlight their key features. Sec-tion 3 presents the results of our human study of the per-ceived severities of both real-world and manually injected faults. Our predictive models of fault severity are described in Section 4 and Section 5, with experimental results in Sec-tion 4.2 and SecSec-tion 5.2. Finally, SecSec-tion 7 presents related work, and Section 8 presents conclusions and directions for future work.
2.
MOTIVATION
Consumer-perceived fault severities have not been thor-oughly studied in the context of web applications, even though human interaction is central in this domain. Although intu-itions abound (e.g., some may believe that small typograph-ical errors are less likely to upset consumers than incorrect shopping cart totals, or that missing banner ads are less
severe than entirely-blank pages), because there are no con-crete, evidence-based guidelines in making such judgments, developers may currently be unsure or unaware of how to fo-cus testing methodologies towards fixing high-severity faults first. In general, the extent to which various sorts of errors will drive away consumers remains unclear.
Consider, for example, users of a service who are in the process of updating stored personal profile data. When they attempt to save their changes through the web application, their changes are confirmed, although they receive a small warning message at the top of the screen regarding a seem-ingly unrelated issue. Some users may not notice the warn-ing, others may ignore it, and some with a technical back-ground may interpret the warning to be harmless. It is also possible, however, that users may be left uneasy with respect to the persistence of their profile changes in the presence of any warning message on such a confirmation screen. The relationship between visible web application faults and their consumer perception has not been explored in web applica-tion development and testing.
An orthogonal problem to unknown consumer perception of web application fault severity is that of correctly identi-fying the severity of a particular fault, despite human judg-ment. Even the concept of fault severity is not always straight-forward. Developer-perceived fault severities are frequently recorded during the testing and maintenance phases of soft-ware development in bug repositories, but these judgments have been found to not represent true severities and may instead factor in other variables, such as the politics behind labeling a bug with a certain severity rating [22]. We fo-cus on consumer-perceived severities, rather than developer judgments, in an effort to more precisely identify those faults that are likely to drive consumers away.
Relying on a single human observer to judge the severity of a particular fault, especially if that person is a developer of the application-at-test, may not necessarily lead to accu-rate assessments of the impact of such defects on consumer retention. Consequently, we desire a formal model of fault severity that strongly agrees with average human judgments. In order to build such a model, we must first establish that web application faults have varying severity levels.
3.
FAULT SEVERITY STUDY
In this section we will examine the consumer-perceived severity of real-world and seeded faults to show that they have varying levels of human-perceived severity. Fault seed-ing is a complementary technique to code coverage in mea-suring test suite efficacy [4, 32]. Such faults may be manually seeded by humans, or automatically injected by source code mutation, with the goal of exercising a test suite and mea-suring the number of faults uncovered. The current state of the art in web application testing research evaluates test-ing methodologies under the assumptions that all uncovered faults have equal importance to users [3, 8, 11, 20, 28, 29, 30, 31]. We will refute the underlying assumption in fault-based testing of web applications that a test suite that detects more faults than its competitors will necessarily detect more bugs that may drive away consumers, by demonstrating that both real-world and seeded faults have varying severity levels.
3.1
Setup and Definitions
We tested our hypothesis that web application faults have varying severity levels by designing a human study where
Description Severity Rating I did not notice any fault 0 I noticed a fault, but I would return to 1 this website again
I noticed a fault, but I would probably 2 return to this website again
I noticed a fault, and I would not return 3 to this website again
I noticed a fault, and I would file a complaint 4
Figure 1: Severity scale for web application faults.
subjects rate their perceived severity of various potential web application faults as if they were consumers of the web application under examination. We obtained 400 real-world faults for evaluation by the users in our study. These faults were presented to human subjects who were asked to rate the severity of each fault on the 5-point scale in Figure 1, similar to other work [6, 35]. Severity was intentionally left formally undefined.
Each potential fault was presented as a scenario triple:
• thecurrent webpage
• adescription of the task the user is trying to accom-plish in the scenario, and the action taken
• thenext webpage (may or may not contain a fault) This before-and-after scenario view is necessary because web application faults depend on context and the use of web applications is inherently dynamic. For example, a scenario may begin with a login screen for a website, and include the description that the user has just entered a valid username and password and is going to click thelogin button. The human participants are then shown the next page, as if, according to the scenario narrative, they had clicked the button. Human subjects were presented screenshots of both thecurrentandnextpage, and were allowed to toggle freely between them before deciding on a severity rating.1
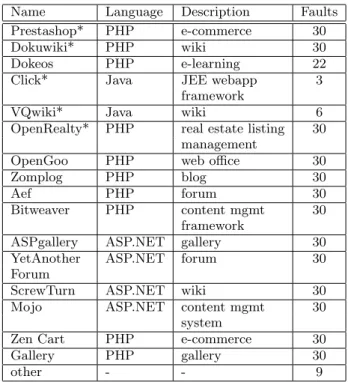
Our 400 real-world faults originated from the bug report databases of 17 open-source benchmarks summarized in Fig-ure 2. Faults were systematically selected from these repos-itories by starting from the newest repository entry and working backwards until 15 faults had been successfully re-produced, and then repeating this process from the oldest fault moving forward (four of the benchmarks yielded fewer than 30 viable faults). We selected faults in this manner, as opposed to choosing faults randomly, to replicate faults encountered in both immature and more established web applications. We used the description of the fault in the repository to obtain or replicate a screenshot and the HTML code of thecurrent and next pages, along with a scenario description. Screenshots included in bug repository defect reports were used unchanged as thenextimage if applicable (e.g., given sufficient image resolution). To capture as many classes of faults as possible, we relied on written instructions to study participants in thedescription to provide supple-mental bug report detail that may not be obvious simply
1Data available at http://www.cs.virginia.edu/~kld5r/ webfault/
Name Language Description Faults Prestashop* PHP e-commerce 30
Dokuwiki* PHP wiki 30
Dokeos PHP e-learning 22 Click* Java JEE webapp 3
framework
VQwiki* Java wiki 6
OpenRealty* PHP real estate listing 30 management
OpenGoo PHP web office 30
Zomplog PHP blog 30
Aef PHP forum 30
Bitweaver PHP content mgmt 30 framework
ASPgallery ASP.NET gallery 30 YetAnother ASP.NET forum 30 Forum
ScrewTurn ASP.NET wiki 30 Mojo ASP.NET content mgmt 30
system
Zen Cart PHP e-commerce 30 Gallery PHP gallery 30
other - - 9
Figure 2: Real-world web applications mined for faults. All applications were sources for human-reported faults taken from defect report reposito-ries, as well as non-faults taken from indicative us-age. An asterisk indicates an application used as a source for manually- and automatically-injected faults.
by examining acurrent image. For example, we instructed users that they had permissions to access a given item when such context was necessary for the fault to be recognized. Similarly, when making a purchase through a shopping cart we frequently instructed participants to imagine they had successfully completed checkout steps 1–3 before showing them the fault in step 4 related to information entered on step 1 on thecurrent screen. In addition to these 400 real-world faults, 100 non-faults2 (i.e., indicative, fault-free
be-havior) were obtained from all of the benchmarks.
Coupled with the 400 real-world faults and 100 non-faults, we also employed 200 manually-injected faults and two hun-dred automatically-injected faults equally distributed among those benchmarks in Figure 2 denoted by an asterisk, plus one other PHP-based web forum called Vanilla [1]. Manual injection was accomplished by instructing three graduate students with programming experience to insert one fault into the source code at a time, and then re-running the test suite according to the methodology in Sprenkle et al. [28]. Automatic source code mutation was similarly used to gen-erate mutant versions with one inserted fault per test suite run. Mutants were generated using a previously-published mutation methodology [9].
2Non-faults were included in the study as a baseline, and to
avoid human subjects from assuming every screenshot pair they examine necessarily contains a defect. 100 such non-faults were included to minimize the number of such less-interesting cases subjects examined, as non-faults did not contribute to the models of fault severity in our experiments.
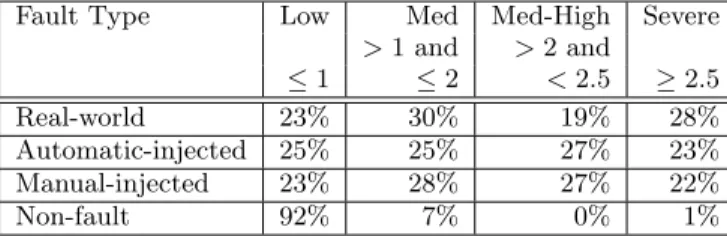
Fault Type Low Med Med-High Severe >1 and >2 and ≤1 ≤2 <2.5 ≥2.5 Real-world 23% 30% 19% 28% Automatic-injected 25% 25% 27% 23% Manual-injected 23% 28% 27% 22% Non-fault 92% 7% 0% 1%
Figure 3: Average severity ratings from a total of 12,600 human judgments of 900 scenarios.
The 400 real-world faults were combined with the 400 in-jected faults and the 100 non-faults to yield a corpus of 900 scenarios. The scenarios were then randomly assigned into groups of 50. Each survey participant rated a group of 50 scenarios without knowing whether any particular sce-nario was a real-world fault, an injected fault, or a non-fault. Users were instructed to use their real-life experience with web applications to decide on a severity for each potential fault they viewed. Users were advised to assume that any perceived fault would be fixed upon a subsequent return to the webpage, but that this would occur at an unknown point between the present time and up to one year in the future; vendors may take over one hundred days to patch even se-rious problems [36, p.13].
386 anonymous subjects, a majority from the undergradu-ate population at the Universities of Virgina and Maryland, participated in the study. Approximately half of the subjects were first year computer science students, with the rest be-ing second year or higher. Subjects were compensated with either $5 upfront or chance to participate in prize drawings of up to $150.
3.2
Study Results
Over 12,600 severity scores were recorded from 386 hu-mans, with at least 12 votes per fault. Figure 3 presents the distribution of severities across real-world, manually-injected, automatically-manually-injected, and non-faults. We note that all faults, whether real or injected, do not have the same severity, refuting the underlying assumption that each de-tected fault in fault injection-based testing is equally impor-tant. This implies that a test suite that uncovers more faults may not necessarily produce an application with higher cus-tomer retention, because the underlying severity of the dis-covered faults are unknown. In Section 5 we will present an automated tool that can correctly predict consumer-perceived fault severities with high precision, and could be combined with fault-injection based testing to provide a more accurate representation of test suite efficacy.
In addition, Figure 3 reveals the underlying distribution of fault severities for manually and automatically-injected faults in our experiments. Based on Figure 1 and the hu-man survey data, we definesevere fault to be one with an average human severity rating of 2.5 or higher. Seeded faults had almost equal numbers of faults in each severity category, indicating that fault-injection based techniques, overall, are a reasonable way of measuring test suite quality in that they do test faults with varying severities, although fault injection alone without a severity analysis cannot be used to compare two testing suites if one is interested in characterizing con-sumer retention.
We cannot assume that the severity distribution of the real-world faults in our study is necessarily that of web ap-plications in general. For example, low-severity faults are likely under-represented in the bug reporting databases from which we drew our scenarios. The true severity distributions of real-world faults is likely to be similar to those found in other work [22], where the most severe faults were found to be less than 3% of faults overall in industrial settings. For example, in an interview with a developer working on a web-based product similar to Microsoft Hotmail, Yahoo Mail and Windows Vista’s Weather Gadget, with 250-300 million customers daily and over two million lines of code, we learned that severe faults made up approximately 7% of all of the faults witnessed. Although these studies may suf-fer from the problems of developer self-reporting previously mentioned in [22], we consider them to support the argu-ment that real-world faults have varying consumer-perceived severity distributions.
4.
MODELING FAULT SEVERITIES
In the previous section we established that web appli-cation faults, whether real-world or seeded, differ in their severity as perceived by consumers. In this section we show that we can successfully build a model of consumer-perceived severity that agrees with human judgments more often than humans agree with each other. Such a model can be used by developers of web applications to prioritize faults they plan to fix, or by researchers to compare various testing method-ologies.
4.1
Modeling Fault Severity
Although web applications themselves vary widely in their presentation and functionality, web application faults do have common features [9]. For example, a stack trace may be displayed to users for a number of reasons, across a number of platforms, in unrelated web applications. We note that such errors in deeper levels of the application are commonly corralled into user-visible HTML [24, 30]. Based on this in-sight, we present 18 boolean surface features of web applica-tion browser output that may be indicative of faults, which represent a subset of commonly-occurring properties of web application errors. We then demonstrate that these fea-tures can accurately model consumer-perceived fault sever-ity: given the presence or absence of these 18 features, our model produces a severity judgment that agrees strongly with the average human judgment. The features used in our model are summarized below:
• Arithmetic Calculation Error. Generally for shop-ping cart based applications, any error in calculating the amount paid, shipping, taxes, discount applied, quantities ordered, etc.
• Blank Page. An empty page containing no informa-tion or text.
• 404 Error. An error experienced when theURLis not found; the words “404” or “not found” must appear somewhere on the page.
• Cosmetic. An error that does not affect the function-ality of the website, such as a typo, small formatting issues, bits of visible HTML code, etc.
• Language Error. An inability to encode or correctly convert characters between languages, usually result-ing in incorrect characters on the page.
• Cascading Stylesheet Error. An error in loading the stylesheet between thecurrent andnext pages.
• Code on the Screen. Any error that results in pro-gramming language code appear on screen, including any error referring to a line number (with the excep-tion of visible HTML code).
• Other Error/Error Message. Either any error mes-sage, or any error that cannot be classified in any other category.
• Form Error. Missing, malformed, or extra buttons, form fields, drop-down menus, etc, including incor-rectly validating forms.
• Missing Information. Any part of a webpage that is missing, not including images.
• Wrong Page/No Redirect. An unexpected page is loaded.
• Authentication. Any errors that occur during login.
• Permission. Any errors occurring with respect to user permissions in an application, such as access being incorrectly denied to a user.
• Session. An unexpected session timeout or other session-related issues.
• Search. Errors occurring during searching, such as incorrectly printing out results.
• Database. Any errors associated with accessing or querying a database, including visible SQL code being displayed.
• Failed Upload. An error during the upload of an item.
• Missing Image. A missing image.
A fault may lead to a combination or constellation of fea-tures. For example, a small warning message on a page that does not interfere with its main functionality may be con-sidered both anError MessageandCosmetic. In our study we found that no fault was labeled as having more than six features.
Our model relies on human annotators to label each fault with its respective features. We recruited 12 graduate stu-dents, with an average of 12, 4, and 12, years of program-ming, web programprogram-ming, and web usage experience respec-tively, as annotators. Our model calculates the consumer-perceived severity associated with a web application fault via a manually-constructed decision tree that we engineered through an analysis of 300 of the 400 real-world faults de-scribed in Section 3.1, chosen at random. The remaining 100 faults were held out to serve as testing data.
For example, a fault labeled as having anError Message
and anArithmetic Calculation Error would be predicted to have high severity. An example of such a situation is a mis-calculation of shipped quantities in a shopping cart with a seemingly unjustified associated warning message to the
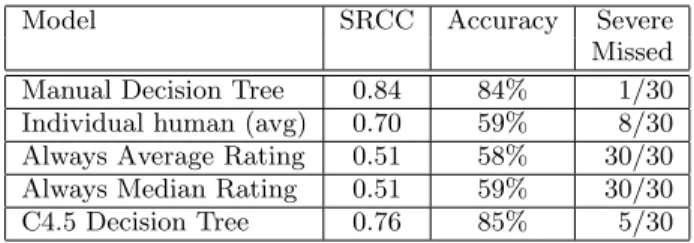
Model SRCC Accuracy Severe Missed Manual Decision Tree 0.84 84% 1/30 Individual human (avg) 0.70 59% 8/30 Always Average Rating 0.51 58% 30/30 Always Median Rating 0.51 59% 30/30 C4.5 Decision Tree 0.76 85% 5/30
Figure 4: Average Spearman’s Ranking Correlation Coefficient (SRCC) between each model and the av-erage human over 100 held-out faults. A correlation of 1 indicates perfect agreement, while a correlation of 0 indicates no correlation (as in the case of ran-dom guessing). An SRCC score of more than 0.5 is considered to have moderate to strong correla-tion for a human study [13]. Our model agrees with the average human judgment more strongly than hu-mans agree with the average human judgment. An “Accurate” prediction differs with the average hu-man value by less than 0.75.
user. Similarly, perceiving a fault asCosmetic would result in an assignment of low to moderate severity, even when combined with other features. The complete decision tree is available3; it includes 29 conditional judgments. We sum-marize its behavior by noting that Arithmetic Calculation Errors,Errors Message / Other Errors,Authentication and
Permission issues,Code on the Screen, and loading the in-correct page or no page at all are associated with more con-sumer dissatisfaction than other fault features.
4.2
Human-annotated Model Performance
We tested our predictive model on the remaining 100 real-world faults excluded from our training dataset. Although we use the terminology of training and testing data, our model does not require further training for subsequent test data sets. The process of training refers simply to the initial construction of the model’s decision tree. In this section we compare the model’s performance to that of subjects from our human study (see Section 3). We also included a number of baseline approaches, such as always predicting the average fault severity4, always predicting the median fault severity5,
and a C4.5 decision tree [37] derived automatically from the same training set of human annotations used to construct our manual decision tree model.
We desire a model that agrees with the average human severity rating for this group of faults at least as often as the humans themselves agree. We therefore measured the Spear-man’s Ranking Correlation Coefficient (SRCC) [33] between each technique and the average human severity rating for
3
http://www.cs.virginia.edu/~kld5r/webfault/ decisionTree.txt
4
The average and median fault severities were derived by first determining the average fault severity for each individ-ual fault (i.e. the goal fault severity that all models attempt to predict). These goal severities were then averaged across all 100 testing faults, yielding theAlways Average Ratingof 1.86.
5
The median severity rating of the goal 100 testing faults was also calculated, yielding the Always Median Rating of 1.93
each fault, averaged across all 100 held-out testing faults. Figure 4 presents our results.
Our predictive model outperforms all other baselines with a SRCC of 0.84, including the average performance of indi-vidual humans. Although there is a strong positive correla-tion between individual human judgments of faults severity and the average perceived severity of a particular fault, we are able to significantly outperform humans at this task with our feature-based decision tree model. The average standard deviation of human judgments on a single fault was 0.95 on a 5 point scale; a single human opinion of fault severity is therefore inherently unreliable. As a concrete and typical example, in one moderate fault, four respondents said they would return to the website, seven would probably return, while two would not. In the two most severe faults included in our study, while 22 users would file a complaint and/or not return to the website, three respondents reported that they probably would visit the website again. Relying on any one human observer, such as a developer involved in making the web application, is therefore not necessarily a reliable way to infer actual severities of faults in the spirit of prioritizing them for resolution. Figure 3, which includes the consumer-perceived severity ofnon-faults, demonstrates that humans are not always accurate at judging the average severity: they sometimes perceive even non-faults as faults. The goal of our approach is to model the average human judgment of a fault, rather than to model any particular hu-man judgment. As a result, although the average standard deviation of human judgments was 0.95 on a 5 point scale, per fault, our model is deterministic and we are interested in modeling the average, not the variance.
We define an accurate prediction as lying within 0.75 of the goal severity score, a round cutoff that is less than both the standard deviation and variance. Our model accurately predicted the severity of 84% of the faults in our sample. Figure 4 lists the percentage of accurate severity judgments for all models across our test set of 100 faults, as well as the number of severe faults missed. We argue that missing severe faults is more dangerous than assigning high severity to non-severe faults, as the former may translate into lost consumers, while the latter only increases the number of faults a developer may have to examine. Overall, our model missed only one high-severity fault, and in cases where our prediction was not within 0.75 on the five point scale, it generally predicated the fault as too severe, rather than not severe enough. Notably, it outperforms an average human in terms of severe fault identification, implying that it is more reliable to use our model to assign fault severities of web ap-plication faults than to rely on any one arbitrary individual. Although the C4.5 model outperforms the manual decision tree by 1% in terms of overall accuracy, it incorrectly labels 5 severe faults as non-severe because it is less conservative than the human-assisted model. Therefore, using the C4.5 model would likely result in missing many severe faults, po-tentially resulting in high consumer dissatisfaction.
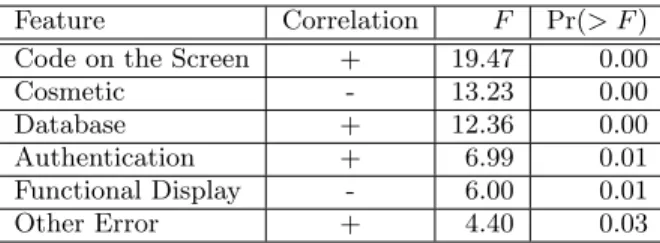
We also investigated the predictive power of our features by performing an analysis of variance when predicting high-severity faults, shown in Figure 5 (only features with a significant main effect are listed). Web application faults that were labeled by humans as having any type of code on the screen (e.g.,Code on the Screen and Database errors) were most significantly correlated with high-severity faults. Faults labeled asCosmeticwere very unlikely to be
consid-Feature Correlation F Pr(> F) Code on the Screen + 19.47 0.00
Cosmetic - 13.23 0.00
Database + 12.36 0.00
Authentication + 6.99 0.01 Functional Display - 6.00 0.01 Other Error + 4.40 0.03
Figure 5: Analysis of variance (ANOVA) showing relative feature predictive power for finding high-severity faults. F denotes the F-ratio, which is the square root of variance explained by that feature over variance not explained. Higher F values af-fect the model more. The last column denotes the significance level of F (i.e., the probability that the feature does not affect the model); values below 0.05 are significant.
ered severe, and faults during authentication and those that displayed error messages were judged as more likely to result in customer loss than other types of faults.
5.
PREDICTING FAULT SEVERITY
Having established that it is possible to model web ap-plication fault severities with greater precision than an in-dividual human might, we now show that it is possible to automate such a model, and thus not rely on human annota-tions, without a large sacrifice in accuracy. In this section we describe an automated tool that examines HTML output to assign a fault severity to a faulty web page when compared with the expected oracle output. We evaluate our tool not only by comparing its precision to that of the human-based model of Section 4, but also with an experiment to show the potential savings developers may experience when using our tool to prioritize faults.
5.1
Experimental Setup
Our automated tool relies on the same decision tree archi-tecture as the human-dependent model, but approximates the 18 features’ labels automatically by examining HTML code. For example, the Wrong Page feature is set if the only HTML elements shared between two pages are<html>,
<head>, and<body>elements, while aMissing Imageoccurs if the<img> srcattribute has changed or is missing between the two webpage versions. Our tool first builds a mapping between the correct, expected HTML output and the faulty HTML using the diffX [2] algorithm, and then examines the unmapped nodes between the two webpages in order to determine which features apply. This use of features based on a mapping between before-and-after web page HTML is similar in spirit to approaches that reduce the cost of regres-sion testing for web-based applications [9].
Because our automated tool cannot mimic many context-dependent human judgments, we modify our decision tree model from Section 4.1 to focus more on those features that are likely to be correctly labeled. For example, while a hu-man may distinguish between an incorrect page being loaded and a missing image, our tool will frequently assign both the wrong page and missing image attributes in such an in-stance, as the incorrect HTML input happens to be missing the image by virtue of it being the wrong page.
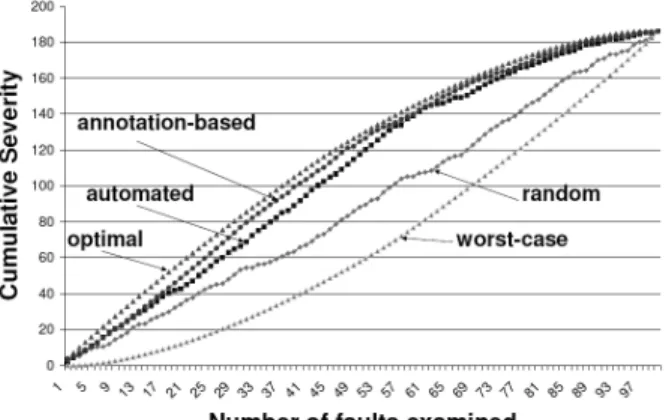
Captur-Figure 6: Cumulative severity over time when prioritizing faults by our automated and human-annotated models versus random priority, optimal priority, and worst-case priority.
ingCosmeticchanges proved to be challenging to automate; consequently, the automated model attemps to conserva-tively flag such occurences by assuming changes that involve certain features, such as code being printed on the screen, are assumed to be non-cosmetic.
To measure the potential savings associated with our au-tomated tool, we consider a scenario where a developer has limited resources to fix known faults between releases of the application, and therefore wishes to prioritize those faults by severity. We assume that focusing on high-severity faults, in-stead of low and medium severity faults, will result in greater customer retention. However, addressing each fault requires developer effort.
We therefore measure savings in terms of the number of non-severe faults our automated tool can correctly flag which do not need to be addressed. We must simultaneously avoid failing to flag faults that are severe and thus need prefer-ential attention. We use the same 100 held-out real-world faults from Section 4.2 as our dataset so as to compare the automated model’s performance to that of the annotation-based model of the previous section. Our automated model has a Spearman Ranking Correlation Coefficient of 0.78 with average human judgments, placing it between our manual model (0.84) and human themselves (0.70) in terms of agree-ment with the norm.
5.2
Automated Model Performance
Figure 7 summarizes our automated model’s performance on our dataset of 100 real-world faults. While it drops in accuracy by 1% when compared to the human-annotated model, the SRCC scores are comparable, and exceed that of humans on average. Our automated model missed no severe faults, and it is able to identify 39 out of 70 non-severe faults to be assigned a lower developer priority. While the human-annotated model correctly finds 61 such faults, note that it requires initial investment of humans manually examining each webpage output. Our automated model is conservative in that it will generally label any fault with a medium-high or high severity as severe and requiring human attention. Consequently, we are able to achieve high accuracy with this approach, estimating true severities to within 0.75, al-though our savings decrease by about a third, due to
situ-Model Accuracy Severe Non-Severe Missed Correct Automated Model 83% 0/30 39/70 Annotation-based Model 84% 1/30 61/70 Individual Human (avg) 59% 8/30 53/70 Always Average Rating 58% 30/30 70/70 Always Median Rating 59% 30/30 70/70 C4.5 Decision Tree 85% 5/30 65/70
Figure 7: Performance of our automated model against our human-annotation-based model and other baselines. Accuracy is the percentage of faults predicted within 0.75 of the average human rating. Severe Missed refers to the number of severe faults incorrectly labeled, Total Saved to the number of non-severe faults correctly labeled.
Feature Correlation F Pr(> F)
Cosmetic - 30.51 0.00
Functional Display + 27.12 0.01 Code on the Screen + 22.83 0.00 Other Error + 5.32 0.02 Wrong Page - 5.31 0.02
Figure 8: Analysis of variance showing feature pre-dictive power for our automated model with no hu-man annotation. F denotes the F-ratio, which is the square root of variance explained by that fea-ture over variance not explained. Higher F values affect the model more. The last column denotes the significance level of F (i.e., the probability that the feature does not affect the model); values below 0.05 are significant.
ations where a medium-severity fault is predicted as severe and requiring developer attention, while still falling within the 0.75 cutoff. Figure 6 presents the cumulative severity over time when prioritizing the 100 faults in our dataset us-ing our automated model and human-annotated model ver-sus using random prioritization, optimal prioritization, and worst-case prioritization. Both models significantly outper-form random prioritization.
This experiment demonstrates that our automated tool has high accuracy with respect to finding severe faults, and can save developer resources by allowing them to prioritize the faults they will fix by severity. As explained in Section 3, our dataset has a relatively high proportion of severe faults (28%). It is likely that web applications experience severe faults as a small percentage of their total fault distribution, and therefore, our automated tool may deliver even higher savings in industrial contexts, by obviating the need to ex-amine a larger proportion of non-severe faults.
Additionally, we investigated the predictive power of our features by performing an analysis of variance when pre-dicting high-severity faults with our automated tool. Fig-ure 8 lists the significant featFig-ures (cf. FigFig-ure 5). Again, web application faults that had Code on the Screen were significantly correlated with high severity faults. Similarly,
6.
SUMMARY OF EXPERIMENTS
Consumer-perceived fault severities have not been thor-oughly studied in the context of web application testing. In Section 3, we conducted a human study on 400 real-world faults, 400 injected faults, and 100 non-faults to demonstrate that faults have varying severity distributions with an aver-age standard deviation of 0.95, and refute the underlying assumption in fault injection that all faults are equally se-vere (a standard deviation of 0.0).
Having demonstrated that faults have varying severities, in Section 4 we presented a predictive model of fault sever-ity that correlates strongly with consumer-judged seversever-ity, agreeing with humans more often than they agree with them-selves. Because this initial model relies on human annotators to label surface features of faults, in Section 5 we introduced an automated fault severity predictor that operates without manual effort. Both the human-annotation-based and au-tomated fault severity predictors have comparable levels of agreement in terms of labeling fault severity to that of hu-mans, with SRCC scores of 0.84, 0.78, and 0.70 respectively. Because our human-annotation-based model is more precise in terms of predicting fault severity than an average human, we propose that developers use this model to replace human judgments of fault severity when prioritizing test cases, and in situations where such resources are unavailable, the au-tomated model be used with a minimal loss of accuracy.
In a hypothetical defect report prioritization scenario, our automated model and annotation-based models we were able to correctly identify (and thus free developers from focusing on) 39 and 61 out of 70 non-severe defect reports, and thus 39% and 61% of all faults could be correctly de-prioritized. We posit that in industry application our savings could in-crease to 53% and 84%, respectively, due to the lower preva-lence of severe faults in practice as reported in Section 4 and [22].
6.1
Threats to Validity
Although our annotation-based model outperforms hu-mans at predicting consumer-perceived fault severity, and shows significant savings in terms of prioritizing severe and non-severe faults, it is possible that our results may not gen-eralize to industry practice. It is possible that the bench-marks from which faults were selected from are not indica-tive of web applications in general. To mitigate this threat, we chose a large number of benchmarks from varied domains and using varied languages. Other work [18] has examined a similar number of real-world faults to construct a web fault taxonomy, and in our analyses we discovered many faults of the same equivalence classes in our dataset. In addition, it is possible that our human study participants are not in-dicative of average consumers. For example, our population of undergraduate students may attach a different severity to shopping cart monetary miscalculations than would aver-age consumers. Conversely, our feature annotation requires specific expertise (e.g., to distinguish between general Er-ror Messages and Database ones) to form the basis of our model; to mitigate this threat we used a dozen experienced graduate students. Similarly, human voters may have been subject to training effects; that is, subjects may have been influenced in their latter severity ratings by having already rated some number of faults. We explicitly measured the variance of votes on the first 25 faults in each set, and com-pared it to the variance of the rest of the 50 faults subjects
viewed; these values are 1.60 and 1.58 on a 5-point scale, respectively, indicating that training effects are minimal in our experiment and there is no need to repeat the measure-ment for the same subjects in a different fault presentation order.
We may also not have been able to accurately capture or simulate user experiences using screenshots with our current-description-next scenario idiom. Although we either used screenshots submitted with bug reports, or carefully con-structed screenshots given the description of the fault in the bug repository, it is possible that we may have not been able to replicate faults exactly. When constructing our own screenshots we erred on the side of conservatism, only in-troducing the error exactly as described and in the context of the application; for example, we may not have known to color an error message in red unless such instructions were found in the text of a bug report. There are also classes of errors such a scenario cannot capture, such as an email not being delivered; neither our survey nor our models can speak to such errors. Our work is only able to focus on user-visible errors, due to the surface features we rely on for fault anal-ysis. Although we have reason to believe that many types of errors ultimately manifest themselves as HTML [24, 30], this current model is unable to judge the severity of faults that do not eventually turn up in user-visible output. Such non-visible faults, however, are likely to compose a small percentage of faults overall: in a sample of over 200 real-world faults mined from the bug repositories of the bench-marks from this work, using the same mining methodology as for the 400 real-world faults, 90% percent of the reported defects were user-visible.
7.
RELATED WORK
Causes of failures in web applications have been examined by Pertet and Narasimhan [23]. Software failures, operator error, hardware and environmental failures, and security vi-olations were identified as four failure categories, with sig-nificant causes including system overload, resource exhaus-tion, complex fault recovery routines, and system complex-ity. Although manifestations of failure, such as partial or total site unavailability, system exceptions, incorrect results, data loss, and performance slowdown, were identified, no at-tempt was made to assign severities to failures. By contrast, our models assign consumer-perceived severities to web ap-plication faults.
Strecker and Memon examine the relationship between faults, test suites, and fault detection for GUIs [34]. They also note that it is a common research practice to assume all faults are equally severe, and that determining what a truly representative fault set looks like is difficult. Elbaum
et al.[12] try to account for factors such as fault severity as a metric in test suite construction, but they give no guidelines for measuring fault severity besides the time required to lo-cate or correct a fault, lost business, or damage to persons or property — figures which are difficult to calculate in general or in advance. Ma and Tian present a defect classification framework to analyze web errors and identify problematic areas in the context of reliability improvement [17]. Their research relies on web server logs to extract information, rather than studying browser output. Although they men-tion defect severity as a classificamen-tion attribute, like Elbaum
et al. they provide no guidelines for how to measure this fea-ture. Our work provides annotation-based and automated
models to accurately assign consumer-perceived severities to web application faults.
Ostrand and Weyuker examine faults distributions in large industrial software systems, under which fault severities were assigned according to fix priority [21]. In follow-up work [22], they discovered that such developer-reported severities were highly subjective, and often inconsistent, inaccurate, or mo-tivated by political considerations. Ultimately, they rejected using such a developer-reported fault severity measure in their fault localization predictor due to these concerns. Our work relies on consumer-perceived fault severities to avoid many of the problems associated with self-reported devel-oper assignments.
Zhou and Leung analyze object-oriented design metrics for predicting fault severity. They discovered that features such as methods per class, coupling between object classes, and lack of cohesion in methods were statistically signifi-cant across fault severity in their exploratory study. Our model relies on HTML output, rather then web applica-tion source code, to predict fault severity. In addiapplica-tion, their study [38] may suffer from subjectivity problems in report-ing fault severity [22], which we attempt to avoid by relyreport-ing on consumers to judge fault severity rather than developers. Fault taxonomies for web applications are an area of ac-tive research, and only a few preliminary models exist. For web applications in particular, Guo and Sampath identify seven types of faults as an initial step towards web fault classification [15]. Marchetto et al. validate a web fault taxonomy to be used towards fault seeding [18], organized by characteristics of the fault that generally have to do with what level in the three-tiered architecture the fault occurred on or some of the underlying, specific web-based technolo-gies (such as sessions). In these fault classifications [15, 18] there is no explicit concept or analysis of severity — while some categories of faults may, in general, produce more er-rors that would turn customers away, this consideration is not explored. We provide two models that accurately as-sign consumer-perceived fault severities to web application faults.
In [10] we explored how the model of fault severity in this work can be applied to software engineering practices, in an effort to focus on high-severity faults. Under the assumption that few to no resources are available for testing activities (given the extreme resource constraints of the web applica-tion development environment), [10] investigates the rela-tionship between high severity faults and the visual presen-tation of errors and their causes. For example, even though developers may be unable to prevent all errors from man-ifesting in a user-visible fashion, they can often choose to display defects elegantly in the form of a popup or cus-tomized error message, as opposed to a stack trace; the former presentations are associated with lower consumer-perceived severity. We also found that even a coarse-grained, na¨ıve test suite that searches for error keywords or large amounts of missing text between expected and actual test case output could be successfully used to detect severe faults, as these often present with a stack trace or predictable error message and occur during maintenance activity to databases or filesystems. Finally, we examined the ability of various test suite reduction methodologies and preservation of fault severity exposure, and were able to reproduce well-known results: applying test suite reduction approaches does not
seem to significantly impact the ability of the test suites to reveal severe faults.
8.
CONCLUSION
Web applications are often untested due to extreme re-source constraints during their development [26]. We believe that providing a consumer-perceived fault severity model may allow developers to prioritize faults according to their likelihood of impacting consumer retention, and thus encour-age web-application developers to test more effectively. We obtained 12,600 human judgments of 400 real-world faults, 400 injected faults, and 100 non-faults and discovered that relying on a single human observer to judge the severity of a particular fault is unreliable.
Consequently, we present two models of fault severity that outperform humans in terms of accurately predicting the av-erage severity of web application faults. Our first model re-lies on human annotations of fault surface features, and suc-cessfully identified 87% of non-severe faults to be assigned low priority in our experiments. We also presented a fully automated model that can obviate examining 55% of such faults. Both models are significantly better than humans at flagging severe faults for examination, and can therefore replace or augment humans when assigning fix priorities to faults encountered in web application development and test-ing. In the future we hope to generalize our analysis of web application faults to include other types of interactive soft-ware, such as graphical user interfaces. Having a successful predictive model of consumer-perceived fault severity will also allow us to explore ways to map software engineer-ing practices, testengineer-ing techniques, and current technologies to high-severity faults.
9.
REFERENCES
[1] Vanilla - free, open-source forum software.
http://vanillaforums.org/, 2010.
[2] R. Al-Ekram, A. Adma, and O. Baysal. diffX: an algorithm to detect changes in multi-version XML documents. InConference of the Centre for Advanced Studies on Collaborative research, pages 1–11. IBM Press, 2005.
[3] S. Artzi, A. Kiezun, J. Dolby, F. Tip, D. Dig, A. Paradkar, and M. D. Ernst. Finding bugs in dynamic web applications. InISSTA ’08: Proceedings of the 2008 international symposium on software testing and analysis, pages 261–272, 2008.
[4] R. V. Binder.Testing object-oriented systems: models, patterns, and tools. Addison-Wesley Longman
Publishing Co., Inc., Boston, MA, USA, 1999. [5] D. Boeth. An analysis of the future of B2B
e-commerce. Inhttp: // www. ftc. gov/ bc/ b2b/ comments/ PPRo% 20Statement. pdf, September 2009. [6] R. P. Buse and W. R. Weimer. A metric for software
readability. InISSTA ’08: Proceedings of the 2008 international symposium on Software testing and analysis, pages 121–130, New York, NY, USA, 2008. ACM.
[7] ClickZ. B2b e-commerce headed for trillions. In
http: // www. clickz. com/ 986661, 2002.
[8] H. Do and G. Rothermel. A controlled experiment assessing test case prioritization techniques via mutation faults. InICSM ’05: Proceedings of the 21st
IEEE International Conference on Software Maintenance, pages 411–420, 2005.
[9] K. Dobolyi and W. Weimer. Harnessing web-based application similarities to aid in regression testing.
ISSRE ’09: Proceedings of the 20th International Symposium on Software Reliability Engineering (ISSRE’09), November 2009.
[10] K. Dobolyi and W. Weimer. Addressing high severity faults in web application testing.The IASTED International Conference on Software Engineering, February 2010.
[11] S. Elbaum, S. Karre, and G. Rothermel. Improving web application testing with user session data. In
International Conference on Software Engineering, pages 49–59, 2003.
[12] S. Elbaum, A. Malishevsky, and G. Rothermel. Incorporating varying test costs and fault severities into test case prioritization.International Conference on Software Engineering, pages 329–338, 2001. [13] L. L. Giventer.Statistical Analysis for Public
Administration. Jones and Bartlett Publishers, 2007. [14] K. Grannis, E. Davis, and T. Sullivan. Online sales to
climb despite struggling economy according to shop.org/forrester research study, September 2009. [15] Y. Guo and S. Sampath. Web application fault
classification - an exploratory study. InESEM ’08: Proceedings of the Second ACM-IEEE international symposium on Empirical software engineering and measurement, pages 303–305, 2008.
[16] Internet World Stats. World internet usage statistics news and world population stats. In
http: // www. internetworldstats. com/ stats. htm, September 2009.
[17] L. Ma and J. Tian. Web error classification and analysis for reliability improvement.J. Syst. Softw., 80(6):795–804, 2007.
[18] A. Marchetto, F. Ricca, and P. Tonella. Empirical validation of a web fault taxonomy and its usage for fault seeding. InIEEE International Workshop on Web Site Evolution, pages 31–38, Oct. 2007. [19] J. Offutt. Quality attributes of web software
applications.Software, IEEE, 19(2):25–32, Mar/Apr 2002.
[20] J. Offutt, Y. Wu, X. Du, and H. Huang. Bypass testing of web applications. InInternational
Symposium on Software Reliability Engineering, pages 187–197, Nov. 2004.
[21] T. J. Ostrand and E. J. Weyuker. The distribution of faults in a large industrial software system. InISSTA ’02: Proceedings of the 2002 ACM SIGSOFT international symposium on software testing and analysis, pages 55–64, 2002.
[22] T. J. Ostrand, E. J. Weyuker, and R. M. Bell. Where the bugs are. InISSTA ’04: Proceedings of the 2004 ACM SIGSOFT international symposium on software testing and analysis, pages 86–96, 2004.
[23] S. Pertet and P. Narasimhan. Causes of failure in web applications. Technical report, Carnegie Mellon University Parallel Data Lab, December 2005.
[24] S. Pertet and P. Narsimhan. Causes of failures in web applications. Technical Report CMU-PDL-05-109, Carnegie Mellon University, Dec. 2005.
[25] R. Pressman. What a tangled web we weave [web engineering].IEEE Software, 17(1):18–21, January/February 2000.
[26] F. Ricca and P. Tonella. Testing processes of web applications.Ann. Softw. Eng., 14(1-4):93–114, 2002. [27] L. M. Silva. Comparing error detection techniques for
web applications: An experimental study. InNCA ’08: Proceedings of the 2008 Seventh IEEE International Symposium on Network Computing and Applications, pages 144–151, 2008.
[28] S. Sprenkle, E. Gibson, S. Sampath, and L. Pollock. Automated replay and failure detection for web applications. InAutomated Software Engineering, pages 253–262, 2005.
[29] S. Sprenkle, E. Hill, and L. Pollock. Learning effective oracle comparator combinations for web applications. InInternational Conference on Quality Software, pages 372–379, 2007.
[30] S. Sprenkle, L. Pollock, H. Esquivel, B. Hazelwood, and S. Ecott. Automated oracle comparators for testing web applications. InInternational Symposium on Reliability Engineering, pages 117–126, 2007. [31] S. Sprenkle, S. Sampath, E. Gibson, L. Pollock, and
A. Souter. An empirical comparison of test suite reduction techniques for user-session-based testing of web applications. InInternational Conference on Software Maintenance, pages 587–596, 2005. [32] S. E. Sprenkle.Strategies for automatically exposing
faults in web applications. PhD thesis, 2007.
[33] S. E. Stemler. InPractical Assessment, Research and Evaluation, volume 9, 2004.
[34] J. Strecker and A. Memon. Relationships between test suites, faults, and fault detection in gui testing. In
ICST ’08: Proceedings of the 2008 International Conference on Software Testing, Verification, and Validation, pages 12–21, 2008.
[35] R. Likert. A technique for the measurement of attitudes. InArchives of Psychology, volume 22, page 55, 1932.
[36] Symantec. Internet security threat report. Inhttp: // eval. symantec. com/ mktginfo/ enterprise/ white_ papers/ ent-whitepaper_ symantec_ internet_ security_ threat_ report_ x_ 09_ 2006. en-us. pdf, Sept. 2006.
[37] I. H. Witten and E. Frank.Data Mining: Practical machine learning tools and techniques. Morgan Kaufmann, second edition, 2005.
[38] Y. Zhou and H. Leung. Empirical analysis of
object-oriented design metrics for predicting high and low severity faults.IEEE Transactions on Software Engineering, 32(10):771–789, 2006.