1
proIMS Overview
proAsset system engineering Burggrafenlacher Weg 14 Germany 65428 Rüsselsheim +49 (0) 6142 8706-0
[email protected]
www.proasset.net
2
Content 1 proIMS Suite ... 3 2 proIMS Architecture ... 4 2.1 Design Concept ... 4 2.2 Design Criteria ... 62.3 Distributed system concept ... 7
2.4 On line configuration ... 8
3 Software Concept ... 9
4 proIMS Base Node and RTDB ...10
4.1 building blocks ...10
4.2 High Speed Design ...11
4.3 Security ...11
4.4 Save Communications to avoid Data Loss ...11
4.5 Hight Availability ...11
4.6 Integration of Third Party RTDB’s ...12
5 proIMS Historical data base ...13
6 proIMS Tools ...14
6.1 proIMS Excel ...14
6.2 proIMS Workbench ...16
6.3 proIMS Trend ...17
7 proIMS Calculation Engines ...18
7.1 Embedded High Speed ...20
7.2 MATLAB Integration ...21
7.3 proIMS Calculation libraries ...24
8 proIMS Report Server ...37
9 proIMS Presentation Framework ...38
9.1 proIMS Dashboard ...38
9.2 proIMS Editor ...41
3
1 proIMS Suite
proIMS is a web-based information management system for all kind of real time processes and calculations.
proIMS is built on real time databases (RTDB) with embedded HIGH-SPEED calculation
engines for real-time calculations (RTC) and real-time optimization (RTO)
proIMS is an INDUSTRY 4.0 solution for integrating process data and calculated data into one central system when there are multiple control rooms, laboratories and geographically distributed production sites.
proIMS is an archiving and WEB 4.0-based reporting system for process data like process values, events, messages, batch and lab data. Data is presented independently from underlying systems and is available worldwide via Intranet or Internet connections.
proIMS is available as a light version for smaller industrial applications and can be expanded to high-available cluster solutions for multiple production sites and enterprise solutions. proAsset’s biggest application is the 3 Gorges hydro power plant at the Yangtze River in China with an installed power of 18 Gigawatt. proIMS collects 300000 signal values per minute for storage in the proAsset process database.
4
2 proIMS Architecture
2.1 Design Concept
proIMS is a performance manager and information management system for the process industries for storage and real-time calculations.
It’s a real-time infrastructure platform for real time data, process signals and events. proIMS brings operational data from the plant floor to the enterprise level.
business critical data are handled by:
✓ Collecting real time and event driven data from multiple sources across plant or enterprises
✓ Store the data in real time or historical databases
✓ Applying advanced analytical calculations and business rules to analyze the data
✓ Applying business rules applications
✓ Presents the data by using web technologies Therefore, the suite design is a five-tier architecture:
Tier 1 Data collection Tier 2 Database Tier 3 Calculation Tier 4 Business Rules
5
The suite interconnects the process and control level with ERP systems applying business rules and applications to be a unique information platform for all management levels of the organization.
6
2.2 Design Criteria
The design of the system data flow concept follows the following ideas: ✓ Availability
all data available at the various interfaces should be in principle available at all locations and for all subsystems of the network
✓ Simplification
Standardization of communication and local connections, including defined functions as well as parameterization, simplifies the integration and reduces maintenance expenses.
✓ Reliability of operation
Increased reliability, reduced malfunctions and minimized troubleshooting efforts by clear separation of network and interfacing tasks and inbuilt diagnosis functions
✓ Guaranteed future
Expandability thanks to modern technologies and TCP/IP, WEB 4.0, Industry 4.0
✓ Easy Configuration
The system can be configured centrally. The configuration is online. If a data link for a signal or a group of signals is configured it is immediately available in the configured locations without system rebooting or other actions at any place of the network.
7
2.3 Distributed system concept
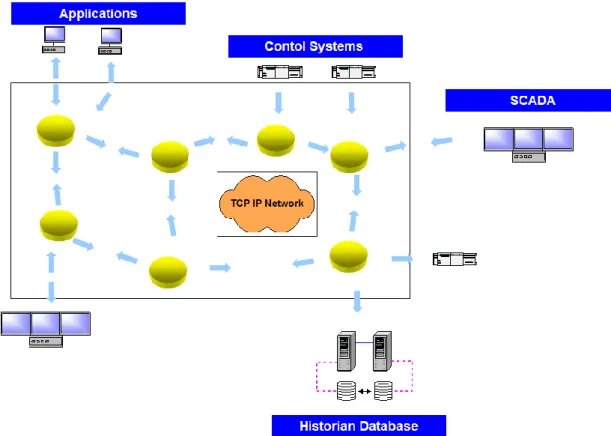
proIMS is based on nodes connected to TCP/IP networks.
Figure 1 proIMS Node Concept
The nodes form a unique communication platform for process industries. It interconnects heterogeneous systems that need to exchange time series data, signals and events. It is a middleware based on a client/server model that distributes data between nodes. The modules simplify and standardize the communication, guarantee smooth integration and reduce maintenance expenses significantly.
Users of all levels of the organization can connect to the secure and highly available data servers to use a full suite of web-based software for data visualization, validation,
trending, reporting and collaboration.
The node concept is based on the software module proIMS Base Node. It is a
8
All the nodes together form a network for signals and events, which, similar to a layer in the OSI model. Each node performs all essential functions such as automatic data
synchronization, data recovery in case of communication loss, store & forward and redundancy within the network.
Each node includes also a real-time data base including a fast scan storage. The number of tags for this database is unlimited by licenses and the storage time can be configured from several days up to several years only limited by the available disk space.
All common interfaces are available to collect data from sub systems or distribute data to all systems which need data.
The system ensures that all data (signals, events and alarms) available at a certain location can be transferred to each other location in the network equipped with a base node.
If data is necessary at other locations of the network just a new node needs to be connected to the TCP/IP network, Intranet or Internet to distribute available data to this location or collect data from.
2.4 On line configuration
The proIMS nodes can be configured online centrally or locally. No shutdown of any process or any other action is necessary to avoid data loss during or after configuration.
9
3 Software Concept
ProIMS Predictive Maintenance
Matlab proIMS Base
proIMS Measurement
proIMS Data Reconciliation proIMS Mass Balancing
Data Collector
Water TPA
external Systems RTDB Real Time Database OPC XML UA Interface
SOA Adapter Application Modules Operator Log Calculation Engine Alarm Management proIMS Components Applications Hydro Power Oil And Gas proIMS Optimization
ProIMS APC
Business Intelligence
RDB Historical Database Report Server KPI Manager Document
manager
MS SQL Server Workflow Manager Formular Manager
proIMS Modules Block Diagram
Web Based Dash Board Board Trends Realtime Views Reports Alarm View Operator Log Manual Entries KPI Document Access
10
4 proIMS Base Node and RTDB 4.1 building blocks
The following drawing shows the building blocks of each node.
proIMS Base Node building blocks
Standard interface to the process is either an OPC DA/AE Client or an OPC UA. Other interfaces are available. Please refer to the document proIMS Interfaces.
Collected data is stored first in fast scan storage. This is a virtual memory storage with a resolution of 10 nanoseconds. The fast scan storage ensures that even bulk data with more than 2.500.000 values per minute can be stored first in the fast scan storage before updating the RTDB in order to avoid data loss.
Collected data can be pre-processed in real time using an embedded calculation engine. This calculation engine can be used to perform basic calculations like data cleansing, unit transformations or flow compensations.
The configuration data of the node is stored in an embedded license free MS SQL Server express. Configuration Signals Event Direct X D3DX
Legend Realtime Database RTDB Direct Control System OPC OLE Process Control IF Interfaces
connections to DCS and SCADA systems proIMS BASE Node Block Diagram
RTDB
Calculation Engine
Fast Scan Storage
Interfaces OPC UA/AE/DC/HDA
11
The node communicates with other nodes or proIMS applications via web services using http or https services.
4.2 High Speed Design
proIMS RTDB is consequently designed for high speed storage and calculations: ✓ 64-bit data base
✓ Virtual memory (Fast Scan Storage) to cover bulk updates ✓ Embedded calculation engine with access to virtual memory ✓ High speed calculations using graphic processing units ✓ Embedded parallelisation for multi core operations
4.3 Security
Data storage of the data base can be configured to be encrypted, to avoid unauthorized access or assure that process data cannot be changed after stored in the database.
4.4 Save Communications to avoid Data Loss
Due to the distributed architecture, the RTDB transfers and collects data from other proIMS Nodes.
In case of communication loss, the latest communication status is saved and after the communication comes up again all data transfers for the lost communication time will be automatically recovered.
Additionally, there is another gap that needs to be solved. Assume you are using the proIMS Calculation Server, which calculates calculated time series data from the raw data on a minutely data basis, for e.g. a mass balancing application. To ensure the consistency of the calculation, each proIMSapplication has inbuilt measures to wait until the data recovery after cluster roll over or communication loss is finished to ensure also the integrity of the calculated data.
4.5 Hight Availability
The current proIMS installations show that even a non-redundant configuration is one of the most reliable systems in the operations software infrastructure. The following
measures are consistently built into the product line: ✓ Online Backup and Archive
✓ Built-in Real Time Database (Data Buffering) ✓ Data replication using server farms
12
✓ Microsoft Cluster certified
All of the measures can be used flexibly in combination with each other. Depending on how important the data or the budget of the customer nearly is all kind of high
availability architectures can be designed.
Refer to the description of the distributed node concept for more details.
4.6 Integration of Third Party RTDB’s
proIMS has connectors to different common real-time databases: ✓ ABB cpmPlus History
✓ OSI Soft PI RTDB
✓ Uniformance® Process History Database
Moreover, with the proIMS base node a heterogeneous RTDB enterprise architecture can be harmonized to one unique overall IMS system, using the same tools to handle tags and date from RTDB databases of different vendors.
13
5 proIMS Historical data base
proIMS Historical is a relational historical database that stores raw data, reconciled signals and alarms or events for long term usage. Aditionally signal values can be compressed on a minutely, hourly, daily monthly or yearly basis.
Signals and alarms collected from proIMS Base modules are stored in a relational database (MS SQL Server, ORACLE, MySQL) and MongoDB.
14
6 proIMS Tools
6.1 proIMS Excel
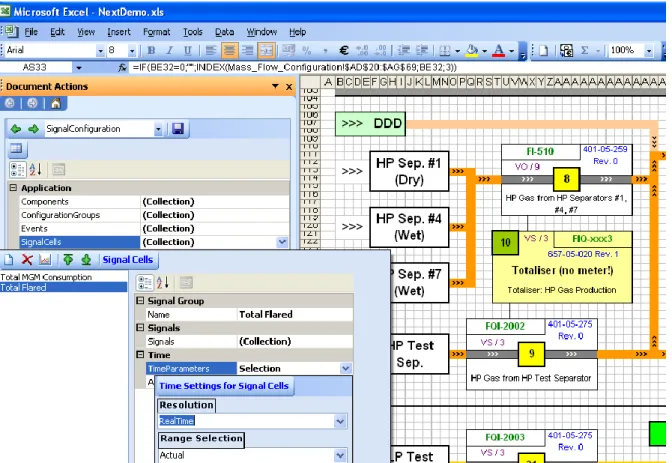
proIMS Excel is a Microsoft Excel add-in that enables information retrieval directly into an Excel spread sheet.
proIMS Excel provides a graphical user interface to retrieve real time or calculated data from the proIMS RTDB’s and offers powerful tools for gathering, monitoring, analyzing and reporting process data. Data retrieval with the add-in can be combined with the computational and formatting capabilities of Microsoft’s Excel.
15
Figure 2 IMS proIMS Excel
proIMS Excel is also the base for the report tools. Reports defined in Excel will be automatically and periodically generated using the proIMS Report Server.
16
6.2 proIMS Workbench
The proIMS Workbench is the central administration tool for the suite. A proIMS RTDB network consisting of several nodes can be administrated and configured from one single point using the workbench.
The configuration includes: ✓ node administration ✓ interface configuration
✓ administration of process parameters like units or ranges ✓ signal configuration
✓ calculation functions ✓ etc.
17
6.3 proIMS Trend
proIMS Trend includes a set of trend modules for different purposes: ✓ Standard Trends with a wide range of configuration features ✓ Configurable customized Trends for special features
Mass Balances Reconciled Values Vibrations
Spectrum Analysis Polar and Radar Charts 3D Charts
18
7 proIMS Calculation Engines
proIMS Calculation Engines are services to calculate new time series data based on the raw data stored in the real-time database. The results are stored in the historical database or as tags in the RTDB as new time series data with new signal names.
Two different calculation engines are available: ✓ proIMS Calculation Server
✓ proIMS Simulation Server
The calculation server is a service that runs online in real time and calculates new minutely, hourly or daily values based on the process data stored in the RTDB. It’s a background service for online calculated signals.
The simulation server is a background service for look ahead models. Based on a real process image future process states are calculated.
Both engines are using different calculation libraries for different purposes. The following drawing shows an overview about the available libraries.
19
Calculations are created with the proIMS Equation Editor, which is part of the proIMS Dashboard. The configuration is web based. Mathematical models or calculations can be created or changed online using modern Web technologies.
proIMS Equation Editor proIMS Workbench
Standard Calculation Libraries
Matlab
Matlab Compiler SimuLink
SimuHydraulics Sim Power Systems
proIMS Oil and Gas
proIMS Server
proIMS Simulation Server
Applications
proIMS Power Plants proIMS Water proIMS Predictive Maintenance
proIMS Matlab proIMS Measurements
proIMS Optimization proIMS APC proIMS Components proIMS Mass Balancing proIMS Data Reconcilation
proIMS Basic
20
7.1 Embedded High Speed
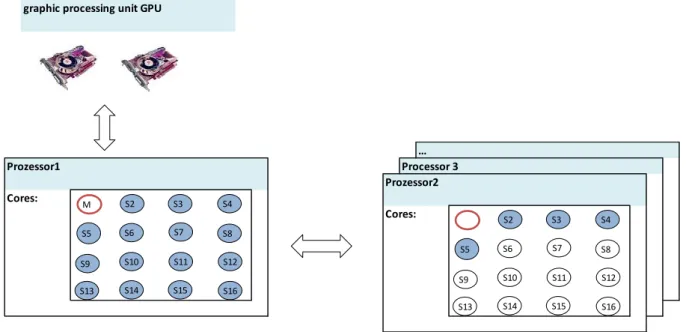
The proIMS calculation servers have built-in algorithms to distribute computation tasks either to the different cores of a server or to use graphical processing units (GPU).
The usage of parallel cores is commonly used by optimization solvers, to parallelize the computation tasks. Big matrix transformations as they occur for example for complex linearization algorithms can be computed much faster using the GPU instead of an additional core.
graphic processing unit GPU
Cores: Cores: Prozessor1 Prozessor2 … Processor 3 S3 S5 S13 S6 S9 S2 S4 S7 S8 S12 S14 S15 S16 S11 S10 M S3 S5 S13 S6 S9 S2 S4 S7 S8 S12 S14 S15 S16 S11 S10
21
7.2 MATLAB Integration
The proIMS calculation engine has its own formula editor to specify mathematical
equations, which can be bound to process variables and calculate new calculated values, which are stored in the proIMS RTDB in the same way as values coming from the
process.
MATLAB functions are handled in the same way like the functions of the formula editor. MATLAB (matrix laboratory) is a numerical computing environment and fourth-generation programming language. Developed by Math Works, MATLAB allows matrix manipulations, plotting of functions and data, implementation of algorithms, creation of user interfaces. More information can be found under the following link: www.mathworks.com
Although MATLAB is intended primarily for numerical computing, an optional toolbox uses a symbolic engine, allowing access to symbolic computing capabilities. An additional package, Simulink, adds graphical multi-domain simulation and Model-Based Design for dynamic and embedded systems.
In 2010, MATLAB had around two million users across industry and academia. MATLAB users come from various backgrounds of engineering, science, and economics. MATLAB is widely used in academic and research institutions as well as industrial enterprises.
The following drawing shows how MATLAB is integrated into proIMS framework. For mixed integer non-linear programming problems MINLP the MATLAB extension MIDACO will be used because of its extensive capability for parallelization. More information can be found under the following link:
22
To include a new function to the calculation services the following steps are required: 1.)A process engineer designs a mathematical model about a certain process
device, using the various capabilities of Model
2.)Once the model is tested and approved, it will be compiled using the MATLAB compiler. The compiler output is a proIMS mathematical library which will be read by the proIMS calculation engines
3.)A web designer designs an animated process graphic based on the inputs and outputs of the model. The process graphics are designed with the integrated proIMS design tool proIMS proCanvas framework.
The approach to design a new model in combination with an animated process graphic ensures that the graphic can be easily dragged to a process view of the proIMS dashboard to view and trouble shoot the equations of the model.
4.)A Control engineer can use the models by assigning process and calculated signals to it using the proIMS Workbench and deploy it to the various calculation engines.
23
5.)Dashboards can be created using the new designed process graphics animated with actual process signals or calculated results.
Besides the standard Matlab components and the optimization toll box other Matlab components have been used for our calculation libraries:
• Simscape™ provides an environment for modeling and simulating physical systems spanning mechanical, electrical, hydraulic, and other physical domains. It provides fundamental building blocks from these domains that can be assembled into models of physical components, such as electric motors, inverting op-amps, hydraulic valves, and ratchet mechanisms. • SimHydraulics® provides component libraries for modeling and simulating
hydraulic systems. It includes models of hydraulic components, such as pumps, valves, actuators, pipelines, and hydraulic resistances. These components are used by the applications to simulate their models. Pipeline supply and water supply systems are modeled using SimHydraulics.
• SimPowerSystems™ provides component libraries and analysis tools for modeling and simulating energy systems. This module is base for the proIMS Hydro Power application module.
• Model Predictive Control Toolbox provides functions, an app, and Simulink blocks for systematically analysing, designing, and simulating model
predictive controllers (MPCs). You can specify plant and disturbance models, horizons, constraints, and weights. The toolbox enables to diagnose issues that could lead to run-time failures and provides advice on tuning weights to improve performance and robustness. By running different scenarios in linear and nonlinear simulations, controller performance can be evaluated. This toolbox is base for the proIMS Predictive APC library.
• Optimization Toolbox™ provides functions for finding parameters that minimize or maximize objectives while satisfying constraints. The toolbox includes solvers for linear programming, mixed-integer linear programming, quadratic programming, nonlinear optimization, and nonlinear least squares. You can use these solvers to find optimal solutions to continuous and
discrete problems, perform trade-off analyses and incorporate optimization methods into algorithms and applications. This toolbox is base for the proIMS Optimization library.
24
7.3 proIMS Calculation libraries
proIMS provides the following mathematical libraries:
PROIMSBASIC
includes basic functions for unit conversion, logic, KPI’s and the proIMS editor to define user defined functions
PROIMSMATLAB
includes functions to include MATLAB libraries to proIMS:
PROIMSMEASUREMENTS
- Includes various functions to handle, convert and compensate process measurement devices substance data, thermodynamic physical states, feed flow composition, tank calculations, basic calculation for pipelines like line packing etc.
PROIMSCOMPONENTS
- Includes fundamental calculation blocks for process devices like separators, compressors, pumps etc.
PROIMSMASSBALANCING
- Includes functions for mass balancing
PROIMSDATA RECONCILIATION
- Includes functions to reconcile process values
PROIMSOPTIMIZATION
- Includes linear and nonlinear models to optimize processes
PROIMSAPC
- Includes models to build model predictive advanced process controllers
PROIMS PREDICTIVE MAINTENANCE
25
7.3.1 proIMS Measurement
proIMS Measurement is a comprehensive mathematical package to harmonize data flow for typical process measurements. It includes all mathematical and statistical formulas needed for the different steps to perform balances such as but not limited:
✓ Calculation for gas properties like density,
formation volume factor, viscosity and density component tracking ✓ Meters
All kind of compensation starting from simple pressure temperature compensations up to more complex methods like GERG or AGA8. Volume compensation for liquid measurement (Liquid Meter
Compensation)
Volume compensation for gas measurement (Gas Meter Compensation) ✓ Tanks
Tank Models Vapor Space Mass Vapor Space Volume Floating Roof Adjustments Transfer Calculations ✓ Volume Corrections
Tank Shell Correction Calculation
Material Volume Correction Factor (VCF) ✓ Tolerance
✓ Tank Tolerance based on Uncertainties ✓ Measurement Tolerance
✓ Single-Phase Flow Formulas ✓ Multi-Phase Flow Formulas
26
7.3.2 proIMS Components
Includes fundamental calculation blocks for process device: ✓ Models for gas quality tracking like
splitters, separators, mixers
✓ Digital twin models for devices used in the gas production process like compressors
pumps
cooler and heater pipelines
valves heaters
27
7.3.3 proIMS Mass Balancing and Data Reconciliation
Figure 3 Mass Balance Configuration
In any modern pipeline system, chemical plant, petrochemical process or refinery, hundreds or even thousands of variables such as flow rates, temperatures, pressures, levels, compositions, etc. are routinely measured and automatically recorded for the purpose of process control, online optimization or process economic evaluation. proAsset facilitates the collection and processing of a great volume of data, often sampled with a frequency of minutes or even seconds.
The evaluation of data requires at first step the storage of data. The second step is the measurement harmonization because
Process measurements are inevitably corrupted by errors during the measurement, processing and transmission of the measured signal. different measurement methods, units and pre-evaluation process control
system of flow computers
With the packages proIMS Mass Balancing and Data Reconciliation step 2 can be performed. The data can be exploited for further evaluation to improve the accuracy and consistency of process data through a systematic data checking and treatment.
proIMS Mass Balancing can be used as integrated part of the calculation server running in the background and calculating the balance of a process in real time.
28
Additionally, with proIMS Excel the user can define his own balances and calculate them on demand.
7.3.4 proIMS Mass Balancing
The Mass Balancing application usually needs several steps.
1. Calculation of pipeline and tank inventories using the proIMS pipeline
management module or collecting the data from other systems connected to the MIS like tank management or leak detection systems
2. The second step is used if the related flows are not compensated. Using the
methods implemented in the proIMS measurement packages flows will be compensated.
3. Calculation of the individual mass flow rate for measured flows (this step is
not required if the original measurement signal is already representing mass flow rates). The calculated mass flow rates are stored as "derived" Tags to the data base and can afterwards be accessed by the proIMS tools exactly like "original" Tags (e.g. Signal Tags).
4. Calculate the balances
For a defined balance area, where "n" flows are crossing the area's border and where "n-1" mass flow rates are available and known, the missing flow rate of the last flow can be calculated (as a mass flow rate, too).
This is the principle of calculating "resulting" mass flow rates of unmeasured flows. The result is correct as long as the "known" values are correct and no
29
further flows occur.
Also these resulting mass flow rates are stored to the data base as "calculated" Tags and can afterwards be accessed by the proAsset tools exactly like "original" and "derived" Tags.
Graphical Tools are available for configuration. The results can be displayed in all kind of proIMS Reports and Web displays.
Normally the balances are calculated online in real time with configurable time delay of 2 to 4 minutes.
Additionally, the user has the ability to re-calculate the balances over a certain time period to reflect configuration changes.
7.3.5 proIMS Data Reconciliation
Reconciliation provides estimates of process variables based on combining measurement information with process knowledge (such as mass and energy balances) in the form of equations and inequality constraints. If the constraints are correct, and measurements fit assumptions about their noise, the resulting estimates will be better than those obtained just from raw measurements. Data reconciliation is generally accomplished by
formulating a least-squares optimization problem to minimize a weighted sum of the measurement adjustments and solving it. At the basic stage the quality of the individual signal tags is checked and the quality information is stored together with the signal value in the data base.
The data reconciliation software supports the user in the following areas: 1. Gross Error Detection
Gross errors are significant deviations from assumptions such as assumed error probability distributions in the case of measurements, or incorrect constraints. Gross errors in measurements typically reflect instrument
2 1 1
)
(
/
)
)(
(
= =−
−
−
=
n i n i i i ix
y
y
x
x
x
Figure 5 Reconciliation30
failures, bias errors, or unusual noise spikes if only a short time averaging period is used. An example of a gross error due to an incorrect constraint is the unexpected presence of a significant leak. Gross errors invalidate the assumptions made in data reconciliation, so it is important to detect them and remove their effects. Otherwise, the reconciled estimates could actually be worse than just using the raw data. So, gross error detection is generally done prior to final estimates, although some techniques modify the problem to try to minimize the damage done by the gross errors.
2. Redundancy Analysis
Redundancy analysis determines which measurements could be estimated from other variables using the constraint equations. Without redundancy, data reconciliation cannot use the constraints to improve the estimates, so recognizing a lack of redundancy is key to knowing if the data reconciliation will be useful.
3. Data Reconciliation using least-squares optimization
For a defined balance area, where "n" flows are crossing the area's border and where "n" mass flow rates are available and known, the total of all flows (entering flows added, leaving flows subtracted) must be near to zero as long as all "n" mass flow values are correct. The acceptable deviation from zero is depending on the accuracies of all individual flows used in the balance. Thus, the accuracies of all related measurements must be defined in the Tags' property data base, and in all calculation steps, these
accuracies are to be tracked for signal values respectively calculated for result values and balance totals. This is automatically performed once the calculation equations are
configured.
Concerning the final results of a two stage Data Reconciliation for "n" flows the following cases are possible:
If the individual quality of more than one flow is bad, Data Reconciliation is not possible for all "n" flows.
If the individual quality of exact one flow is bad, Data Reconciliation is not possible for all "n" flows, but the resulting mass flow rate of the "bad quality" Tag can be calculated.
If the individual quality of all "n" flows is good, the Data Reconciliation balance can be calculated and its result can be judged:
If the deviation from zero is outside of the limit, the qualities of all "n" Tags are marked as "good, reconciliation failed",
If the deviation from zero is inside the limit, the qualities of all "n" Tags are marked as "reconciled", which is the best possible quality.
31
The benefit of this type of Data Reconciliation is to get an alarm if a measurement device is not obviously failed but is having a "hidden" drift. In this case the wrong measurement cannot be identified by the application, but the alarm will indicate, that one of the "n" flows is having a "hidden" defect.
If more than "n" measurements are available for a balance area of "n" flows, then even the identification of the defect flow measurement could be possible under certain conditions.
The balances and the resulting qualities are stored as calculated Tags in the proIMS RTDB. The values and qualities of these "mirrored" Tags can be displayed in all kinds of proIMS Reports or WEB Displays.
32
7.3.6 proIMS optimization
The proIMS optimization module includes linear as well as non-linear tools to solve large scale optimization problems.
The following solvers are available: ✓ Linear Solvers
Linear programming Quadratic programming
Mixed integer linear programming ✓ Heuristic Solvers
Tabu search including DP techniques ✓ Non Linear
Mixed integer non-linear programming MINP
All solvers are programmed using the MATLAB engine.
All solvers are designed offering an efficient parallelization strategy.
7.3.7 proIMS Predictive Maintenance
The proIMS Predictive Maintenance library includes functions and algorithms that allows equipment users and manufacturers to assess the working condition of machinery,
diagnose faults, or estimate when the next equipment failure is likely to occur. When you can diagnose or predict failures, you can plan maintenance in advance, better manage inventory, reduce downtime, and increase operational efficiency.
Signal processing and dynamic modeling methods that build on techniques such as spectral analysis and time series analysis let you preprocess data and extract features that can be used to monitor the condition of the machine. To estimate a machine's time to failure, you can use survival, similarity, and trend-based models to predict the RUL.
33
The library is build on general methods used for all kind of maintenance applications:
One or more models are assigned to special industrial units to determine KPI’s which are used to inform about the status of the unit.
The library includes models for
✓ hydro power
hydro power units of all kind, transformers,
SF6 components Generators
✓ Oil and gas
Pumps
Electrical motors Air compressors
Gas and steam turbines Filters
Separators
34
The methods can be divided in four types of different predictive maintenance applications:
✓ Basic Maintenance Indicators
The basic indicators use conventional methods like running hours or switching cycles.
✓ Remaining Useful Life (RUL) Estimation
Estimating the remaining useful life (RUL) of a machine can help you predict its time-to-failure, optimize maintenance schedules, and manage spare inventory efficiently.
35
The type of RUL estimation algorithm used depends on the condition indicators extracted from the data, as well as how much data is available.
The library provides multiple algorithms for estimating RUL. If you only have data corresponding to when your machine failed, you can use survival analysis to determine RUL. Similarity-based models can be used when you have run-to-failure data for your machines that captures how sensor measurements change from healthy to failed states. When you have data corresponding to condition indicator values over time, as well as information about critical threshold values that indicate failure for those condition indicators, you can fit linear and exponential time-series models to your data to forecast when these thresholds will be crossed.
✓ Condition Indicators
Condition indicators are features extracted from your data using time, frequency, and time-frequency domain methods. The values of these indicators typically change in a predictable manner as the health of the machine degrades over time with use. Engineers can detect the onset of faults in your machine and take remedial action by continuously monitoring these indicators for significant changes. Condition indicators are also used to estimate remaining useful life and to develop diagnostics using machine learning techniques such as classification and regression.
The methods in the library provides capabilities for designing condition indicators using both signal-based and model-based approaches. You can calculate time-frequency moments that enable you to capture time-varying dynamics, which are
36
frequently seen when analyzing vibration data. To detect sudden changes in data collected from machines displaying nonlinear behavior or characteristics, you can compute features based on phase-space reconstructions that track changes in your
system’s state over time.
It also provides a wide range of capabilities for feature extraction using statistical methods, spectral analysis, time-series modeling, modal analysis, and other methods for designing condition indicators.
✓ Machine Learning Algorithms
Machine Learning algorithms are a new approach in predictive maintenance. They are not field proven. However, when using this models with one of the
conventional models like condition indicators they can be a useful supplement to conventional models.
37
8 proIMS Report Server
The proIMS Report Server creates predefined reports periodically or on request based on the time series values stored in the real time or historical database.
proIMSReports are created with a special tool based on MS Excel.
Excel is the de facto standard among spreadsheet systems. Together with Excel proIMS offers a very wide functional range to create reports. The features include displays, calculation of cell values and the creation of spreadsheets. A broad range of statistical and mathematical functions can be used combined with graphic display options such as multi-channel trend curves, pie and bar charts as well as 3D views and surfaces.
Via Excel the proIMS reporting can be easily integrated in the entire Office environment. The following can be created in the following formats:
Excel Reports HTML reports PDF reports
proIMS Report Server requires no elaborate settings. It is designed ready to go. The report obtains the available data points from proIMS databases at a touch of a button. The setting up, creation of templates is done without any programming, only a basic knowledge of Excel is needed.
38
9 proIMS Presentation Framework
The proIMS Web Framework is a set of tools which can be used to display the content generated by the proIMS Framework as HTML Page for Web browser or as WebPart for Windows SharePoint server and Cloud applications.
9.1 proIMS Dashboard
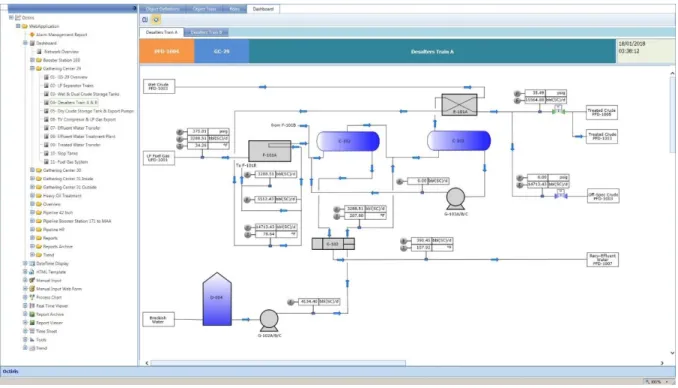
The main user interface to the proIMS is a comprehensive dashboard, which is an easy to read, multi-page, real-time user interface, showing a graphical presentation of the current status (snapshot) or historical trends of the plants to enable instantaneous and informed decisions to be made at a glance.
Based on an equipment and asset tree on the left, visual components can be dragged and dropped to the information area of the web page and animated with data form the databases.
39
Figure 6 proIMS Dashboard
The dashboard has a set of predefined components, which are integrated to the underlying RTDB. RTDB Signals can be easily assigned to the board components and displayed.
40
The current dashboard frame work contains the following elements:
✓ Trends
✓ Charts (Area Charts, Bar Charts, Stock Charts, Gauges) ✓ Process Views
✓ Tables to show Realtime or historical data ✓ Manual Input component
✓ Operator LOG formulars
✓ HTML5 Applets to display logos, headers or HTML content ✓ KPI Displays and summaries
✓ Integrated document manager ✓ Excel Export of process date
41
9.2 proIMS Editor
The proIMS editor is a WYSIWYG web-based tool to configure the dashboards.
Process Views, trends, manual input pages and other proIMS elements can be easily configured.
Based on this elements comprehensive Dashboards can be created using drag and drop functionality.
42
10 proIMS Communication Framework
The proIMS communication framework is used to transfer data to third party applications like SAP or
Maximo.
It consists of an OPC UA interface which has adapters to Microsoft Biztalk server to communicate
with other applications.
MS BizTalk Server OPC UA OPC UA Maximo Adapter Maximo OPC UA -- BizTalk Adapter
43
11 Appendix Interfaces 11.1Available Interfaces
The following process interfaces are available: ✓ OPC Client Alarms & Events
✓ OPC Client Data Access for Signals
✓ OPC XML
✓ OPC HA Historical Archive Client ✓ OPC UA (DA; AE, HDA)
✓ OPC UA MES ✓ BACNET Client ✓ IEC 60870-5-101 ✓ IEC 60870-5-102 ✓ IEC 60870-5-103 ✓ IEC 60870-5-104 ✓ IEC 61850 ✓ TASE 2
✓ ABB Advant Transit Node
✓ ABB GCOM ✓ SNMP ✓ Modbus ✓ Profibus ✓ ProfiNet ✓ CanBus ✓ MES
Additionally, to distribute data to other process applications the following interfaces are available:
✓ OPC Server Alarms & Events
✓ OPC Server Client Data Access for Signals
✓ OPC Historical Data Access to retrieve data from the real time database ✓ OPC XML Data Access
✓ OPC UA
✓ Bacnet Server
✓ Web Service for XML data extraction
✓ SQL and ODBC via embedded SQL database
11.2Linked Systems
44
✓ ABB
✓ ABB Enterprise Historian
✓ ABB GCOM
✓ ABB Masterbus
✓ ABB Masterpiece
✓ ABB Information Management System
✓ ABB AC 400, 450, 460
✓ ABB 800XA
✓ Alan Bardley
✓ Alan Bradley ControLogix
✓ Alan Bardley MicroLogix
✓ Aspentech ✓ Aspentech CIM21 ✓ Aspentech Sectim ✓ Baily ✓ Baily Infi90 ✓ Emerson ✓ Emerson ROC ✓ Emerson Floboss ✓ Emerson RS3 ✓ Foxboro ✓ Foxboro AP50/AP51 ✓ Foxboro AW70 ✓ Foxboro FOXSCADA ✓ GE/GE FAPUC ✓ GE Mark V/VI ✓ GE FANUC FIX ✓ GE FANUC iHistorian ✓ GE FANUC iFix ✓ GE Fanuc 9030 series ✓ GE Fanuc 9070 series ✓ GE Fanuc Poficy ✓ GE Fanuc RX7 ✓ GE Fanuc Versamax ✓ Honeywell ✓ Honeywell TDC3000 ✓ Honeywell TPS ✓ Honeywell PHD ✓ Invensys
✓ Invensys Wonderware Intouch
✓ Invensys FOXSCADA
✓ Invensys I/A
45
✓ Johnson Controls
✓ Johnson Controls N1
✓ Johnson Controls N2
✓ National Instruments
o National Instruments LabView
✓ Rockwell ✓ Rockwell MicroLogix ✓ Rockwell FlexLogix ✓ Rockwell CompactLogix ✓ Rockwell PLC ✓ Rockwell ControlLogix ✓ Rockwell SoftLogix ✓ Siemens ✓ Siemens S5 ✓ Siemens S7 ✓ Siemens TI 505, 545, 565,576 ✓ Siemens Sinaut ✓ Siemens MICRO ✓ Siemens Simatic ✓ Siemens Teleperm M ✓ Siemens OpenPMC ✓ Triconex ✓ Triconex Tricon ✓ Triconex Trident ✓ Yokogawa ✓ Yokogawa Centrum CS