• No results found

Case Mix, Costs, and Outcomes: Differences Between Faculty and Community Services in a University Hospital

N/A
N/A
Protected

Academic year: 2021

Share "Case Mix, Costs, and Outcomes: Differences Between Faculty and Community Services in a University Hospital"

Copied!
27
0
0

Loading.... (view fulltext now)

Full text

Figure

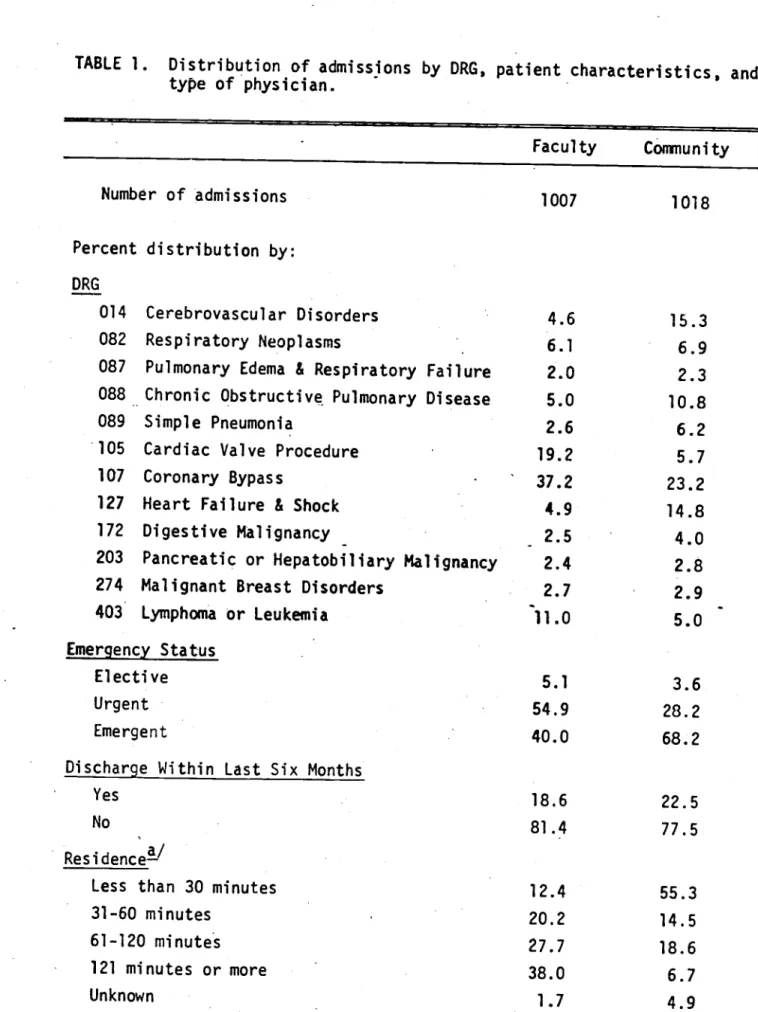
TABLE 1. Distribution of admissions by DRG, patient characteristics and.
TABLE 2. Cost per admission by type of physician. DRG Total Faculty c  om-munity  Faculty-Community  Differ- ential-Cs) (5) (%) 014 Cerebrovascular Disorders 5,829 9,097 4,865 87.0 082 Respiratory Neoplasms 4,828 5,274 4,439 18.8
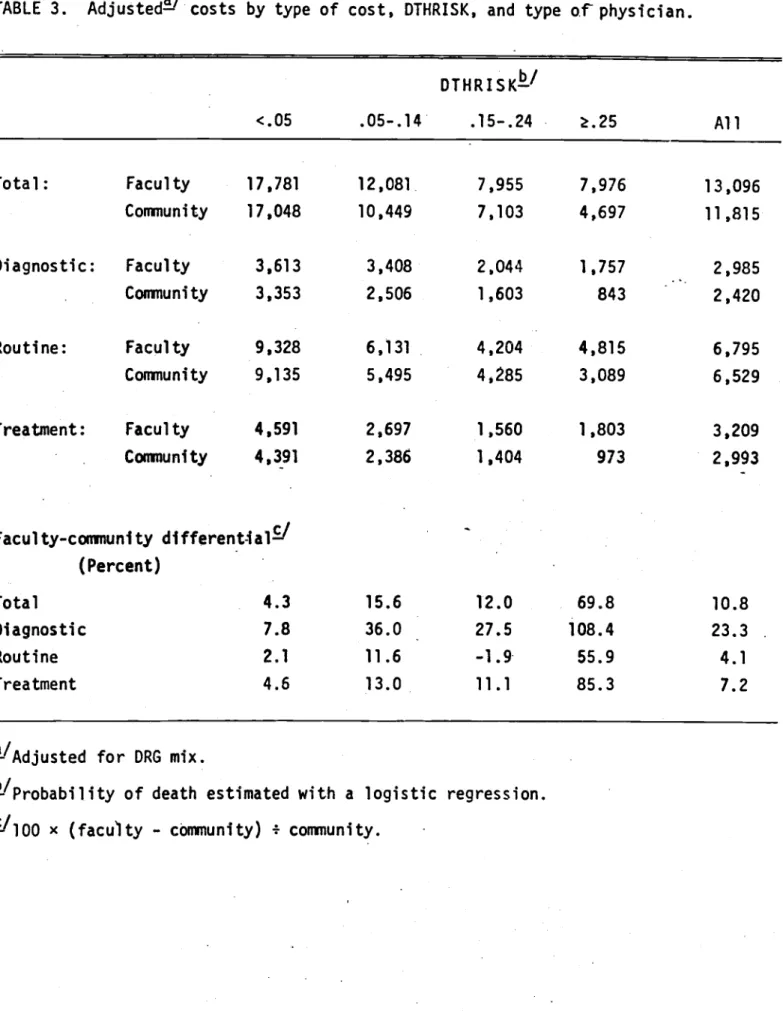
TABLE 3. AdjustedWcosts by type of cost, DTHRISK, and type of physician. <.05 .05-.14 DTH
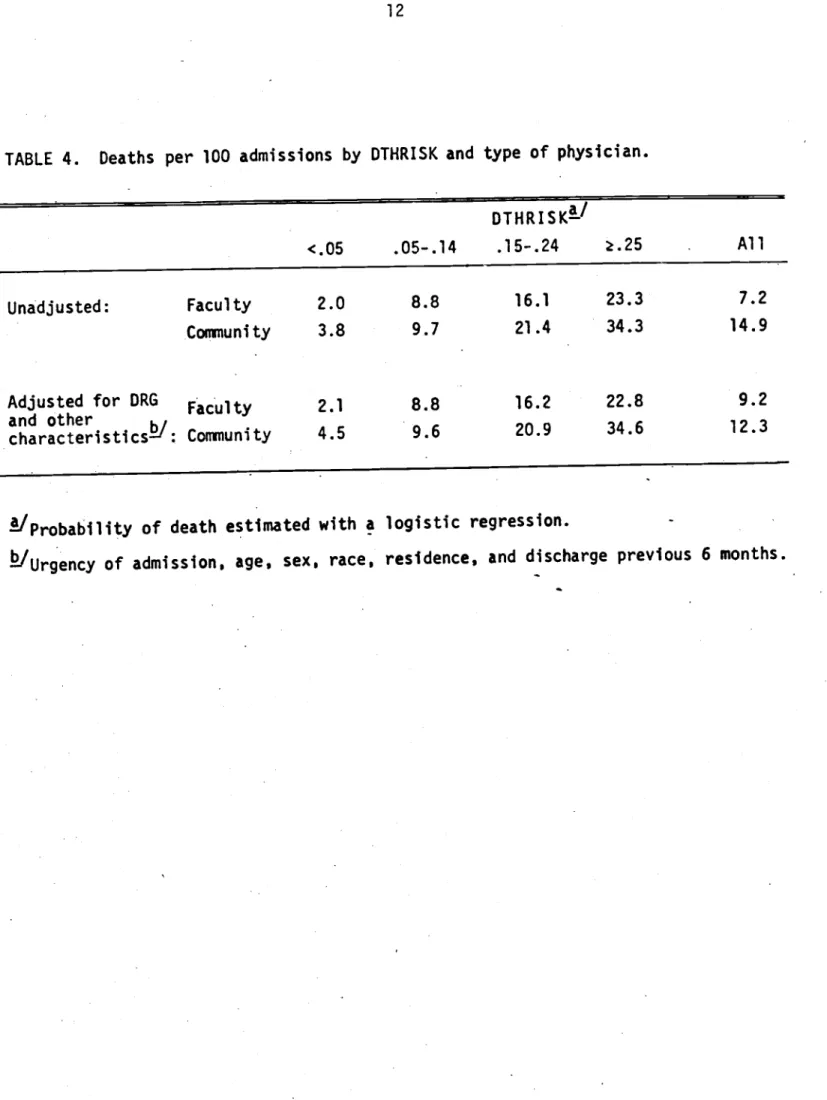
TABLE 4. Deaths per 100 admissions by DTHRISK and type of physician. < .05 .05—.14 D T HR I S K-'.15-.24 .25
+3

References

Related documents