O R I G I N A L R E S E A R C H P A P E R
Gravity modeling of the Muertos Trough and tectonic
implications (north-eastern Caribbean)
J. L. Granja Brun˜a•A. Mun˜oz-Martı´n•U. S. ten Brink•
A. Carbo´-Gorosabel•P. Llanes Estrada•J. Martı´n-Da´vila•
D. Co´rdoba-Barba• M. Catala´n Morollo´n
Received: 25 February 2010 / Accepted: 8 November 2010 Springer Science+Business Media B.V. 2010
Abstract The Muertos Trough in the northeast Caribbean
has been interpreted as a subduction zone from seismicity, leading to infer a possible reversal subduction polarity. However, the distribution of the seismicity is very diffuse and makes definition of the plate geometry difficult. In addition, the compressive deformational features observed in the upper crust and sandbox kinematic modeling do not necessarily suggest a subduction process. We tested the hypothesized subduction of the Caribbean plate’s interior beneath the eastern Greater Antilles island arc using gravity modeling. Gravity models simulating a subduction process yield a regional mass deficit beneath the island arc independently of the geometry and depth of the subducted slab used in the models. This mass deficit results from sinking of the less dense Caribbean slab beneath the lithospheric mantle replacing denser mantle materials and
suggests that there is not a subducted Caribbean plateau beneath the island arc. The geologically more realistic gravity model which would explain the N–S shortening observed in the upper crust requires an overthrusted Caribbean slab extending at least 60 km northward from the deformation front, a progressive increase in the thrusting angle from 8to 30reaching a maximum depth of 22 km beneath the insular slope. This new tectonic model for the Muertos Margin, defined as a retroarc thrusting, will help to assess the seismic and tsunami hazard in the region. The use of gravity modeling has provided targets for future wide-angle seismic surveys in the Muertos Margin.
Keywords Caribbean plateMuertos TroughGravity
modelingRetroarc thrusting
Introduction
During the last two decades the Muertos Trough, a 650 km-long, E-W trending and 5580 m-deep bathymetric depression located in the northern boundary of the Vene-zuelan Basin (north-eastern Caribbean plate), has been considered an active subduction zone (Byrne et al. 1985; McCann 2007) (Fig. 1). According to this hypothesis a reversal subduction polarity takes place in the north-eastern Caribbean into the oblique convergence setting between the North American and Caribbean plates. The Caribbean plate’s interior (i. e. Venezuelan Basin region) is sub-ducting beneath the island arc along the Muertos Trough, and the North American plate is subducting along the Puerto Rico Trench (Fig.1). In the retroarc region the subduction along the Muertos Trough has yielded a bathymetric depression (i. e. Muertos Trough) and an J. L. Granja Brun˜a (&)A. Mun˜oz-Martı´n
A. Carbo´-GorosabelP. Llanes Estrada
Applied Tectonophysics Group, Departamento de Geodina´mica, Universidad Complutense de Madrid, 28944 Madrid, Spain e-mail: [email protected]
U. S. ten Brink
United States Geological Survey, Woods Hole, MA 02543, USA e-mail: [email protected]
D. Co´rdoba-Barba
Departamento de Fı´sica de la Tierra y Astrofı´sica I, Universidad Complutense de Madrid, 28944 Madrid, Spain
e-mail: [email protected]
J. Martı´n-Da´vilaM. Catala´n Morollo´n
Real Instituto y Observatorio de la Armada, San Fernando, C/Cecilio Pujazo´n s/n, 11100 San Fernando-(Ca´diz), Spain e-mail: [email protected]
accretionary wedge along the south island slope from the Beata Ridge in the west to St. Croix in the east (Dillon et al.1996; Dolan et al.1998). However, the age when this hypothetical subduction began is still unknown. The underthrusting of the Caribbean plate’s interior beneath the island arc was inferred using reflection seismic profiles in the southern insular slope of the eastern Greater Antilles (i.e., Hispaniola and Puerto Rico islands) (Matthews and Holcombe 1974; Forsthoff and Holcombe 1983). Using observations derived from seismic profiles and seismo-logical data, Byrne et al. (1985) suggested an active sub-duction at the Muertos Trough. Later studies of earthquakes based on the distribution of hypocenters locations in cross-sections along the north-eastern
Caribbean reaffirmed an active subduction taking place along the Muertos Trough (Dillon et al.1996; Dolan et al.
1998; Mann et al. 2002; McCann 2007). Reflection pro-files, swath bathymetry and GLORIA side-scan imagery were interpreted subsequently assuming that an active subduction was taking place along the Muertos Trough (Jany 1989; Masson and Scanlon1991).
New multibeam bathymetry and reprocessed seismic cross-sections have allowed a detailed study of the defor-mational features in the Muertos Margin (i. e., Muertos thrust belt, Muertos Trough and northern Venezuelan basin; Granja Brun˜a et al. 2009). These observations together with sandbox kinematic modeling suggest that the Muertos thrust belt could be interpreted as a retro-wedge Fig. 1 Tectonic setting of the north-eastern Caribbean plate.
Multi-beam bathymetry in green–blue shaded area, illuminated from the northeast (modified from Carbo´ et al. 2005). Satellite-derived bathymetry is gridded to 1 min and contoured each 1000 m (Smith and Sandwell1997).Black starshows the location of the Ms=6.7 event of 1984 (Byrne et al.1985). White star in Hispaniola shows the location of the M*7.5 aftershock event of 1751 (Scherer1912; Ali et al.2008). Seismic refraction profiles: 34 and 33 (Officer et al.
1957), 9 and 10 (Officer et al.1959), 37e and 11 (Ewing et al.1960). DSDP site 146/149 (Edgar et al.1973). MRS=Mona Rift System, YB=Yuma Basin EPGFZ=Enriquillo-Plantain Garden Fault Zone, SFZ=Septentrional Fault Zone, SJFZ=San Juan-Los Pozos and San Jose´-Restauracio´n Fault Zone, SPB=San Pedro Basin. NOAM=North American plate, CARIB=Caribbean plate. Differ-ent data sources used in the models are indicated in the legend
forming part of a bi-vergent crustal wedge system sur-rounding the eastern Greater Antilles island arc during unidirectional subduction (ten Brink et al.2009). Follow-ing the latter work, the Muertos Margin could be the result of a cross-arc transmission of the compressive stresses generated by the subduction of the North American plate at the Puerto Rico Trench by means of a relatively rigid island arc. The latter hypothesis does not require a reversal of subduction polarity model in which the Caribbean plate’s interior subducts beneath the eastern Greater Antilles island arc. Several retroarc compressive wedges observed in other oceanic island arc settings have also been inter-preted with a bi-vergent crustal wedge model (e. g. in Vanuatu; Lagabrielle et al.2003and in Banda Arc; Silver et al.1983,1986b).
Here we review the studies that propose the Muertos Trough as a subduction zone using the analysis of the seismicity distribution along the north-eastern Caribbean plate boundary. The seismicity in the northeast Caribbean is very diffuse beneath the island arc and in some regions (i. e. beneath eastern Hispaniola) it is difficult to assign event populations to the respective subducted slabs. Previous authors have also pointed out that there is not a well-constrained northward dipping Wadati-Benioff zone representing the Caribbean slab. Moreover, recent studies about the accuracy of hypocenter location at subduction zones by global and local datasets reveal systematic biases reaching 25 km, altering not only the estimated depth but also the thickness of the subducted slabs (Syracuse and Abers 2009). This, together with the diffuse seismicity, illustrates that the interpretation of the Muertos Trough as a subduction zone is problematic, and the compressive deformational features observed in the upper crust (i. e. Muertos Thrust belt) do not imply necessarily a subduction process.
The Muertos Margin plays an important role in the tectonics of the north-eastern Caribbean plate (Jansma et al.2000; Mann et al.2002); solving its complex setting, either as a retroarc thrusting or as a subduction zone, will help to assess the seismic hazard in the region (e. g. the deadly M7.0 Haiti earthquake on January 12th, 2010), because it provides a basis for predicting the distribution of faulting and the nucleation of earthquakes. The aim of this work is to test the possible existence of a subducting Caribbean slab beneath the island arc along the Muertos Trough. To address our objective we have performed gravity models through the Muertos Margin offshore south of Dominican Republic, where the hypothetical subduction should be more evident (i.e. more active; Dillon et al.1996; Dolan et al. 1998; Figs.1, 2). We present an alternative model to explain the geodynamics of the Muertos Margin that will provide well-defined targets for future wide-angle seismic studies.
Evidences for active subduction Seismicity
Historical seismicity in the Muertos Margin
The north-eastern Caribbean plate boundary zone consists of a*200–250 km-wide seismogenic zone of mainly left-lateral strike-slip deformation (Mann et al. 2002), but the events related to convergence process are also important (e. g., reverse events related to the oblique subduction at the Puerto Rico Trench and thrusting at the Muertos Trough). The Muertos Margin seems to not have had much seismic activity, but several significant events have been related to this tectonic feature. The destructive M*8 event occurred the 18th of October of 1751 in the southern Hispaniola (McCann and Sykes 1984; McCann2006; Ali et al. 2008) and the Ms=6.7 event occurred the 24th of June of 1984 offshore south of Dominican Republic (Fig.2). Following the 1751 October 18 earthquake, a major aftershock M*7.5 was documented, but it was related to the left-lateral Enriquillo-Plantain Garden fault zone (Scherer 1912) (Fig.1). The M*8 event occurred the 18th of October of 1751 was related to the western Muertos Margin because the earthquake reports show Fig. 2 Satellite-derived bathymetry map of the study area. Data were gridded to 1 min and contoured each 200 m (Smith and Sandwell
1997). Location of the reflection profiles (Ladd et al.1977,1981; Granja Brun˜a et al. 2009). Black star shows the location of the Ms=6.7 event of 1984 (Byrne et al. 1985). The rectangular area shows the surface projection of estimated rupture planes/geometry for the M*8 event of 1751 (Ali et al. 2008). EPGFZ= Enriquillo-Plantain Garden Fault Zone. SJFZ=San Juan-Los Pozos and San Jose´-Restauracio´n Fault Zone.The opposed arrows show the orthog-onal convergence between the Muertos thrust belt and the Venezuelan Basin (Granja Brun˜a et al.2009)
extensive damage and tsunami near the Azua region in the south Hispaniola (See Azua in Fig.2; McCann2006). Previous seismicity studies
Considering the absence of volcanism related to subduction in the eastern Greater Antilles from Eocene times (Mann et al. 2002), the evidence of an active subduction along Muertos Margin comes from instrumental seismicity data. The seismicity is the diagnostic expression of subduction zones and provides information about the deep structure and geometry of the lithospheric plates (Stern 2002). Therefore different authors have used seismology data in
the north-eastern Caribbean to gain insight about the deep structure of this boundary plate:
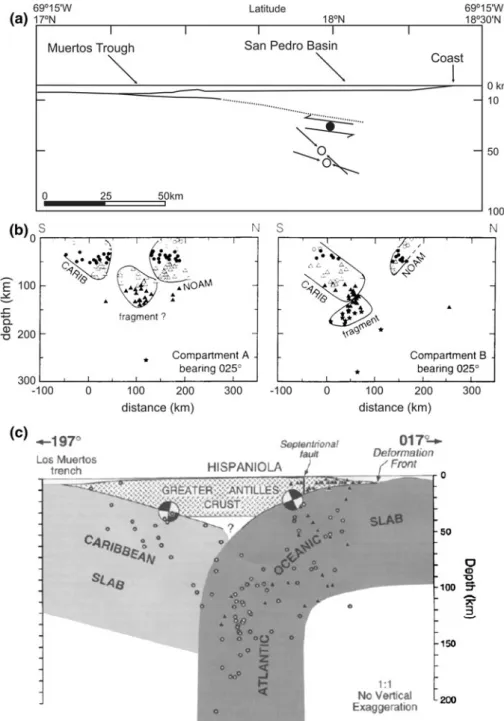
• Byrne et al. (1985) suggested that retroarc thrusting in the north-eastern Caribbean is due to the active subduction of the Caribbean plate’s interior beneath the eastern Greater Antilles. They based their interpre-tation in the June 24, 1984, Ms=6.7 San Pedro Basin event, which exhibits a near-pure thrust motion along a plane dipping 108 northwards at 32 km of depth (See black star in Figs.1, 2 and cross-section in Fig. 3a). They also estimated the focal depth and the source mechanism of two deeper earthquakes (50–60 km-deep) Fig. 3 aCross-section through
the Muertos Margin in the Hispaniola region (modified from Byrne et al.1985).Solid circlewithopposing arrows shows location and sense of motion of the Ms6.7 24th June 1984 event.Open circles indicate locations of two previous events;arrowsshow direction of maximum compression.bSeismicity cross-sections through the north-eastern Caribbean plate boundary zone in the eastern Hispaniola island (modified form Dillon et al.1996). Bearings of the planes of projection are noted. Distance from latitude 18N (km). CARIB=Caribbean slab. NOAM=North American slab.cSeismicity cross-sections through the north-eastern Caribbean plate boundary zone in the eastern Hispaniola island (modified from Dolan et al.
1998). Focal mechanism in cross-section view are shown for the Ms8.1 earthquake of 1946 in the northeast of Hispaniola (from Dolan and Wald,1998) and for the Ms6.7 earthquake of 1984 in the south of Hispaniola (from Byrne et al.
with steeper north-dipping planes, but the authors did not provide additional information about these two events (Fig. 3a). The authors inferred that the three events were associated with northward subduction of the Caribbean plateau beneath the island arc south of Dominican Republic. They interpreted a zone of seismicity dipping about 15 northward at 67.5W, directly above the vertical North American slab recog-nized by McCann and Sykes (1984). Byrne et al. (1985) also recognized that there is not a well-developed Wadati-Benioff zone and concluded that it could be a consequence of a low rate of underthrusting.
• Dillon et al. (1996) suggested a poorly defined northward-dipping zone of seismicity corresponding to the Carib-bean plateau subduction, at least from St. Croix to the Beata Ridge (Fig.1), using the distribution of certain shallow events in the south of the islands. The southwest-dipping slab of the North American lithosphere previ-ously proposed by McCann and Sykes (1984) was also recognized by Dillon et al. (1996) when they plotted the seismicity distribution in depth along the northeast Caribbean boundary. Dillon et al. (1996) also proposed that the opposing slabs of the Caribbean and North American plates are in contact in the Mona Passage and in the area west of Puerto Rico, and that discrete zones of seismicity at depth presumably represent deep lithospher-ic fragments distinct from these plates (i. e. detached slabs) (Fig. 3b). They further proposed that the slab interaction at depth in which the Caribbean plate presses down on North American plate causes the subsidence of Puerto Rico Trench. However, there is an alternative model which explains this extreme subsidence in the Puerto Rico Trench without implying the interaction in depth of opposed subducted slabs (ten Brink2005). • Dolan et al. (1998) proposed a three-dimensional model
for the structure of the north-eastern Caribbean bound-ary zone with opposing slabs and upper mantle slab collision (Fig.3c). They suggested the active collision of the northward-dipping Caribbean plateau slab and the southward-dipping North American slab (non-detached slab, c.f. Dillon et al. 1996), located from the middle Puerto Rico to middle Hispaniola. Dolan et al. (1998) associated clusters of shallow events (\50 km) in the Muertos Trough and in the inner island arc regions with the northward underthrusting of the Caribbean crust beneath Hispaniola. They suggested a zone of seismicity dipping about 15 northward at 67.5W directly above the un-detached vertical slab recognized by McCann and Sykes (1984). However, Dolan et al. (1998) pointed out that there is only a weakly defined, shallowly north-dipping zone of seismicity associated with the Caribbean slab at the Mona Passage and a diffuse pattern of shallow- to
intermediate-depth seismicity is related with the Carib-bean slab at Puerto Rico.
Analysis of the recent seismicity
We have plotted the instrumental seismicity in the north-eastern Caribbean region analyzing the data provided by the Puerto Rico Seismic Network (PRSN), since local seismic networks tend to have better resolution and detection thresholds, which is more useful to study the geometry of subducted slabs. The Dominican Republic does not have a well-developed seismic network which can provide reliable and complete earthquake information, while the PRSN has a complete data set from 1986 to present. After excluding events with RMS[1.5, horizontal error[10 km, vertical error[20 km and Ms\3.5, the resultant useful data in the Hispaniola region is very poor. There is a surprising lack of data shallower than 80 km-deep in the Mona Passage and Hispaniola (Appendix 1), suggesting a low detection threshold of this local seismic network in the Hispaniola region, since the seismometers are mainly located in the Puerto Rico region. The results of the PRSN data analysis lead us to use the global data set provided by the National Earthquake Data Center (NEIC) that provides much more information in the Hispaniola region. To use the most reliable relocations, we have only plotted the events from 2000 to 2008. Data were filtered and edited by quality cri-teria excluding events with assigned default depths of 10, 25 and 33 km; and then to represent just the most significant events and gain a better visualization, the earthquakes were also filtered by Ms[4 in map-view (Fig.4) and Ms[3.5 in cross-sections (Fig.5). In addition to analyze the stress regime at the Muertos Margin we have plotted the focal mechanism derived from the Harvard CMT Catalog (www. seismology.harvard.edu; Dziewonski et al.1981).
• Seismicity map-view analysis
The seismicity map shows a diffuse distribution of the events along an east–west trending band of*200–250 km of width between the Puerto Rico-Hispaniola Trench in the north and the Muertos Trough in the south (Fig.4). There are only a few intraplate events in the interior of the Caribbean and North American plates. The focal solutions mainly show reverse and strike-slip components suggesting a prevailing transpressive regime taking place in the north-eastern Caribbean plate related to the oblique convergence between the North American and Caribbean plates. The hypocenters show a broad range of depths reaching 200 km of depth, but being more concentrated in depths lower than 100 km. The map-view distribution shows two clusters densely populated with events: one shallower cluster (\100 km) in the offshore region north-east of Puerto Rico
and Virgin Islands and one deeper cluster (80–200 km) in the eastern Hispaniola-Mona Passage. The shallower cluster was associated to a hypothetical tear fault in the North American slab which would accommodate the increase from a lower subduction angle in the Lesser Antilles to a greater subduction angle at the Puerto Rico Trench (ten Brink2005). The deeper cluster coarsely out-lines a north–south trending band of 50–100 km-wide between 18N and 20N in the eastern Hispaniola and Mona Passage and it is the area where the deepest seis-micity in the north-eastern Caribbean takes place, reaching 200 km of depth. This deeper cluster was interpreted by Dillon et al. (1996) as a detached fragment of the North American slab and by Dolan et al. (1998) as a zone where the North American slabs is subducting vertically.
In general, although seismic and bathymetry data shows active deformation taking place in the Muertos Margin (Granja Brun˜a et al. 2009), there is a paucity and high
dispersion of events in the retroarc zone (Fig.4). The only exception is the region of eastern Hispaniola-Mona Passage where there is a cluster of events reaching 200 km of depth, while most of the events in the Muertos Margin are \50 km-deep. We agree with Byrne et al. (1985) that the paucity of events and the lack of a well-developed Wadatti-Benioff zone may be due to the ultra-slow rate of con-vergence at the Muertos Margin.
• Seismicity cross-section analysis
In the same way than Dillon et al. (1996) and Dolan et al. (1998) did, we have performed a series of seismicity cross-sections serially arranged along the north-eastern Caribbean plate boundary zone. Plotting the events in sections across the boundary plate permits to study the hypocenter distribution and to illustrate the geometry of subducted slabs. The cross-sections are oriented north– south, making sure that they are orthogonal to the Muertos Fig. 4 Seismicity map of the north-eastern Caribbean plate boundary
zone. Hypocenter data come from the National Earthquake Informa-tion Center filtered by Ms[4. Hypocenters are showed in color code depending on the depth (See color scale). Focal mechanism solutions come from the Harvard CMT catalog (www.seismology.harvard.edu; Dziewonski et al.1981).Red colorin focal solutions shows reverse component andblue colorshows normal component. Therectangular
areas represent the compartments that include the hypocenters and focal mechanism plotted in the seismicity cross-sections of Fig.5. The locations of Muertos Trough, the Puerto Rico Trench and His-paniola Trench are indicated. Green area shows the detachment surface in the Muertos Margin inferred from reflection seismic data. VI=Virgin Islands
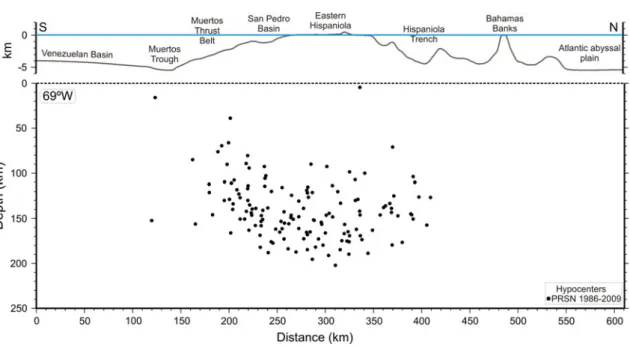
Fig. 5 North-south cross-sections of seismicity. For location see Fig. 4 . Hypocenter data come from the NEIC between 2000 and 2008 filtered by Ms [ 3.5. Focal mechanism solutions in cross-section view come from the Harvard CMT Catalog (Dziewonski et al. 1981 ). Data were plotted including events located to * 70 km each side of the north–south central heavy line of Fig. 4 . The geometry of the detachment in the Muertos Margin inferred from reflection data is indicated. The detachment is the main thrusting interface betwe en the upper block (deformed wedge-island arc) and the lower block (oceanic plateau), and shows the top of the Caribbean crust. The top of the subducted North American slab is indicated as well as the possible location o f the bottom. The arrow shows the sense of motion of the downgoing North American slab. Heavy line at the top of the figure represents bathymetry-topography along the north–south central line of each cross-section and with vertical exaggeration of 10 9 . a North–south cross-section at 65 W. b North–south cross-section at 67 W. c North–south cross-section at 69 W. The 1984 mainshock and aftershock focal solutions are marked. d North–south cross-section at 70 W
margin, and they include events within 70 km of each side of the profile location (Fig.4).
The cross-sections 65W and 67W show two clusters separated by a gap (Fig.5a, b). One cluster is located to the north of the island arc (i.e., forearc) and the other one is located near the island arc. The cluster located beneath the forearc area is more populated in shallower zones and continues toward deeper zones showing a southward dip-ping pattern (i. e. Wadati-Benioff zone). This cluster would represent the North American slab subducting beneath the island arc at the Puerto Rico Trench identified by McCann and Sykes (1984), Dillon et al. (1996) and Dolan et al. (1998). The cluster located beneath the island arc has events with depths of less than 50 km that are located more than 50 km northward from the Muertos Trough. This cluster would represent the Caribbean slab subducting beneath the island arc at the Muertos Trough (Dillon et al.
1996; Dolan et al. 1998).
The cross-section 69W is located where the subduction of the Caribbean slab beneath the island arc should be relatively more pronounced following Dillon et al. (1996) and Dolan et al. (1998) (Figs. 3b, c, 4). However in this area the seismicity shows a diffuse pattern with events reaching 200 km of depth (Fig.5c) and being very hard to identify different clusters and to assign them to different subducted slabs. Indeed, the southwards-dipping North American slab suggested by McCann and Sykes (1984) and later works (Dillon et al.1996; Dolan et al.1998) cannot be well defined. In this cross-section there are several focal mechanisms beneath the region of the San Pedro Basin between distances of 200 and 250 km: Four mechanisms located between 15 and 42 km of depth and two mecha-nisms between 70 and 80 km of depth (Fig.5c). The shallower mechanisms, except for one event with normal component, show essentially a reverse component. This reverse component together with a nodal plane oriented sub-parallel to the Muertos Trough suggests that they are associated to the compressive stress in the Muertos margin. The northwards dipping nodal planes show low dips, between 3–20, and the southward dipping planes are sub-vertical. The presence of focal solutions with one of the nodal planes sub-paralleling the main thrust and the other one with a similar dip to the detachment is characteristic of deformed belts and accretionary prisms in compressive settings (Mann 1999). Within this population is included the 1984 Ms=6.7 event relocated by Byrne et al. (1985) to 32 km-depth having a 10northward dipping plane and calculated by the Harvard CMT method having a 16.4 km-deep plane (with a 2 northward dip). The two deeper mechanisms to the south of the San Pedro Basin were also documented by Byrne et al. (1985). Their nodal planes are sub-parallel to the Muertos Trough and show a near pure reverse component, but the northwards dipping planes are
sub-vertical. These two deeper events seem to not be related to the shallower events in the San Pedro Basin because they are 30 km deeper and the planes show very different northward dipping angles. Their depth and northward dipping planes suggest to have more relation with the deeper focal mechanisms located in the axial zone of the island arc and may be related with the North American subducted slab. After analyzing the seismicity data we cannot discriminate whether these two deeper events are related with the compressive process that takes place in the Muertos Margin or if they illustrate either the Caribbean or the North American subducted slabs.
In the cross-section 70W the events are also shallower (\125 km-deep) than in the 65W and 67W sections (Fig.5d). Two clusters separated by a gap have been observed. The cluster located beneath the forearc area continues towards deeper zones showing a southward dipping pattern and would represent the North American slab beneath the island arc (Dillon et al.1996; Dolan et al.
1998). The cluster located beneath eastern Hispaniola shows depths\50 km and is located more than 50 km northward from the Muertos Trough. This cluster would represent the Caribbean slab beneath the island arc (Dillon et al. 1996; Dolan et al. 1998). The focal mechanisms, except for one event with normal component, show essentially a reverse component. Their reverse component together with a nodal plane oriented sub-parallel to the Muertos Trough suggests that they are associated to the compressive stress in the Muertos margin.
• General inferences from seismicity data
There are few recent events of Ms[3.5 in the retroarc region and they are located in the eastern Hispaniola, Mona Passage and in the offshore region of San Pedro Basin (Fig.4). The events that can be more reliable related to the Muertos Margin are shallower than 50 km-deep and show a predominantly reverse focal mechanism. This shallow depth and reverse component do not imply necessarily a subduction process because it can also be explained due to a retroarc thrusting and/or internal deformation in the island arc. The cross-section of eastern Hispaniola (Fig.5c) shows very diffuse seismicity and there are deeper events reaching 200 km-deep beneath the southern insular slope that may be related to a hypothetical subducted Caribbean slab. However, these events only appear in a sector of 100 km along of the Muertos Margin. East and westward of this sector the depth of the events in the Muertos Margin changes to\50 km of depth. Along the 80% of the length of the Muertos Margin the events have depths of\50 km and they would not be conclusive to support a Caribbean slab subducting beneath the island arc along the Muertos Trough. The deeper events that are only located in a sector of 100 km along the Muertos margin are more likely to be
part of the North American slab, but seismicity here does not provide enough constrain to discern this.
From our analysis we state that in this area the seismicity studies do not provide a strong support for the existence of a subducting Caribbean slab, mainly because the seismicity is very diffuse beneath the island arc and the plate geometry in depth is difficult to constrain. This diffuse seismicity may be related to the transition between subduction to strike-slip/ collision regimes that takes places in the north-eastern Caribbean. The seismicity data in the north-eastern Carib-bean provided by global earthquake catalogs (e. g. NEIC) and local (e. g. Puerto Rico Seismic Network catalog) seems to be conditioned by random errors due to inexact arrival times, inexact velocity models and incomplete arrival data (Syracuse and Abers 2009). In the setting of the north-eastern Caribbean we think that there are specifically two main factors influencing the accuracy of the hypocenter location: the absence of deep seismic sounding data to constrain more exact velocity models and the distribution of seismic stations related to each earthquake that in general has a very limited azimuthal coverage. Hypocenters and focal mechanism solutions from global and local catalogs that could be related reliably with the Muertos Margin or with the internal deformation in the island arc do not exceed 50 km of depth. Therefore, current seismicity data from the north-eastern Caribbean do not have the necessary resolu-tion to prove the existence of a subducresolu-tion of the Caribbean plate’s interior beneath the island arc. This fact is well illustrated looking at the disparity in the data provided by different sources for the June 24, 1984, Ms=6.7 San Pedro Basin event and its M=4.8 aftershock: Byrne et al. (1985) re-located the mainshock at 32 km-deep, the NEIC provides a depth of 23 km for the mainshock and a depth of 32 km for the aftershock, the Harvard CMT Catalog provides a depth of 16.4 km for the mainshock and of 33.4 km for the after-shock and the Centennial Catalogue (Engdahl and Villa-sen˜or2002) provides a depth of 41.2 km for the mainshock. Seismic profiles and bathymetry
The interpretation of bathymetric and seismic-reflection data has also been used to propose the Muertos Trough as a subduction zone. The seismic profiles show folded and thrusted sediments along the insular slope defining a compressive deformed belt, and continuous sub-horizontal reflectors extending 40 km northward from the deforma-tion front under the insular slope (Matthews and Holcombe
1974; Ladd et al. 1977, 1981; Ladd and Watkins 1978,
1979).The thrust belt is significantly wider offshore of the Dominican Republic, and the sedimentary reflectors of the Venezuelan basin can be observed dipping 8–10 north-wards beneath the thrust belt*30 km from the deforma-tion front (Granja Brun˜a2008) (Appendix 2). South of the
Dominican Republic where the thrust belt is wider is also where the subduction process was proposed to be more active from seismicity data (Dolan et al. 1998).
The information derived from the bathymetry data and the seismic-reflection profiles is limited to about 8–10 km of depth, supporting the idea that a compressive process is taking place in the Muertos Margin. The seismic images show thin-skin tectonics but not necessarily a subduction process, since the presence of the retroarc fold- and -thrust belts has also been observed in other oceanic island arcs where there is no reversal of subduction polarity (Laga-brielle et al.2003; Silver et al.1983,1986b).
Controversies for a subduction along the Muertos Trough
In addition to the reasons derived from the analysis of the seismicity and the information provided by the seismic profiles and bathymetry, the interpretation of the active subduction zone along the Muertos Trough may result problematic for several other reasons:
a. Simultaneous dual subduction
Since true subduction is driven by a slab’s negative buoyancy within the upper mantle, there must be sufficient room in the mantle for a plate to sink before the process can begin. The distance between the Puerto Rico and Hispaniola trenches on the north side of the eastern Greater Antilles island arc and the Muertos Trough on the south side is less than 200 km (Fig.1). Considering that the age of the subducting North American plate is 85–125 Ma (Mueller et al. 2008) and that the age of the hypothetical subducting Caribbean plate is 100–120 Ma (Mueller et al.
2008), both slabs should be about 90–100 km thick. Seis-mic observations (Ladd and Watkins 1979; Dolan et al.
1998; ten Brink2005; Granja Brun˜a et al.2009) show that the North American and Caribbean plates dip at 8–20 within 30 km inland of the Puerto Rico Trench and the Muertos Trough, respectively. Thus, there is simply too little room for true simultaneous subduction of two plates with opposite polarities under the eastern Greater Antilles arc (ten Brink et al. 2009). Recognizing this problem, Dillon et al. (1996), Dolan et al. (1998), Mann et al. (2002), and van Gestel et al. (1998) envisioned direct contact between the downgoing North American and Caribbean slabs at sub-crustal depth beneath the island arc. But it is not clear why the Caribbean subduction is sustained if such contact exists.
b. Oblique convergence
The kinematics of deformation within the Muertos thrust belt is not compatible with true subduction along the
boundary (Granja Brun˜a et al.2009; ten Brink et al.2009). If the Caribbean plate interior is subducting under the eastern Greater Antilles arc, the convergence direction would be highly oblique to the strike of the Muertos Trough, based on kinematic model derived from GPS and earth-quake slip vector data (Manaker et al. 2008). Although, during the last decades the north-eastern Caribbean has been extensively monitored using GPS (e.g. Jansma et al.
2000; Calais et al. 2002), those studies have not supply relevant information about the kinematics at the Muertos Margin, mainly because the azimuthal coverage of GPS-station does not permit properly to determine the slip rate along the Muertos Margin. Model slip rates on the Muertos Margin average 5±2 mm/year, from 7.3±1.0 mm/year west of the Mona Passage to 1.7±1.7 mm/year east of the Mona Passage (Manaker et al.2008). This kinematic model suggests that there is accommodation of oblique conver-gence slip in the Puerto Rico Trench subduction zone and in the Muertos Trough, with the convergence slip vector ori-ented 70–75NE at the Muertos Trough. Such oblique convergence would have to be accommodated either by oblique thrusting within the Muertos belt or by strain par-titioning between the frontal thrusting and the strike-slip faulting in the Muertos belt and the adjacent on-shore portions of the eastern Greater Antilles. However, the map-view geometry of the deformation front (i.e. salients and recesses), the absence of no active zones of strike-slip faulting within the thrust belt and the sand-box kinematic modeling indicates that the Muertos thrust belt is a zone of dip slip thrusting where is taking place an orthogonal N–S convergence between the Venezuelan basin and the island arc (Granja Brun˜a et al.2009; ten Brink et al.2009). c. Normal faulting in the Muertos Trough
Normal faults sub-parallel to the deformation front are exposed on the Caribbean plate seafloor within the Muertos Trough. These faults extend to a distance of about 30 km south of the deformation front of the Muertos thrust belt (Granja Brun˜a et al. 2009). East of longitude 68W and west of longitude 69.5W, these faults curve northward and terminate at the thrust front. Similar normal faults have been observed on many subducting plates to a distance of 50–60 km oceanward of the trench, and are interpreted to be a deformational response to tensile flexural stresses resulting from the bending of the subducting plate (Bodine and Watts1979; Ranero et al.2005). However, the normal faults south of the Muertos Trough take place in a thick-ened oceanic crust (plateau) and are best developed where the Muertos thrust belt is particularly wide. The faults gradually terminate along strike to the east and to the west, where the retro-wedge is narrower. This relationship sug-gests that normal faulting may have been amplified by loading when retro-wedge thrust sheets loaded the
Caribbean plate (Granja Brun˜a et al. 2009). The Muertos Trough is 650 km-long and there are normal faults only in a 150-km long sector located in the central zone. However, seismicity data and active faulting suggest that the com-pression is taking place along whole Muertos Margin.
Data and methods
To carry out the 2D gravity modeling we used gravity and multibeam bathymetry data acquired in the southern insular slope of Dominican Republic (Fig.1) during the 2005 GEOPRICO cruise (Carbo´ et al. 2005). The offshore gravity data was linked to on-land absolute-gravity stations and integrated in a geo-referenced database with both onshore data from the Dominican Republic and satellite-derived data used to extend longitudinally the gravity model (Sandwell and Smith1997). The gravity data were processed using common corrections including the sea-bottom terrain correction (Carbo´ et al. 2003). Additional data to constrain the gravity models were taken from a deep seismic sounding profile also recorded during the same cruise and oriented N–S on the same track line as the gravity model (L8 in Fig.1, Co´rdoba et al.2008).
The densities used in the gravity modeling were chosen based on the physical properties obtained in leg 146/149 from the Deep Sea Drilling Program (See 146/149 in Fig.1; Edgar et al.1973) and on the empirical relationships between seismic velocities and densities (e. g. Nafe and Drake1963; Gardner et al.1974; Christensen and Mooney
1995; Brocher 2005). The velocities for the shallow sub-sea sediments for the trough wedge and for the deformed belt have been inferred from the reflection data (Fig. 1; Ladd et al. 1977,1981) and compared with similar com-pressive settings (Yuan et al. 1994). Velocities of crustal basement layers in the Venezuelan Basin are available from regional seismic studies by Officer et al. (1957,1959), Ewing et al. (1960), Edgar et al. (1971), Diebold el al. (1981), Mauffret and Leroy (1997, 1999), Diebold et al. (1999) (See refraction profiles in Fig.1), and from general models of continental and oceanic crust (see summary in Kearey et al.2009).
We present gravity models built using Bouguer anom-alies with sea-bottom terrain correction since they are notably less influenced by the water layer than the free air anomalies (Carbo´ et al. 2003). Free Air and Bouguer anomalies are used extensively in both terrestrial and marine analyses and to choose one or the other anomaly type does not lead to any differences in the gravity model obtained. We have tested each of the models twice, using Free Air and Bouguer anomalies, to ensure that we were obtaining the same results and we were able to fit well the models irrespective of the anomaly type used. The Bouguer
correction was calculated using a reduction density of 2.67 g/cm3. In the marine areas was used a reduction density of 1.64 g/cm3as a result of subtracting to 2.67 g/cm3 the average seawater density (1.03 g/cm3).
Modeling constraints and assumptions Venezuelan Basin and Muertos Trough
The Caribbean plate’s interior includes regions of anoma-lously thick oceanic crust (buoyant oceanic plateau; Burke et al.1978), and locally it can be over twice as thick as that of the Atlantic Ocean crust north of Puerto Rico. The anomalous thickness of the Caribbean crust probably reflects the production of flood basalts and sill intrusions in a large igneous province (e.g. Mauffret and Leroy1997). The Venezuelan Basin is an extended basin which occupies the eastern region of the Caribbean plate’s interior and that is constituted by an igneous basement covered by a thick sedimentary layer (Discroll and Diebold1998). The top of the igneous basement is a smooth surface marked by the seismic horizon named as reflector B’’. This reflector marks an increase of seismic velocities, because rocks underlying this horizon have velocities[5 km/s, but the structure and composition of this igneous basement is not well con-strained. The sedimentary section overlying the reflector B’’ has been studied by means of extensive seismic surveys (Driscoll and Diebold 1999) and the seismic stratigraphy has been correlated with ages and petrology data derived from Deep Sea Drilling Projects (e. g., sites 146/149; Edgar et al.1973).
Seismic velocities in the Venezuelan basin basement range from 5 to 7.5 km/s (Mauffret and Leroy1997). In the context of a large igneous province, the classical layering model of the oceanic crust (i. e., Layer 1 (sediments); Layer 2a (pillows) and 2b (dikes), and layer 3 (Gabbros) should not be assumed. The structure of this igneous province is poorly established as a result of the lack of data with the necessary resolution to infer the internal structure. Considering the seismic velocity variation with the increase of depth (Mauffret and Leroy1997), we hypoth-esize a simple increase of density with depth modeling two plateau units (Fig.6): the Upper Caribbean Plateau (2.8 g/ cm3) and the Lower Caribbean Plateau (2.9 g/cm3). Refraction seismic data shows the Moho in the northern Venezuelan Basin at about 13-15 km of depth (Officer et al.1957; Ewing et al.1957; Diebold et al. 1981,1999). Seismic velocities in the shallow sub-sea sediments increase with depth and age. The Venezuelan Basin is covered with 0.6-0.8 km of post-Coniacian sediments (known as Carib beds; Ewing et al.1957, See Appendix 2). These sediments beds have velocities from 1.62 km/s to
2.47 km/s (Edgar et al. 1973; Matthews and Holcombe
1985). These units have not been subjected to tectonism other than steady subsidence. Velocities of 2 km/s can be correlated with densities between 1.85 and 2.15 g/cm3 (Brocher 2005). We have used a value of 2.0 g/cm3 of density for the Venezuelan Basin sediment cover (Oceanic Sediments, Fig.6) that corresponds with an average velocity of 2.0 km/s. The Muertos Trough is filled with a turbidite wedge of variable volume along the trough. This wedge is onlapping the Carib beds. In the area where the gravity model is located this turbidite wedge has a maxi-mum thickness of 0.36 km and is post-Lower Miocene (Granja Brun˜a et al. 2009). This thinner and more recent sedimentary wedge unit has an average seismic velocity
B2.0 km/s and we have inferred a density of 1.9 g/cm3
which is little lower than the density of the Oceanic Sed-iments (Brocher 2005).
Insular slope
Seismic sections show that the Carib beds are buried beneath a turbidite wedge at the Muertos Trough and are progressively being offscraped and accreted to the thrust belt (Granja Brun˜a et al. 2009). To implement this infor-mation into the gravity model we have only consider two density units with a minimal geometrical complexity since we have very limited information: the Carib beds beneath the turbidite wedge (Buried Oceanic Sediments) and beneath the deformed belt (Thrusted Sediments). We use densities of 2.2 and 2.3 g/cm3, respectively (Fig.6), assuming that those sediments have been compacted by the pressure of the overburden of the trough wedge and the deformed belt (Bray and Karig1985).
The geometry and properties of the deformed wedge and the shallower structure in our density models can be inferred from the seismic reflection studies (Ladd et al.
1977). Seismic reflection profiles in the model area show the basal detachment extending*30 km northwards from the deformation front and dipping between 8 and 10 northwards (Granja Brun˜a et al. 2009). We have modeled the deformed wedge assuming an increase of density with increasing depth and with decreasing distance landward (Yuan et al.1994; Flueh et al.1998). In many accretionary wedges it has been documented that the vertical and hori-zontal tectonic stresses consolidate the sediment section, expelling pore fluids and resulting in an increased seismic velocity (Moore et al.1987; Moore and Vrolijk1992, Yuan et al. 1994). Seismic velocities in deformed belts or accretionary prisms range between 1.0 and 4.0 km/s pri-marily depending on the location in the deformed wedge, but the velocities are mainly [2 km/s. For velocities between 2 and 4 km/s we have assumed an average density between 2.3 and 2.5 g/cm3 for the total thickness of the
deformed sediment wedge (Fig.6; Brocher 2005). In general, there is very limited information regarding the backstop geometry in convergent margins (i.e. island arc core), and we have assumed a simple seaward dipping backstop to define the inner geometry of the fold-and-thrust belt. This geometry could be more favorable for the development of big slope basins (e. g. San Pedro Basin: SBP in Fig.1), but in the literature there is no consensus about this issue (Silver et al.1985,1986a; Brandon1986) mainly due to the difficulty to acquire seismic data of good quality which can help to constrain the backstop geometry (Seely et al.1974).
Seismic velocities of the extended sediment units (e. g. big slope basins and terraces) which have been subjected to some tectonism (e. g. San Pedro Basin: SPB in Fig.1) can reach 2.3-2.5 km/s at the deeper zones of the seismic section (Ladd et al. 1981), corresponding with average densities of about 2.0 g/cm3(Brocher 2005; Fig.6).
Island arc
We do not have any data to constrain the crustal thickness beneath the eastern Hispaniola because the deep seismic data only provided us with limited information for the southern slope. Interpretation from modeling deep seismic sounding shows an arc crust beneath the southern insular slope composed of several northwards dipping reflectors (Co´rdoba et al. 2008). These reflectors could image the south-verging internal structure (i. e. accreted) of the southern island arc suggesting thick-skin tectonics. The densities for the island arc crust used in the gravity model have been derived from comparisons with the seismic velocities in the Aleutian arc (Holbrook et al.1999), where the velocities of the island arc core range between 4.3 in the upper arc crust to 7.2 km/s in the lower arc crust. Based on this we have simplistically assumed two arc crust units
separated by an horizontal interface to make similar to the p-wave velocity model performed by Holbrook et al. (1999) in the Aleutian arc: Upper (2.8 g/cm3) and Lower (2.85 g/cm3) (Fig.6; Brocher 2005).
Results and discussion
We have tested different gravity models (Fig.6) over the same N–S track line across the Muertos Margin, from the Venezuelan Basin to the south coast of the eastern His-paniola Island (Figs.1, 2), where the hypothetical sub-duction process should be more evident (Dolan et al.1998). We did not extend the gravity models northward because of the lack of constraining seismic data in that area, as well as to avoid the influence of the subducted North American slab (McCann and Sykes1984) and the strike-slip tectonics observed in the forearc region (ten Brink and Lin, 2004). All 2D gravity models were performed assuming that the regional structure along the E-W trending Muertos Margin has not much variation at the model region. This assump-tion can be considered appropriate as a result of the information provided by seismic reflection profiles and bathymetry data (Granja Brun˜a et al. 2009), and the inferences from the analysis of gravity anomaly maps (Granja Brun˜a et al.2008).
The Bouguer anomaly profile shows a relatively steep gradient (3.3 mGal/km) between a zone with high relative gravity on the Caribbean’s interior (oceanic plateau) and a zone with low relative gravity on the island arc (Figs.6,7). This gradient implies 200 mGal of difference between the Caribbean plateau and the island arc. In the Bouguer anomaly map this steep gradient is seen along 600 km as an E-W trending band along the southern insular slope, from the Dominican Republic to St. Croix (Fig.7). The gradient becomes narrower eastwards, overlapping the width of the active fold-and-thrust belt south of the Dominican Republic. To the south of the eastern Mona Passage and Puerto Rico the gradient is wider and extends more northwards and eastwards than the active deformed belt. There are not any other gradients like this in the entire north-eastern Caribbean region; not even at the main sub-duction zone of Puerto Rico Trench (Granja Brun˜a et al.
2008). We suggest that this gradient mainly reflects the difference in thickness between the plateau (*10 km) and the island arc (*30–35 km). In addition, this gradient also have to reflect the variation in their rock composition, because the island arc is composed by accreted materials from different origins and the Venezuelan Basin is con-stituted by a large igneous province covered by sediments of variable thickness (Case et al.1990; Mauffret and Leroy
1997). Fig. 6 Gravity models for the profile located in Figs.1, 2 and 7.
Green circles are observed Bouguer anomaly values, black lineis calculated Bouguer anomaly andred line(residual) is the difference between observed and calculated Bouguer anomalies. See legend for interpretation of the colors and the units. Densities are given in g/cm3. Thick black lines within the density models indicate the contacts inferred from reflection and refraction seismic data. Focal mecha-nisms are from the 1984 M=6.7 event from Byrne et al. (1985) and from the Harvard CMT catalog (Dziewonski et al.1981). aModel with a low-angle subduction.bModel with a high-angle subduction. cModel with a deep high-angle subduction.d Model with a deep high-angle subduction and phase transformation of the subducted slab.eModel with a high-angle subduction and a density of 2.4 g/cm3 for the deformed wedge.fModel with a high-angle subduction and a density of 2.5 g/cm3for the deformed wedge.gModel with a longer thrusting.fModel with a shorter thrusting
Gravity modeling always provides a non-unique solu-tion, but it is a useful tool to reject a model if it is totally unable to fit the data, as it is the case in the Muertos Margin when you try to model any type of subduction. We have built many models, varying the deep geometry of the plate interface and the maximum depth at which the slab is subducting. We tested and rejected many other subduction geometries, but here we present only the eight most rep-resentative models (Fig.6): six gravity models to test the hypothesis of a subduction in the Muertos Margin (Fig.6a–f) and two more models to test alternative hypothesis (Fig.6g, h). We have used the same geometry in the eight models in those areas where we have more or less con-strained data and have varied the geometry of the rest. All the density models show a good fit in the Venezuelan Basin region (plateau) with a crustal thickness of 9–10 km and the Moho located at*14–15 km of depth, in agreement with the seismic data (Mauffret and Leroy1997; Diebold et al.1999). Beneath the inner island arc the Moho fits the gravity data very well if it is located at *32–34 km of depth (Fig.6g, h), but we do not have information about its depth. The deep seismic modeling for the eastern Domin-ican Republic performed by Co´rdoba et al. (2008) does not cover this region.
Subduction model
Models inferred from seismological data outline the top of the Caribbean subducted slab dipping northwards 15 to 50 km of depth beneath the axial zone of the island arc
(Dolan et al.1998). If there is an active subduction along the Muertos Trough, it might be expected that the oceanic crust (Caribbean plateau) would still be present dipping northwards below the arc crust. The gravity models for such subduction processes (Fig. 6a–d) assume the simple subduction of the Caribbean plate’s interior (oceanic pla-teau) beneath the island arc along the Muertos Trough. We tested two subduction geometries extended to 50 km depth and varying the subduction angle (Fig.6a, b). Seismicity data do not provide any constrain about the geometry at the end of the slab, then we have built the gravity models assuming a reasonable and simple geometry. A low-angle subduction (in agreement with the majority of the inter-pretations inferred from seismicity and the plateau rheol-ogy) was simulated with a progressive increase of the subduction angle, from 8beneath the deformed wedge to the south, to 25 in deeper zones, to the north (Fig.6a); while a high-angle subduction was simulated varying the same angle from 8to 50in deeper zones (Fig.6b).
The density model with low-angle subduction geometry reflects the geometry of the top of the Caribbean slab proposed by Dolan et al. (1998) (Fig.6a). This model fits well in the Venezuelan Basin interior and is able to adjust the regional steep gradient between distances of 60 and 130 km, the area of the deformed belt. However, using this geometry we observe a significant mass deficit at a regional scale, from 0 to 60 km, beneath the upper insular slope, which progressively increased towards the island arc reaching a maximum of*40 mGal. We interpret that this regional mass deficit is associated with the sinking of the Fig. 7 Bouguer anomaly map of the northern Venezuelan Basin and
the southern insular slope of the eastern Greater Antilles. Dashed black linemark the location of the profile used in the gravity models (Fig. 6). White dashed lines mark the limits of the steep Bouguer anomaly gradient along the Muertos Margin. The data used in the
map includes marine data from the GEOPRICO cruise (Carbo´ et al.
2005), satellite derive data (Sandwell and Smith1997) and onshore data (Direccio´n General de Minerı´a of Dominican Republic), gridded to 1 min and contoured each 10 mGal
Caribbean slab into the lithospheric mantle. The Caribbean oceanic plateau has densities significantly lower than the mantle densities and contributes to yield a mass deficit beneath the inner insular slope. The only way to compen-sate this mass deficit and adjust the model with such sub-duction would be to use an unrealistically thin arc crust of less than 25 km. It would also be necessary to bend the slab downwards too much (to an almost vertical angle) beneath the deformed belt, which seems to be in disagreement with the detachment geometry inferred from the seismic-reflection studies (Granja Brun˜a et al.2009).
The model with a high-angle subduction reflects a hypothetical geometry with the top of the Caribbean slab bending *25 more than in the previous model inferred from seismicity (Fig.6b). The geometry used in this model fits the area of the inner island arc well with the Moho located at 32 km of depth (0–30 km of distance in Fig.6b), unlike the low-angle subduction model that was unable to fit this area. However, this model has a regional mass deficit between the distances of 30–130 km, reaching a maximum of *40 mGal at 80 km of distance (measured with the horizontal scale of the model in Fig.6b). As in the low-angle subduction model, this mass deficit has a long wavelength, indicating a deep causative source.
The interpretations derived form the seismicity data suggest that the subducted Caribbean slab could reach more than 100 km of depth in the eastern Hispaniola (Dillon et al. 1996). Limiting the depth of the model to 50 km implies that the slab (Fig.6a, b), because of its lower density crust, will act as a mass deficit relative to the surrounding mantle. However, if the model went deeper, then the subducting slab as a whole is a negative buoyancy or positive mass feature. This factor has been facing gravity modelers at subduction zones for decades (Hayes
1966; Grow and Bowin 1975). Then, in order to test the effect of a deeper subducted slab we have performed a gravity model extending the slab deeper (Fig.6c). Using the geometry of the high-angle subduction model in the shallower zones (Fig.6b) we prolonged the Caribbean slab until 80 km of depth. We did not extend deeper the model because we do not have constrained data and also to avoid interaction with the asthenosphere, which will add more complexity to the gravity modeling. This model also has a regional mass deficit, but a bigger one than in the previous subduction cases (Fig.6a, b). The maximum mass deficit reaches*60 mGal and is located between the distances of 50 and 75 km where the subducted slab starts to replace the mantle material. Toward the island arc the mass deficit progressively decreases as the subducted slab becomes deeper.
To perform a model in agreement with the theoretical density models for the downgoing slab computed from thermal and petrologic data (Grow and Bowin,1975), we
consider the transformation of the petrology of the oceanic lithosphere to eclogite and garnet peridotite (Fig.6d). This transformation implies a significant increase of density reaching 3.4–3.5 g/cm3and taking place at depths of more than 30 km. Then, in deeper zones the subducted slab tends to show more negative buoyancy. This model compensates the mass deficit yielded by the subducted slab in the pre-vious model (Fig.6c), but does not compensate the mass deficit in the region where the slab starts to sink in the mantle. The regional mass deficit of this model is very similar to the model of high-angle subduction (Fig.6b) reaching*40 mGal.
In the high-angle subduction models the mass deficit occurs roughly in the upper zone of the deformed wedge (i.e., Muertos thrust belt; Fig. 6b–d). As we pointed out in the section ‘‘Insular slope’’, the deep geometry and the properties of the deformed wedges in convergent settings is not well known mainly due to difficulty to get seismic data of good quality in these settings. We have used a density of 2.3 g/cm3for the deformed wedge unit assuming an aver-age value of density derived from seismic velocities cal-culated in similar compressive settings (Yuan et al.1994; Flueh et al. 1998). To test if the used density value is underestimated and contributes to yield the observed mass deficit, we built a gravity model simulating a high-angle subduction scenario and using densities of 2.4 and 2.5 g/ cm3for the deformed wedge (Fig.6e, f). The model with deformed wedge with density 2.4 g/cm3(Fig.6e) shows a general reduction of the mass deficit (*10 mGal) in rela-tion to the model with 2.3 g/cm3(Fig.6b). The reduction is more evident in the region located 100 and 125 km of distance which corresponds with the lower zone of the deformed wedge and where the Caribbean crust starts to bend. However the model shows a maximum mass defi-cit*30 mGal located in the upper zone of the deformed wedge. The model with deformed wedge with density 2.5 g/cm3(Fig.6f) also shows a general reduction of the mass deficit in relation to the model with 2.3 g/cm3 (Fig.6b). However the model shows a maximum mass deficit *30 mGal also located in the upper zone of the deformed wedge. On the other hand, this model shows a mass excess located in the region located 75 and 125 km of distance which corresponds with the middle and lower zones of the deformed wedge. The maximum mass excess is *17 mGal located in the lower zone of the deformed wedge. The increase of density in the deformed wedge has influence in the reduction of the mass deficit but it cannot reduce the mass deficit in the region where the Caribbean slab is sinking in the mantle. Therefore, independently of the density value used for the deformed wedge unit; 2.3, 2.4 or 2.5 g/cm3, the gravity models simulating a subduc-tion scenario show a maximum mass deficit located where the Caribbean slab is sinking in the upper mantle.
We interpret that the mass deficit is due to the presence of the Caribbean plateau beneath the insular slope replac-ing denser mantle materials. The maximum mass deficit appears essentially when the Caribbean slab significantly increases its subduction angle and it sinks into the mantle. The residual of the calculated curve slightly varies increasing with the subduction angle; testing to vary this model we observed that the mass deficit is controlled by the location and the geometry of the subducted slab.
We have demonstrated how the subduction models imply the existence of a regional mass deficit generated by the subducted Caribbean slab beneath the island arc and that variations in the geometry of the subduction angle and the depth are not able to compensate it. If the subducted slab beneath the island arc extends farther than the model in Fig.6a, the mass deficit in the arc region increases. Both of these observations suggest that there is not a subducted Caribbean plateau beneath the island arc. Because the gravity models were located in the area where the sub-duction process should be more evident and where the Muertos thrust belt is wider, and we were not able to fit the data, we interpret the absence of a subducted Caribbean slab laterally along the Muertos Margin.
Alternative non-subduction model
Considering that we have not found a subduction geometry that fits the gravity data and that the Muertos thrust belt could be a result of the thrusting of the island arc crust over the Caribbean plateau (ten Brink et al.2009), it is necessary to propose an alternative tectonic model. We have built gravity models where the accommodation of the com-pressive deformation in the upper crust takes place by means of a thin-skin tectonics and with a single and gentle-dip basal detachment (Fig.6g, h). These models require: a zone of basal detachment in the lower crust between the lower arc crust and the Caribbean plateau to explain the *30 km N–S horizontal shortening observed in the upper crust by Granja Brun˜a et al. (2009); a shallower mantle beneath the island arc slope; and the non-existence of the subducted Caribbean slab beneath the inner arc crust. The obtained gravity models show a good fit (RMS\5 mGal) in the steep regional gradient between the Caribbean plate’s interior and the island arc, that neither the sub-duction models were able to fit. As well, the island arc region shows a good fit between the calculated and the observed values, again unlike the subduction models.
We tested several tectonic models changing the depth and the geometry of the island arc-plateau interface, but conserving the width of the thrust belt and the detachment geometry in agreement with the seismic-reflection data (Ladd et al.1977; Granja Brun˜a et al.2009). We found two
main possible solutions that are present in Fig.6g, h. These two solutions are possible because at the depth of the lower crust the gravity modeling is not able to discriminate between the arc crust and the plateau, because their den-sities and extension in depth are very similar. The first model includes a overthrusted Caribbean slab extending 100 km northward from the deformation front to a depth of 29 km (Model with longer thrusting, Fig.6g). It requires a constant thrusting angle of 15 in the lower crust, which seems to be unrealistic because the overburden of the island arc crusts should yield a progressive increase of the thrusting angle in depth. This model also shows the end of the thrusted Caribbean crust with a strange thinning resulting in an unlikely geometry. As we mentioned above we interpret that this density model is able to fit the gravity data because there is not enough resolution to discriminate between the arc crust and the plateau crust at this depth. The other possible model has an overthrusted Caribbean slab extending 60 km northward from the deformation front to a depth of 22 km (Model with shorter thrusting, Fig.6h). This last gravity model requires a progressive increase of the thrusting angle from 8 in the shallower areas to 30in deeper areas. We consider that this model is geologically more realistic because it reflects a progressive increase in the thrusting angle in depth due to the over-burden of the island arc crust and also explains the N–S horizontal shortening observed in the upper crust.
Suggested tectonic model for the Muertos Margin From the results obtained with the gravity modeling, together with the review and discussion of the tectonics and seismicity of the north-eastern Caribbean region, we pro-pose an alternative tectonic model for the deeper structure of the Muertos Margin south of eastern Hispaniola (Fig.8). The new model does not require the existence of a sub-duction process in the Muertos Trough. It is able to explain the tectonics of the area by means of overthrusting of the island arc crust over the Caribbean plateau, requiring at least 60 km of N–S horizontal shortening. This N–S component is in agreement with the sandbox kinematic modeling where the oblique convergence between the North American and Caribbean plates is totally resolved in the inner arc and in the forearc areas, instead of in the retroarc (ten Brink et al. 2009). The focal mechanism solutions of events\40 km-deep located close to the gravity models have a thrust component and nodal planes mainly oriented E-W, features that are compatible with an N–S shortening (Figs.4, 5c, d). In the upper crust the thrusting takes place with a gentle dipping basal detach-ment, the same that has been observed in the reflection seismic data (Granja Brun˜a et al. 2009). Although we do
not have seismic information to resolve the structure of the lower crust, we interpret that the observed shortening in the shallower structure should be accommodated with a single or a more or less complex plate interface (i. e. detachment) between the arc and plateau crusts (See inset in Fig.8). Calvert et al. (2006) suggested that at depths greater than 20 km some thrusting may be distributed over shear zones that are several km thick, and crustal blocks are likely to be deformed in a ductile style, but we are not able to dis-criminate what processes are implicated in the lower crust. The thickening of the crust beneath the insular slope could be associated with basal accretion and/or subduction ero-sion. A complex interface might imply the partial imbri-cation and thickening of the oceanic plateau. Although, there is a big uncertainty in the seismicity relocation and in the focal mechanism solutions, our suggested tectonic model is also in agreement with the existence of shallow seismicity (\30 km-deep) beneath the southern arc crust and the associated reverse focal mechanisms (e. g. 1984 M=6.7 event), because thrusting activity is neces-sary to explain such characteristics. The model also fits the deep seismic sounding modeling where several north-dip-ping reflectors were identified in the lower crust beneath the southern insular slope (Co´rdoba et al. 2008). These reflectors could be interpreted as north-dipping thrust planes or sheets defining a structure of the southern insular slope crust with different accreted terrains. Such accreted terrains from Jurassic to Tertiary ages were documented in the onshore geology as in Hispaniola as in Puerto Rico (Lewis and Draper1990; Smith et al.1998).
Conclusions
1. In the northeast Caribbean the distribution of the seismicity in depth is very diffuse, especially in the eastern Hispaniola region. This makes definition of the plate geometry difficult and does not provide enough support to explain the subduction of the Caribbean slab beneath the island arc.
2. The results of the gravity modeling reject the existence of a Caribbean slab subducting beneath the island arc along the Muertos Trough. Gravity models simulating a subduction yield a regional mass deficit (reach-ing *40 mGal) that several changes in the geometry and depth of the subducted slabs are not able to compensate. The best adjustment of the gravity data requires an overthrusted Caribbean slab extending between 60 km and 100 km northward from the deformation front. The model that is geologically more realistic requires a northward progressive increase in the thrusting angle from 8to 30, reaching a maximum depth of 22 km beneath the insular slope. 3. The results obtained with the gravity modeling allow us to propose a new tectonic model for the Muertos Margin in agreement with the deformational features of the upper crust, the results of the sandbox kinematic modeling, the deep seismic sounding modeling and the focal mechanism solutions. The new tectonic model for the Muertos Margin in the south of eastern Hispaniola is defined as a retroarc thrusting where a gentle dipping basal detachment yields at least 30 km Fig. 8 Suggested tectonic model for the Muertos Margin integrating
the results of this study, together with the review and discussion of the tectonics of the north-eastern Caribbean region. Cross-section through the Muertos Margin in eastern Hispaniola where the deformed belt is wider. The blue line marks the overthrusted Caribbean slab (oceanic plateau). Interrogations indicate the uncertainty of the geometry and of the location of the backstop and the depth of the Moho beneath the
island arc. Shallower thrust faults are derived from the interpretation of seismic profiles, but deeper faults are inferred from the\30 km-deep seismicity and the north-dipping reflectors identified by Co´rdoba et al. (2008). Focal mechanisms are from the 1984 M=6.7 event from Byrne et al. (1985) and from the Harvard CMT catalog (Dziewonski et al.1981)
of N–S horizontal shortening in the upper crust. This shortening has to be accommodated in the lower crust with a single or a more or less complex plate interface. 4. The use of gravity modeling has provided targets for future wide-angle seismic surveys through which the deep structure of the Muertos Margin and the Moho depth beneath the island arc may be elucidated. This methodology may be useful to test tectonic models in island arcs where there is not much information about deep structure.
Acknowledgments We are in debt to the Captain, officers, and crew of the R/V Hespe´rides and the technicians of the Unidad de Tec-nologı´a Marina and the U. S. Geological Survey for their professional help at sea. This work has been supported by the Spanish Ministry of
Education and Science (leaded by Andre´s Carbo´-Gorosabel and Diego Co´rdoba-Barba; Projects REN2003-08520-C02-01, CTM2006-13666-C02-01 and complementary action REN2002-12855-E/MAR), the U.S. Geological Survey Coastal and Marine Program, and the Puerto Rico Seismic Network. J. L. Granja was funded with a doctoral grant from the Spanish Ministry of Education and Science. We also want to thank the Direccio´n General de Minerı´a of Dominican Republic for providing the onshore gravity data. We also thank to the anonymous reviewers for their constructive comments and suggestions.
Appendix 1 See Fig.9.
Fig. 9 North-south cross-section of seismicity. For location see Fig. 4. Hypocenter data come from the Puerto Rico Seismic Network between 1986 and 2009. Events with RMS[1.5, horizontal error[10 km, vertical error[20 km and Ms\3.5 have been excluded. Data were plotted including events located to 70 km each
side of the north–south central heavy line of Fig. 4 at longitude 69W. Heavy line at the top of the figure represents bathymetry-topography along the north–south central line of each cross-section and with vertical exaggeration 109
Appendix 2 See Fig. 10 . Fig. 10 Line drawing interpretation of the migrated seismic reflection profile across the Muertos Margin south of eastern Hispaniola (adapted from Granja Bru n˜ a 2008 ). See Fig. 2 for location. Vertical exaggeration at the sea floor is by * 2.0