Table 1. Functions for state IPM programs and current number of states with a criterion. Program Management
Designated coordinator 18
Manage the Smith-Lever 3(d) funds 26 Obtain extramural funding 41 Adequate technical support 24 Adequate Facilities and Equipment 41 Program management structure 53 Planning/priority setting process 45 Assure IPM program recognition 53 Professional development
opportunities 45
Program Delivery Communication system
(e.g., Web site, list-serv) 51
Grants program 22
Produce extension materials,
manuals, guides, etc. 49
Provide IPM consultation 34
Seek funding for cooperators 28 Conduct education
& training activities 52 Means of measuring benefits
(e.g., surveys, statistics) 53 Program Involvement
Cooperative extension collaboration 53
Research collaboration 52 Clientele collaboration 51 Interdisciplinary scope 53 Inter-institutional collaboration 52 Statewide involvement 52 Regional, national
& international liaison 43 Program Support
USDA, CSREES 54
Regional IPM Center 54
University administration 30
Unit leader 30
Clientele 20
54 state IPM coordinators responded, adapted from information provided by Mike Fitzner , USDA, CSREES.
Functions, Evolution, and Benefits of State
Integrated Pest Management Programs
N. C. Leppla, D. A. Herbert, Jr.,
and D. D. Thomas
T
he purpose of the Land Grant Uni-versity Integrated Pest Management (IPM) Program has been to minimize economic, health, and environmental risks by establishing sustainable pest manage-ment systems in rural and urban environ-ments (T. Fuchs, personnal communication, Professor and Extension IPM Coordinator, Texas A&M University (retired)). These programs have become highly productiveand cost effective, consistently delivering valuable benefits to university administra -tions, key clientele groups, and the citizens of the states in which they operate. IPM is the coordinated use of pest and environmental information, along with available pest con-trol methods, to prevent unacceptable levels of pest damage by using the safest and most economical means (adapted from Bajwa and Kogan 2000).
Each state IPM program is uniquely
structured to effectively manage available
resources through cooperative planning, priority setting, and accountability. Partner-ships are established and maintained among researchers, who are the source of new technologies, and extension personnel, who deliver new information and training. Typi-cal clientele-oriented products include pest
management guides, training aids, scientific
and trade journal articles, newsletters, dis-plays, lectures, and workshops. These state IPM programs make up a powerful national IPM network with 56 individual state and commonwealth programs organized into four geographical regions. This network provides an essential mechanism for coor-dinating inter-state and multidisciplinary IPM research and educational projects that deliver much-needed information and
technologies. Therefore, to have the most effective and efficient pest management
capabilities and capture the benefits of the
national IPM network, every land grant university should consolidate its IPM
activi-ties into an identifiable, coherent statewide
program. In this article, we describe the functions, development, and extraordinary
benefits of robust and comprehensive state
IPM programs.
Primary Functions of a State IPM Program
A state IPM program that encompasses all of the primary functions (Table 1) must have a full-time state IPM coordinator1 who manages the Smith-Lever Act, Section 3(d) [S-L 3(d)] formula funding for IPM (USDA, CSREES 2008). Strong state programs (i.e., those with full-time coordinators who man-age the 3(d) funds) operate highly successful minigrant programs that generate new, in-novative IPM projects. State IPM programs almost always obtain extramural funding. A reasonable goal is to augment the federal 3(d) funds with at least an equal amount from other sources to ensure adequate technical support, facilities, equipment, and other resources necessary for a successful program.
An effective state IPM program serves
as the primary contact point for commu-nication about and consultation on pest management activities. Currently, this kind of facilitation is accomplished by
maintain-ing a Web site and list of stakeholders who continuously receive and comment on cur-rent information electronically. Examples of useful information include grants and other
Postmarked Extensio
n
1The 1862 Land Grant university in each state
re-ceives Smith-Lever Act, Section 3(d) formula funding
for IPM. Beginning in federal fiscal year 2009, 1890
Land Grant institutions also became eligible for these funds. Thus, some states now may have more than one IPM coordinator.
sources of funding, extension resources, pest management alternatives, opportunities for collaboration, announcements of education and training events, the availability of em-ployment, and communications forwarded by the university administration, regional IPM center, and USDA, CSREES (now the National Institute of Food and Agriculture, NIFA). A Web site is ideal for showcasing IPM success stories, archiving reports and publications, and serving as a repository for extension materials (e.g., links to current IPM information, training projects, Master Gardener and Master Naturalist resources, and presentations). It is essential to posi-tion a state IPM program to support IPM activities throughout the state, recognize its role and contributions, and measure its
benefits.
State IPM coordinators typically provide statewide interdisciplinary and interunit coordination and assistance among faculty members and stakeholders to protect various combinations of agriculture, communities, and natural areas from pests and diseases. To accomplish this goal, each coordinator eventually develops a unique state IPM program, while retaining a high proportion of the primary functions. This level of orga-nization is achieved best by an active state IPM coordinator, rather than a regional or national administrator, because most IPM opportunities and activities occur locally. Sustained progress in adopting IPM depends on the “people on the ground” having face-to-face, on-site interactions with clientele (e.g., demonstrations, educational programs, and training at farms, schools, nurseries, orchards, timber lots). An effective state IPM coordinator must be well trained, highly motivated, and appropriately compensated. There also must be program continuity, coordinators who have the experience and network of contacts to gain the respect and
confidence of clients, current and potential.
State IPM coordinators are usually members of advisory committees, for which they pro-vide connectivity and guidance. They operate as entrepreneurs who, as interdisciplinary
members of the scientific community, are
positioned to identify and mobilize the best available researchers. Often, the state
IPM coordinator leads the effort to obtain
funding for research and extension projects conducted by the partners. This involvement assures that joint projects are well organized, productive, and monitored for accountability
(Hoffman and Grabowski 2004).
The state IPM coordinator helps to
iden-tify and establish priorities for managing pest problems and develops and implements new pest management technologies to solve them in collaboration with public and private organizations, thereby improving
agricultural productivity and profitability,
safeguarding human and animal health, and preserving natural resources (National IPM Symposium 2003). The coordinator
identifies local needs and accesses prob -lem-solving resources in the region, nation,
and world. This work requires scientific,
entrepreneurial, and administrative skills beyond the requirements of a typical faculty
assignment. Specific duties include:
1. Support and encourage county exten-sion faculty and agricultural and urban clientele in planning, developing, and implementing IPM projects;
2. Form collaborative partnerships com-posed of faculty and clientele group members to enhance the development and delivery of IPM practices;
3. Serve as the state contact for IPM informa-tion and coordinate this activity with pest management discipline specialists; 4. Serve as a focal point for institutional IPM
issues and a link between clientele and the land grant university;
5. Keep current and support faculty IPM re-search, extension, and teaching programs and activities;
6. Encourage the development of grant pro-posals by faculty teams to submit to agen-cies and organizations funding IPM; 7. Promote the state IPM program in local,
regional, and international settings; 8. Document and disseminate information
on achievements in IPM; and
9. Maintain close working relationships with land grant university administrators, including department chairs, center di-rectors, and district extension didi-rectors, in advancing IPM research, extension, and teaching.
2008 Survey of State IPM Programs We conducted a survey of the national IPM network in 2008 to determine the level of development of the primary func-tions for each state IPM program (Table 2). Almost every state (98.1%) had some level of coordinated state IPM program versus a set of independent IPM activities. Most of these programs had been in place for >10 yr (86.8%); however, several were established during the past 5–10 yr (9.4%). Only one was started in the past 3–5 yr and another within the past 1–3 yr.
Although state IPM programs had much in common, each was tailored to meet the
needs of its specific stakeholders. Some
programs were highly organized, structured, and proactive, whereas others were informal and responsive to more immediate situa-tions. Often the level of formalization was determined by available resources and the pest management needs of cooperators. Consequently, most state IPM programs
had identified clientele (94.3%); but more
than half operated according to a mission statement (60.4%) and written objectives (64.2%). All of the programs emphasized agriculture, but most also were active in community IPM (60.4%), and many includ-ed natural areas (37.7%). These programs were expanding in the areas of school IPM, urban agriculture, urban forestry, parks and recreation, invasive species, and regulatory agriculture. Liaison was increasing with the National Plant Diagnostic Network and associated regional networks.
State IPM programs were funded primar-ily by federal S-L 3(d) funds (100%) and state appropriations (32.1%). In federal
fiscal year (FY) 2008, 16 states leveraged
S-L 3(d) funds to obtain $4,733,500 in state appropriations (r = $3,000–1,500,000/ state). Other sources of funding were grants (62.3%), contracts, cooperators, and in-kind contributions, such as Master
Gardener time. Beginning in FY 2008, S-L
3(d) funding was subject to the Grants.gov submission process (Grants.gov is a program
for finding and applying for federal govern
-ment grants (http://grants.gov/), to assure
that all administrative requirements were met and the funds were used exclusively for IPM activities. The S-L 3(d) funds were managed by the state IPM coordinator in only half of the states (50.0%) and <10% were available in >20% of the states (Fig. 1). Most state IPM coordinators received some level of state support for personnel, facilities, and equipment associated with their faculty positions. For example, state ap-propriations were a major source of funding for state IPM coordinator salaries (44.4%), whereas S-L 3(d) funds supported 27.8%, and grants made up 5.6%. In some cases, a mixture of state and S-L 3(d) funds paid the salary of a state IPM coordinator and, in other cases, base extension Hatch funds were used.Hatch Act funds are provided by the USDA for agricultural research on an annual basis to the State Agricultural
Experiment Stations (http://www.csrees.
html).State IPM coordinators often had teaching, research, administrative, or county extension appointments that provided their salaries. Combinations of federal, state, and university funds were used for salaries at various times, including partial funding from state departments of agriculture.
In addition to state IPM coordinators, personnel in the state IPM programs included associate or assistant coordina-tors (32.7%); extension agents (44.2%); graduate students (21.2%); volunteers, such as Master Gardeners, (11.5%); and cooperators, including extension special-ists, research associates, information
technologists, staff writers, administrative
assistants, technicians, hourly employees, undergraduate students, and farmers. S-L 3(d) funds supported 30.4% of the addi-tional personnel, whereas 26.0% were paid with state funds. Grants provided support for 30.4%; and 13.0% were funded from base extension, state, or federal sources. Personnel from the land grant universities (e.g., information technologists, graphic arts, and clerical assistants) were available to 44.4% of the state IPM coordinators. How-ever, many coordinators expressed a need
for additional staff to meet the increasing demand for extension activities in the field,
education and training, technical and report writing, educational programming, pest and disease diagnostics, IPM coordination, technical assistance in the laboratory and
field, and office support.
State IPM coordinators tended to remain in the position for many years, some 20 or more (Fig. 2). The duration of time in ser-vice was 20 yr or more (16.7%), 15–20 yr (7.4%), 10–15 yr (20.4%), 5–10 yr (24.1%), 1–5 yr (26.0%) and <1 year (5.6%). Only 35.3% of the coordinators spent their full time on IPM activities, declining to 5.6% for 50–75% of their time, 30.6% for 25–50%, 41.7% for 10–25%, and 22.2% for <10%. Most coordinators were tenured profes-sors (53.7%) with some tenured associate professors (3.7%), tenure-track assistant professors (3.7%), and nontenured faculty (24.1%). Curiously, 14.8% were not faculty members. State IPM coordinators typically were located on the main campuses of land grant universities (75.5%), which is pre-ferred; but about a quarter were housed
off-campus (24.5%). Generally, their facili -ties and equipment were deemed adequate (77.4%); but some improvements were needed in research facilities and equip-ment, particularly diagnostic instruments
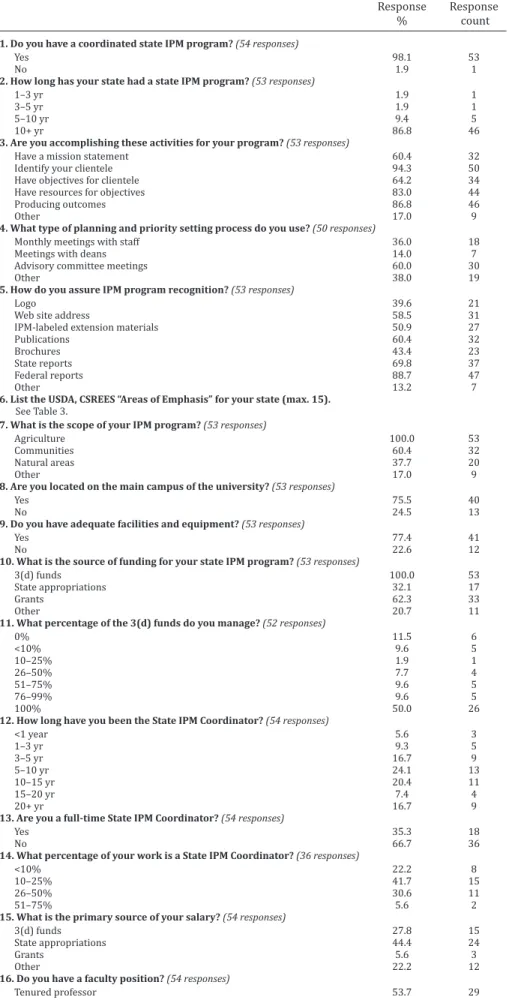
Table 2. Summary of 2008 Survey of State IPM Programs. Responses for the category “Other” are described in the text.
Response
% Response count 1. Do you have a coordinated state IPM program? (54 responses)
Yes 98.1 53
No 1.9 1
2. How long has your state had a state IPM program? (53 responses)
1–3 yr 1.9 1
3–5 yr 1.9 1
5–10 yr 9.4 5
10+ yr 86.8 46
3. Are you accomplishing these activities for your program? (53 responses)
Have a mission statement 60.4 32
Identify your clientele 94.3 50
Have objectives for clientele 64.2 34
Have resources for objectives 83.0 44
Producing outcomes 86.8 46
Other 17.0 9
4. What type of planning and priority setting process do you use? (50 responses)
Monthly meetings with staff 36.0 18
Meetings with deans 14.0 7
Advisory committee meetings 60.0 30
Other 38.0 19
5. How do you assure IPM program recognition? (53 responses)
Logo 39.6 21
Web site address 58.5 31
IPM-labeled extension materials 50.9 27
Publications 60.4 32
Brochures 43.4 23
State reports 69.8 37
Federal reports 88.7 47
Other 13.2 7
6. List the USDA, CSREES “Areas of Emphasis” for your state (max. 15).
See Table 3.
7. What is the scope of your IPM program? (53 responses)
Agriculture 100.0 53
Communities 60.4 32
Natural areas 37.7 20
Other 17.0 9
8. Are you located on the main campus of the university? (53 responses)
Yes 75.5 40
No 24.5 13
9. Do you have adequate facilities and equipment? (53 responses)
Yes 77.4 41
No 22.6 12
10. What is the source of funding for your state IPM program? (53 responses)
3(d) funds 100.0 53
State appropriations 32.1 17
Grants 62.3 33
Other 20.7 11
11. What percentage of the 3(d) funds do you manage? (52 responses)
0% 11.5 6 <10% 9.6 5 10–25% 1.9 1 26–50% 7.7 4 51–75% 9.6 5 76–99% 9.6 5 100% 50.0 26
12. How long have you been the State IPM Coordinator? (54 responses)
<1 year 5.6 3 1–3 yr 9.3 5 3–5 yr 16.7 9 5–10 yr 24.1 13 10–15 yr 20.4 11 15–20 yr 7.4 4 20+ yr 16.7 9
13. Are you a full-time State IPM Coordinator? (54 responses)
Yes 35.3 18
No 66.7 36
14. What percentage of your work is a State IPM Coordinator? (36 responses)
<10% 22.2 8
10–25% 41.7 15
26–50% 30.6 11
51–75% 5.6 2
15. What is the primary source of your salary? (54 responses)
3(d) funds 27.8 15
State appropriations 44.4 24
Grants 5.6 3
Other 22.2 12
16. Do you have a faculty position? (54 responses)
Tenured professor 53.7 29
and computers. Professional development opportunities were provided for state IPM coordinators, especially participating in
sci-entific meetings (93.5%), enrolling in formal
courses (13.0%), and attending or present-ing seminars (82.6%). Technical meetpresent-ings, workshops, short courses, and tutorials were available, along with supervisory train-ing and leadership development.
Generally, state IPM programs were highly coordinated and well managed; most operated statewide (96.3%), as well as regionally, nationally, and internationally
to enhance their ability to serve identified
clientele (81.1%). Inter-institutional col-laboration was common, and constant IPM consultation was expected. Collaboration was primarily with the Cooperative Exten-sion (98.1%), research faculty (96.3%), cli-entele (94.4%), federal institutions (68.5%), state departments of agriculture (94.4%), and departments of environmental protec-tion (50.0%). Federal cooperators often were the USDA (ARS, APHIS, CSREES, IR-4,
and NRCS) and EPA. Significant intrastate
interactions occurred with environmental groups, such as the Nature Conservancy and Ducks Unlimited; the Farm Bureau;
scientific societies; commodity groups; state
departments of education and health; water management and soil conservation districts; and so forth.
Regionally and nationally, state IPM coordinators typically interacted with their IPM center and USDA, CSREES 1–5 times
per year (50.0%, 77.8%) but a significant
number collaborated 6–10 times (18.5%, 7.4%) and more than 10 times annually (22.2%, 5.6%). They conducted multistate research projects, served on grant proposal review panels, helped with plant clinics and regional and national distance diagnostics, hosted education and training workshops and teleconferences, prepared joint publi-cations (e.g., pest management guides and
insect identification photographs), worked
with commodity groups (e.g., potato, cotton, fruit and other groups; produced pest man-agement strategic plans), established re-gional IPM priorities, developed multistate training materials, cooperatively conducted pest and disease surveys (e.g., invasive spe-cies), provided information on pesticide use, participated in the cooperative agricultural pest survey and other important activities, and served on regional and national IPM coordinating committees.
State IPM coordinators contributed valu-able IPM consultation in other countries.
Tenured associate professor 3.7 2
Tenure-track assistant professor 3.7 2
Nontenured faculty 24.1 13
Not faculty 14.8 8
17. What faculty or staff members work in your IPM program? (52 responses)
Asst. State IPM Coordinator 32.7 17
Graduate students 21.2 11
IPM extension agents 44.2 23
Volunteers 11.5 6
Other 38.5 20
18. What is the source of funds for faculty and staff members? (46 responses)
3(d) funds 30.4 14
State appropriations 26.0 12
Grants 30.4 14
Other 13.0 6
19. Do you have adequate support personnel? (54 responses)
Yes 44.4 24
No 55.6 30
20. What kind of support do you need? (29 responses) Responses summarized in text.
21. Is your IPM program the main state contact for IPM? (54 responses)
Yes 90.7 49
No 9.3 5
22. What type of communication systems do you have? (54 responses)
Web site 87.0 47
List-serv 50.0 27
Mailing 48.1 26
Newsletter 53.7 29
Other 18.5 10
23. Do you have a mini-grants program? (53 responses)
Yes 41.5 22
No 58.5 31
24. What is the avg. annual funding for your mini-grants program? (22 responses)
$25,000 or less 45.5 10
$25,000–$50,000 27.2 6
$50,000–$100,000 13.6 3
$100,000 or more 13.6 3
25. What is the average number of mini-grants each year? (18 responses)
1–5 grants 38.9 7
6–15 grants 50.0 9
16–25 grants 11.1 2
26+ grants 16.7 3
26. What is the source of funding for your mini-grants? (22 responses)
3(d) funding 81.8 18
State appropriations 9.1 2
Grants 4.5 1
Other 4.5 1
27. Do you design, write, or compile IPM materials? (52 responses)
Manuals 61.5 32
Guides 65.4 34
Brochures 53.8 28
Posters 55.8 29
Fliers 46.2 24
On-site training materials 73.1 38
On-line training materials 48.1 25
None of the above 5.8 3
Other 21.2 11
28. Do you provide IPM consultation? (54 responses)
Yes 63.0 34
No 37.0 20
29. To what clientele groups do you provide consultation? (34 responses)
Extension agents and specialists 91.2 31
Commodity groups 79.4 27
General public, growers 82.4 28
News media 67.6 23
Other 20.6 7
30. What kind of consultation do you provide? (34 responses)
Pest management 97.1 33
Disease management 73.5 25
Educational information 94.1 32
Referrals to specialists 82.4 28
Other 5.9 2
31. Do you seek funding for cooperators? (54 responses)
Yes 51.9 28
No 48.1 26
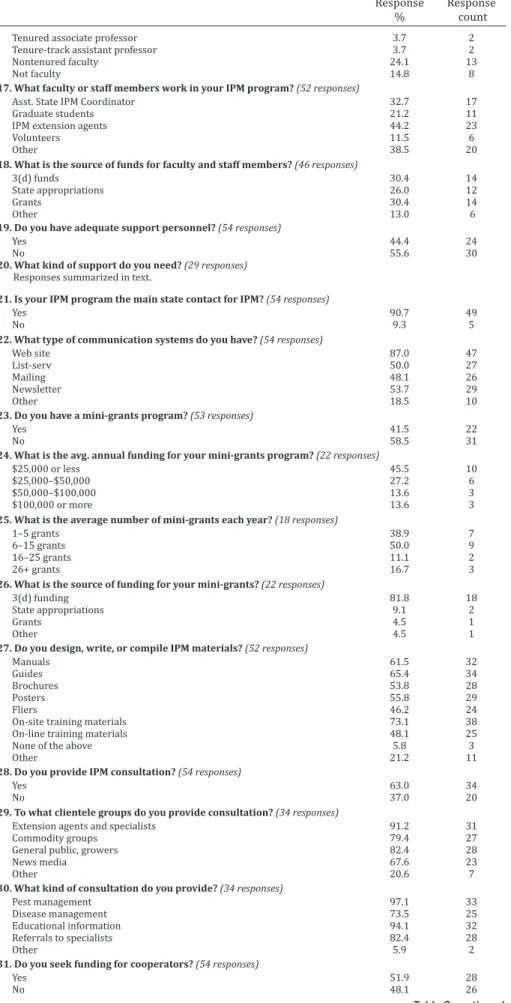
Table 2. Summary of 2008 Survey of State IPM Programs. Responses for the category “Other” are described in the text.
Response
% Response count
They participated in the U.S. AID IPM Collab-orative Research Support Program (CRSP)
and worked with international scientific
societies, organizations, and companies.
State IPM coordinators and their staff
members were the primary sources of leadership and advocacy for their state IPM programs. However, fewer than half of the coordinators held monthly meetings with their personnel (36.0%), probably because most of these groups were small or dispersed across the state. Astute state
IPM coordinators identified opportunities
by participating in relevant activities and gleaning useful information. Some of the best ideas for advancing state IPM programs came from annual meetings of state IPM co-ordinators, USDA, CSREES regional research projects, Extension in-service training, and seminars on topics related to IPM. Guidance and administrative support was provided by a variety of stakeholders, often advisory committees (60.0%) comprised of extension partners, agricultural and community lead-ers, natural resource managlead-ers, and others formed to help establish priorities. Other sources of guidance for state IPM programs (38.0%) included meetings with department heads, cooperating faculty members, exten-sion agents and administrators, university groups involved in IPM, growers, grower groups, crop consultants, county advisory groups, and agri-businessmen. Stakehold-ers formed working groups that planned individual projects and ranked associated goals. IPM priorities also were gleaned from pest surveys and pest management strategic plans. Administrative guidance was deemed excellent, but state IPM coordinators met with university deans infrequently (14.0%). Appreciation of state IPM programs was almost universal from department chairs, higher level administrators, and clientele groups.
Productivity of state IPM programs depended on effective mechanisms for establishing research and extension partner-ships, and delivering IPM information and technologies (94.1%) or referring clientele to specialists (82.4%). Most state IPM coor-dinators were goal-oriented problem solvers who sought to produce useful outcomes
from their cooperative efforts; for example,
managing pests (97.1%) and diseases (73.5%). This cooperation was facilitated by obtaining and distributing competitive grant funds, operating IPM grants programs, developing and guiding project workgroups, meeting periodically with clientele groups
32. What type of funding do you seek for cooperators? (28 responses)
Grants 89.3 25
Contracts 28.6 8
Donations 32.1 9
Other 10.7 3
33. Do you conduct education and training activities? (54 responses)
Yes 96.3 52
No 3.7 2
34. What education and training activities do you conduct? (52 responses)
Extension in-service training 88.5 46
Clientele group meetings 84.6 44
Field days 86.5 45
University classes 63.5 33
Other 15.4 8
35. How do you measure the outcomes and benefits of your work? (53 responses)
Surveys 83.0 44
Statistics 50.9 27
Attendance, education, and training 92.5 49
Other 20.8 11
36. With which groups do you collaborate? (54 responses)
Cooperative extension 98.1 53
Research faculty 96.3 52
Clientele 94.4 51
Federal institutions 68.5 37
State Department of Agriculture 94.4 51
Department of Environmental Protection 50.0 27
Other 18.5 10
37. What disciplines are involved with your program? (54 responses)
Entomology 100.0 54 Nematology 61.1 33 Plant pathology 96.3 52 Weed science 81.5 44 Agronomy 70.4 38 Environmental studies 27.8 15 Horticultural science 72.2 39 Soil science 50.0 27 Other 13.0 7
38. Is your IPM program statewide? (54 responses)
Yes 96.3 52
No 3.7 2
39. Is your IPM program involved in the region, nation, global? (54 responses)
Yes 81.1 43
No 18.9 10
40. Involvement in the region, nation, global? (41responses)
Responses summarized in text.
41. Who provides administrative guidance to your program? (53 responses)
Unit leader (academic depart.) 56.6 30
University administration 56.6 30
Advisory committee 39.6 21
Clientele 37.7 20
Other 18.9 10
42. Do you have professional development opportunities? (53 responses)
Yes 84.9 45
No 15.1 8
43. What are your professional development activities? (46 responses)
Scientific meetings 93.5 43
Formal courses 13.0 6
Seminars 82.6 38
Other 17.4 8
44. How often do you interact with your regional IPM center? (54 responses)
Never 9.3 5
1–5 times/year 50.0 27
6–10 times/year 18.5 10
10+ times/year 22.2 12
45. How often do you interact with USDA, CSREES IPM? (54 responses)
Never 9.3 5
1–5 times/year 77.8 42
6–10 times/year 7.4 4
10+ times/year 5.6 3
46. Is your IPM program developing, stable, or increasing? (51 responses) Responses summarized in the text.
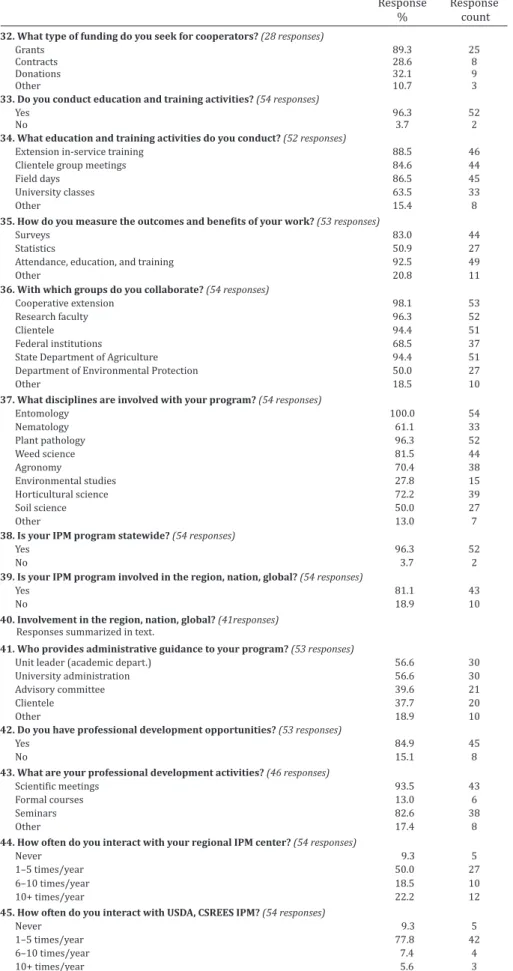
Table 2. (continured) Summary of 2008 Survey of State IPM Programs. Responses for the category “Other” are described in the text.
Response
to determine priorities, posting information and outcomes on Web sites, coordinating with programs and initiatives of the uni-versity and allied institutions that pertain to IPM, and requiring accountability for
resources provided through the efforts of
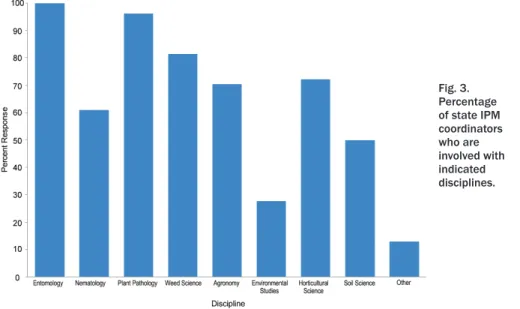
the state IPM coordinator. Interdisciplinary activities were considered essential; and the disciplines most involved in IPM were ento-mology (100%), plant pathology (96.3%), weed science (81.5%), horticultural science (72.2%), agronomy (70.4%), nematology (61.1%), and soil science (50.0%) (Fig.3). Across the national IPM network, informa-tion was delivered by Web sites (87.0%), e-mail list-servers (50.0%), mailing lists (48.1%), newsletters (53.7%), telephone, meetings, displays, and news releases.
IPM program grants were used to en-courage partnerships between researchers and extension agents in 41.5% of the states,
and the average number per year was 13.5 (r = 1–60). The average annual funding committed to this function was $1,865,000 (r = $5,000–570,000 per state); 81.8% came from S-L 3(d) funds, 9.1% from state revenue, 4.5% from extramural grants and 4.5% from other sources.
State IPM programs typically produced manuals (61.5%), guides (65.4%), brochures
(53.8%), posters (55.8%), fliers (46.2%),
and on-site (73.1%) and on-line (48.1%) training materials. Journal articles, books, reports, and fact sheets were contributed by 21.2% of the states; however, 5.8% did not generate IPM materials. Consultation was provided by 63.0% of the states to extension agents and specialists (91.2%), commodity groups (79.4%), the general public (82.4%), news media (67.6%), farmers, students, and pest control professionals, e.g., pest control operators and applicators (PCOs and PCAs).
State IPM coordinators sought funding for cooperators (51.9%) from grants (89.3%), contracts (28.6%), donations (32.1%), and state sources (10.7%).
Almost all conducted education and training activities in cooperation with exten-sion agents and specialists (96.3%). These activities included extension in-service training (88.5%), clientele group meetings
(84.6%), field days (86.5%), university
classes (63.5%), public workshops, Master
Gardener programs, site visits, field dem -onstrations, distance education, telephone and on-site conferences, non-university courses, and one-on-one training. The state IPM program was the main point of contact for IPM in 90.7% of the states.
Few state IPM coordinators were
satis-fied with the means available to measure and indicate the benefits of their programs,
but 40% had at least a rudimentary
mecha-nism in place. The outcomes and benefits of
their programs were measured by surveys (83.0%); statistics (50.9%); number of farm visits and grower meetings and their atten-dance (92.5%); and feedback from clientele (20.8%), including written evaluations; personal interviews, pesticide use reporting, acres infested, environmental impact, and the results from research projects.
Recognition was achieved by using a state IPM program logo (39.6%); provid-ing information for newspaper articles; partnering with public and private institu-tions; displaying exhibits at trade shows, state fairs, and other events; building pest management centers; volunteering to speak
at extension and scientific meetings; and
participating in regional organizations of state IPM coordinators and regional IPM centers. Because recognition of the contribu-tions of state IPM programs was essential, coordinators maintained branded Web sites and produced program-labeled extension materials (50.9%), publications (60.4%), brochures (43.4%), and state (69.8%) and federal (88.7%) reports.
The USDA, CSREES, Performance Plan-ning and Reporting System (PPRS) requires state IPM coordinators to report annual accomplishments for their states under “Areas of Emphasis” derived from a
clas-sification manual used for the Current Re -search Information System (CRIS), Manual
of Classification for Agricultural and Forestry Research, Education, and Extension (USDA, CSREES 2005. Each state had a unique set of Areas of Emphasis that, combined, indicated the scope of their IPM activities (Table 3).
Fig. 1. Percentage of 3(d) funds managed by the state IPM coordinator. Fig. 2. Number of years as state IPM coordinator.
State IPM programs varied widely in their development and stability, even though fed-eral S-L 3(d) funding has been provided to establish and maintain them since the 1970s (Jacobsen 1997). Some state IPM programs have continued to develop (15.6%), whereas others have remained stable (62.7%) or been reduced, but not eliminated (21.6%). Those that increased have added additional funding from competitive grants and formed partnerships with other parties, particularly state institutions. Although these kinds of
efforts sustained the IPM programs, long-term continuity may have suffered. One state
established a pest management center and others expanded into new Areas of Empha-sis. Stable IPM programs have consistently augmented S-L 3(d) funding declines due to
inflation and adjusted to changing priorities
(e.g., needs for community IPM, problems with invasive species, and new crops and associated pests). Even stable programs
required considerable effort to delay the
inevitable declines that occur without an increase in S-L 3(d) funds. For currently decreasing programs, S-L 3(d) funding has been reduced with a concomitant loss of personnel and productivity.
Previous Surveys of State IPM Programs
The first national survey of state IPM
coordinators was conducted about 20 yr after they were established (Gray 1995). It addressed some of the same questions as the current survey and provides a clear indication of how state IPM programs have advanced. The 45 states for which IPM coor-dinators responded received federal funding for an average of 17.4 yr (r = 7–22 yr), and about half received some level of state
sup-port (55.6%). Federal funds were used to support faculty salaries (75.6%), most for nontenure track positions (57.8%).
The primary goal of state programs was to “minimize pest damage, while being cog-nizant of the importance of environmental and sociological consequences.” Reduction in pesticide use was not the primary empha-sis; rather, most projects were intended to provide educational programs and resourc-es to clientele (91.1%). Advisory committeresourc-es were established to assure that projects addressed IPM priorities (48.9%). The state IPM coordinators believed that they had delivered on expectations (75.6%).
In a reassessment of state IPM programs, Gray (2001) described the disruptive cycling of funding support and suggested solu-tions. This paper characterized the diverse opinions about pesticide reduction as the measure of successful state IPM programs.
A follow-up survey (Ratcliffe and Gray 2004)
was sent to all of the state IPM coordina-tors following a Government Accounting
Office report (GAO 2001) that stated, “IPM
has resulted in some environmental and
economic benefits but use of the riskiest
pesticides remains substantial.” The survey indicated that the average number of years a state IPM coordinator had served was 9.1 (r = 1–29 yr). Most of the coordinators were
entomologists working in field, fruit, and
vegetable crops, but turf, structural, and ornamental pest management were well represented. Of the 48 state IPM coordina-tors who responded, most did not believe that the chief goal of an IPM program should be to reduce pesticide use (62.5%). However, 60.4% indicated that IPM had not delivered on the expectation of the early 1970s that pesticide use would decline if IPM
prac-Fig. 3. Percentage of state IPM coordinators who are involved with indicated disciplines.
Table 3. USDA, CSREES Areas of emphasis for state IPM programsand current number of states that include each area (47 state IPM coordinators responded).
Natural Resources and Environment Soil
Appraisal of soil resources 1 Water
Conservation and efficient use of water 1 Plants and Their Systems
Plant production
Plant management systems 1
Plant production
Weeds affecting plants 1
Integrated pest management systems 1 Natural Resources and Their Products Watersheds and River Basins
Watersheds and river basins, general 2 Atmosphere
Atmosphere, general/other 1
Trees, Forests, and Forest Products (excluding edible tree nut crops) Short rotation woody crops, including
holiday trees 2
Trees, forests, and forest products,
general 1
Rangelands and Grasslands
Rangelands, other 1
Rangelands and grasslands, general 3 Wildlife and Natural Fisheries Management, Endangered Species
Wild animals 1
Plants and Their Products Citrus
Citrus, general/other 2
Tropical/Subtropical Fruit
Banana 3
Tropical/subtropical fruit, general/other 1 Deciduous and Small Fruits
Apple 8
Cherry 1
Peach 3
Deciduous tree fruits, general/other 2
Cranberry 2
Strawberry 2
Berries and cane fruits, general/other 1
Wine grapes 1
Grapes, general/other 2
Deciduous and small fruits, general/other 5 Edible Tree Nuts
Pecan 2
Edible tree nuts, general/other 2 Vegetables
Potato 5
Beans (dry) 2
Melons 4
Cucurbits, other 3
Greens and leafy vegetables 1
Cole crops 4
Sweet potato 2
Onion, garlic, leek, shallot 1
Tomato 2 Peppers 2 Sweetcorn 4 Vegetables, general/other 13 Grain Crops Corn 11 Grain sorghum 3 Table 3 continued
tices were implemented. Even though the controversy about pesticide reduction be-ing a primary goal continued, there since has been general agreement that state IPM coordinators adhere to the IPM roadmap with the goals of economic improvement and reduction in potential risks to human health and environment.
Another survey conducted to character-ize the position of state IPM coordinator in the Southern Region (Herbert 2001) evaluated some of the criteria included our 2008 study. The survey compared the mis-sions, appointments, and job and reporting expectations of 12 state IPM programs. State IPM coordinators were most closely associ-ated with the extension mission, but they typically had split appointments that also included teaching or research responsibili-ties. They usually were tenure-track faculty members who specialized in entomology and did not have actual appointments as state IPM coordinators. Fewer than half had written position descriptions emphasizing IPM, but expectations for all of their
posi-tions included typical IPM accomplishments:
coordinating and facilitating grant writing, developing IPM research and extension programs, serving as spokespersons for IPM-related issues, planning and conducting IPM training, preparing IPM reports, etc.
Criteria for success were essentially the same as for any faculty member, particularly writing publications and grant proposals. Special consideration, however, was given to maintaining meaningful interactions with stakeholder groups, addressing community and agricultural IPM, and documenting IPM adoption and impact. Some of the most important accomplishments included coordinating working groups to develop projects, facilitating grant writing, and in-creasing competitive funding. Nevertheless as for other faculty members, university tenure and promotion evaluations for state IPM coordinators favored individual ac-complishments, particularly when it was
difficult to determine the contributions of
each team member. Annual evaluations were conducted by combinations of university administrators, usually unit leaders and deans.
The survey also considered levels of funding, operations, and accomplishments of the 12 state IPM programs. About half of the state IPM coordinators had access to at least part of the S-L 3(d) funds, and all
of them obtained significant support from other sources. Faculty and staff support for
IPM was obtained by three main avenues: 1.
Personal interaction, 2. In-house competi-tive grants, and 3. Cooperation in obtaining extramural funding. The state IPM coordina-tor had to convince potential cooperacoordina-tors
that it would benefit their programs to form
partnerships with the state IPM program. All of the coordinators had some form of advi-sory committee that met at least annually and helped them garner resources. Satisfac-tion with the posiSatisfac-tion of State IPM Coordi-nator appears to have been related to the proportion of time committed; those with
greater commitments being more satisfied
with their progress and accomplishments. Time allocated to IPM varied widely from 100% to almost none, and only the busiest coordinators received increased technical and secretarial support. None of the coor-dinators were given extra compensation
specifically for their efforts to advance IPM.
Regardless, all of them recommended that
every state would benefit greatly by having
a full-time state IPM coordinator. Benefits of State IPM Programs
IPM is still in its infancy, despite the achievements of the past 30 yr (Kogan
1998). To fulfill the promise of IPM in the
United States, every state will require a well-organized, highly coordinated statewide IPM program with a full-time coordinator who manages the federal S-L 3(d) funds and is responsible for performing most of the management and delivery functions. Guidance, approval of the annual budget, and rigorous oversight of IPM activities can be provided by the land grant university administration and the USDA, CSREES IPM program. Part-time state IPM coordinators who manage the S-L 3(d) funds can facilitate important activities, but they will not have the time to manage and deliver a full-scale program. Part-time state IPM coordinators who do not have access to the S-L 3(d) funds will only be able to facilitate important but limited activities. All of the current state IPM coordinators are committed to establishing the best possible IPM program in their state or commonwealth; most would like it to be comprehensive and a source of pride for their land grant university. States without an adequate IPM program can make the transition by establishing the position of IPM coordinator, assigning all of the S-L 3(d) funds to the program, and assuring that IPM grants are made available. It also is essential to maintain a high level of ad-ministrative support and develop ways to
Rice 1
Hard red winter wheat 3
Wheat, general/other 5
Grain crops, general/other 4
Pasture and Forage Crops,
general/other 3
Cool season perennial grasses 1
Perennial grasses, other 1
Alfalfa 7
Forage legumes, general/other 2 Fiber Crops
Upland cotton 6
Long fiber cotton 1
Cotton, other 5
Oilseed and Oil Crops
Soybean 14
Peanut 3
Lesquerella 1
Sugar Crops
Sugar beet 3
Ornamentals and Turf
Ornamental trees and shrubs 7 Herbaceous perennials and decorative
greens 1
Potted plants 1
Bedding/garden plants 1
Turf 6
Ornamentals and turf, general/other 5 Miscellaneous and New Crops
Tea 1
Herbs and spices 1
Guayule 1
Miscellaneous and new crops, general/
other 1
Weeds 6
Plants
Cross-commodity research—multiple
crops 2
Animals, including Invertebrates, and Their Products
Bees, Honey, and Other Pollinators
Honey bees 2
Invertebrates
Insects 5
Spiders, mites, ticks, and other arthropods 4 Invertebrates, general/other 1 Cattle
Beef cattle, live animal 1
Dairy cattle, live animal 1
Swine
Swine, live animal 1
Microorganisms
Microorganisms, general/other 1 Food and Manufactured Resources Structures, Facilities, and Equipment
Houses (human residences) 1
Structures, facilities, and equipment,
general/other 1
Human Resources, Organizations, nd Institutions
People and Communities
Individuals 2
Communities, areas, and regions 8 People and communities, general/other 11 Other Technologies
General technology 1
measure and communicate the benefits (Hoffman and Grabowski 2004). Adminis -trators have become more involved with state IPM programs because plans of work and annual reports to USDA, CSREES must have required approval before S-L 3(d) funds can be released. This investment in state IPM programs can vastly increase cooperation among scientists, extension agents, pest consultants, progressive farm-ers, farm workfarm-ers, and consumers (Ehler and Bottrell 2000).
State IPM programs comprise an
ex-tremely cost-effective network that delivers
essential pest management information and technical support to clientele involved with agriculture, communities, and natural areas. These unique programs are structured to
fit the needs of their clientele, emphasizing
agriculture but including the other areas of pest management. All of the states receive S-L 3(d) IPM funding administered by the USDA, CSREES through the extension Direc-tors and state IPM coordinaDirec-tors of the land grant university system. The $9,791,000 per year in S-L 3(d) IPM funds are leveraged to
yield several times that amount to finance
a wide variety of high priority pest
man-agement projects. In FY 2008, for example,
$4,733,500 was obtained just from state appropriations.
Typically, state IPM coordinators are highly educated and experienced; they have remained in the position for 5 or more
yr with small, less permanent staffs. The
number of personnel for the national IPM network is about 176, but there are many more full partners, including extension faculty members, students, and unpaid
volunteers. Salaries for paid staff are de -rived primarily from S-L 3(d) funds, and state and federal contracts and grants. State
IPM coordinators help to organize, finance, conduct, and communicate the benefits of
projects within their states and regions; they also serve as contact points for public and private institutions. Most coordina-tors provide competitive grants, maintain active communication mechanisms, and participate in education and training
activities. They offer consultation locally,
nationally, and internationally on a range of IPM-related topics. Most of the work is in entomology, plant pathology, weed science,
horticulture, and agronomy, but significant
interactions involve other agricultural sci-ences. Program guidance and evaluation come from being engaged with university administrators and clientele.
There would be many more robust state IPM programs if their basic organization,
functions, and benefits were understood and
more universally accepted. This description
and associated survey data are offered to
provide this understanding and encour-age the development of stronger state IPM programs. This strengthening can be accom-plished by instituting the general structure and primary functions of well-developed programs, and by sharing IPM responsi-bilities with other members of the exten-sion community. Incrementally increasing
financial and technical support for state IPM
programs, as needed, will pay dividends in
financing and conducting more and higher
quality research and extension projects. Thus, a comprehensive and at least stable
state IPM program would benefit every land
grant university, as agriculture, communities
and natural areas are increasingly difficult
to protect from pests and diseases without unacceptable risks to human health and the environment.
Acknowledgments
We thank the Southern Region state IPM coordinators for their encouragement and ideas that were incorporated into this paper. Thomas Fuchs, Clarence Collison, and Clayton Hollier tested the survey; and Joyce Merritt assisted in its administra-tion. Michael Gray provided publications containing the results of previous surveys. Especially helpful reviews of the manuscript were provided by Richard Melnicoe, Michael
Gray, and Thomas Fuchs. 7
References Cited
Bajwa, W. I., and M. Kogan. 2002. Compen-dium of IPM definitions (CID). 1990–1998, Definition No. 5 from Proceedings of the National Integrated Pest Management Fo-rum. 1992. American Farmland Trust. Inte-grated Plant Protection Center (IPPC) Oregon State University, Corvallis. Publication 998. (http://ipmnet.org/IPMdefinitions/defin-eIII.html#90%27s).
Ehler, L. E., and D. G. Bottrell. 2000. The illu-sion of integrated pest management issues in science and technology. Issues in Science and Technology Spring 2000 (http:www.nap. edu/issues/16.3/ehler.htm).
Gray, M. E. 1995. Status of CES–IPM programs: results of a national IPM coordinators survey. Am. Entomol. 41:136–138.
Gray, M. E. 2001. The role of extension in pro-moting IPM programs. Am. Entomol. 47: 134–137.
GAO (U.S. General Accounting Office). 2001.
Agricultural pesticides: management im-provements needed to further promote integrated pest management. Report
GAO-01-815. U.S. Government Printing Office, Washington D.C.
Hoffman, W. and B. Grabowski. 2004. Smith Lever 3(d) extension evaluation and outcome reporting—a scorecard to assist federal pro-gram leaders. J. Extens.. 42 (6) (http://www. joe.org/joe/2004december/a1.shtml). Herbert, D. A. 2001. A survey of state
inte-grated pest management coordinators: mission, appointment, job and reporting expectations, funding, operations and ac-complishments. ESCOP/ACOP Leadership Development Program, Phase 2 Project, 2000–2001. 6. (unpublished, available from D.A. Herbert).
Jacobsen, B. J. 1997. Role of plant pathology in integrated pest management. Ann. Rev. Phytopathology. 35: 373–391.
Kogan, M. 1998. Integrated pest management: historical perspectives and contemporary developments. Annu. Rev. Entomol. 43: 243–270.
National IPM Symposium. 2003. National roadmap for integrated pest management. proceedings, integrated pest management for our environment- for our future, pp. 8–10. In 4th National Integrated Pest
Man-agement Symposium. University of Illinois, Urbana.
Ratcliffe, S. T., and M. E. Gray.2004. Will the USDA IPM Centers and the national IPM roadmap increase IPM accountability?—Re-sponses to the 2001 General Accounting Office Report. Am. Entomol. 50: 6–9. USDA, CSREES (U.S. Department of
Agri-culture, Cooperative State Research, Education, and Extension Service). 2005. Manual of Classification for Agricultural and Forestry Research, Education, and Exten-sion. (http://cris.csrees.usda.gov/manual. html).
USDA, CSREES. 2008. FY 2008 Distribution of funds to eligible institutions for extension activities authorized under the Smith-Lever Act and the D.C. Postsecondary Education Re-organization Act, p.3. (http://www. csrees.usda.gov/business/awards/for-mula/08_smith_lever.pdf).
Norm Leppla serves as Professor of Entomology and statewide IPM Program Director, University of Florida, Institute of Food and Agricultural Sci-ences, Gainesville, Florida. His research, exten-sion, and teaching emphasize IPM, biological control and insect rearing ([email protected], http://ipm.ifas.ufl.edu). Ames Herbert serves as Extension Entomologist and State IPM Coor-dinator, Virginia Polytechnic Institute and State University, Tidewater Agricultural Research and Extension Center, Suffolk, Virginia. His work primarily involves management of insect pests of peanut, cotton, soybean, and small grains ([email protected], http://web.ento.vt.edu/ ento/personalPage.jsp? uuid=821851). Denise Thomas received her Doctor of Plant Medicine degree from the University of Florida in 2008 and currently is a Natural Resource Specialist, Naval Facilities Engineering Command (NAVFAC), Nor-folk, Virginia. Her responsibilities include IPM development and education for military facilities ([email protected]).