This PDF document was made available from www.rand.org as a public service of the RAND Corporation.
6
Jump down to document
Purchase this document Browse Books & Publications Make a charitable contribution
Visit RAND at www.rand.org
Explore RAND Arroyo Center
View document details
This document and trademark(s) contained herein are protected by law as indicated in a notice appearing later in this work. This electronic representation of RAND intellectual property is provided for non-commercial use only. Permission is required from RAND to reproduce, or reuse in another form, any of our research documents.
Limited Electronic Distribution Rights
For More Information
Support RAND
The RAND Corporation is a nonprofit research organization providing objective analysis and
effective solutions that address the challenges facing the public and private sectors around the world.
CHILD POLICY CIVIL JUSTICE EDUCATION ENERGY AND ENVIRONMENT HEALTH AND HEALTH CARE INTERNATIONAL AFFAIRS NATIONAL SECURITY POPULATION AND AGING PUBLIC SAFETY SCIENCE AND TECHNOLOGY SUBSTANCE ABUSE TERRORISM AND HOMELAND SECURITY TRANSPORTATION AND INFRASTRUCTURE
This product is part of the RAND Corporation monograph series. RAND monographs present major research findings that address the challenges facing the public and private sectors. All RAND monographs undergo rigorous peer review to ensure high standards for research quality and objectivity.
John R. Folkeson, Marygail K. Brauner
Prepared for the United States Army
Approved for public release; distribution unlimited
Improving the Army’s
Management of
The RAND Corporation is a nonprofit research organization providing objective analysis and effective solutions that address the challenges facing the public and private sectors around the world. RAND’s publications do not necessarily reflect the opinions of its research clients and sponsors.
R® is a registered trademark.
© Copyright 2005 RAND Corporation
All rights reserved. No part of this book may be reproduced in any form by any electronic or mechanical means (including photocopying, recording, or information storage and retrieval) without permission in writing from RAND.
Published 2005 by the RAND Corporation
1776 Main Street, P.O. Box 2138, Santa Monica, CA 90407-2138 1200 South Hayes Street, Arlington, VA 22202-5050 201 North Craig Street, Suite 202, Pittsburgh, PA 15213-1516
RAND URL: http://www.rand.org/
To order RAND documents or to obtain additional information, contact Distribution Services: Telephone: (310) 451-7002;
Fax: (310) 451-6915; Email: [email protected] ISBN: 0-8330-3743-9
The research described in this report was sponsored by the United States Army under Contract No. DASW01-01-C-0003.
iii
Preface
The Army’s Velocity Management (VM) initiative was implemented in 1995 to im-prove the responsiveness, reliability, and efficiency of the Army’s logistics system.1 By
applying a simple, yet powerful, process-improvement methodology, the Army dra-matically streamlined its field-level supply process and its overall distribution process, cutting median order-fulfillment times for repair parts by nearly two-thirds world-wide and by over 75 percent at several major installations.
This report addresses initial efforts to expand the VM initiative by applying an integrative approach to improving the Army’s national-level inventory management and depot-level component-repair processes. The objective of the Army’s reparable-management process is to repair sufficient assets to replenish serviceable inventories to meet the needs of requirements determined to support equipment readiness. This report addresses both reparable-inventory planning and the national component-repair activities as an integrated process.
This study should be of interest to those involved with maintenance, supply, re-source management, and information systems. The reparable-management process activities discussed have significant interactions across traditional functional man-agement areas (i.e., wholesale-item manman-agement, depot maintenance, and financial management). The research was conducted over an extended period and relies upon snapshots of system performance data to describe the process.
This project was jointly sponsored by the Deputy Chief of Staff for Logistics (G4), Headquarters Department of the Army, and the Commanding General (CG) of Army Materiel Command (AMC). The research was conducted in the Military Logistics Program of the RAND Arroyo Center, a federally funded research and development center sponsored by the United States Army.
____________
1 The Army changed the name of this initiative to Army Distribution Management (ADM) in January 2003.
v
Contents
Preface...iii Figures...vii Tables...ix Summary...xi Acknowledgments...xix Acronyms...xxi CHAPTER ONE Introduction...1Identifying the Causes of Army National-Level Backorders...2
Defining, Measuring, and Improving the Army’s Reparable-Management Process...3
Organization of This Report...5
CHAPTER TWO Understanding the Scope of the Backorder Problem...7
Defining the Order-Fulfillment Process...7
Metrics to Define the Scope of the BO Problem...8
Extent of the BO-Rate Problem...8
Effect of High BO Rates on Customer Wait Times...13
Summary...16
CHAPTER THREE Understanding the Reparable-Management Process...17
The Current Reparable-Management Process...18
Depot-Level Reparable Workload...21
Planning for Both Near-Term and Long-Term Needs...21
Execution of Repair Programs...24
vi Improving the Army’s Management of Reparable Spare Parts
CHAPTER FOUR
Improving Planning Activities...29
Key Issues in the Current Process for Planning and Execution of PRONs to Repair Reparable Items...29
Uncertainty in Customer Demands on Long-Term Planning Forecasts...29
Need for Improved Supply-Management Planning and Execution...34
Approaches for Improving Supply-Management Planning and Execution...36
Approaches for Dealing with Uncertain Demand...37
Frequent Updating of PRON Forecasts to Respond to Changing Demands...38
Improving Service Level by Increasing Safety Stock...39
Improving Replenishment Lead Times...40
Improving Communication About Customer Needs and Requirements...41
Moving from Planning to Execution...42
Linking Long-Term Planning to Near-Term Execution...42
Conclusion...44
CHAPTER FIVE Improving Repair Activities...45
Improving Repair-Activity Responsiveness to Deal with Uncertain Demand...45
Approaches for Improving Repair-Activity Responsiveness...46
Reducing Lead Time for Next-Repair Completion and Overall Repair Flow Time...47
Frequent Replanning to Keep Repairs Synchronized with Demand...49
Improving the Availability of Unserviceable Assets...51
Improving the Process for Managing Repair Parts...53
Financial Policies That Support More-Responsive Depot Repairs...63
Conclusion...68
CHAPTER SIX Recommendations for Pilot Implementation...71
The Need for a More-Responsive Reparable-Management Process...71
Recommendations for a Pilot Effort...72
Addressing Uncertainty...73
Properly Linking Long-Term Planning and Replanning for Responsive Execution...74
Improving Repair Responsiveness...76
Conclusion...78
vii
Figures
1.1. Key Components of the Define-Measure-Improve Methodology...4
2.1. The Order-Fulfillment Process...8
2.2. BOs Reported for Army Tactical-Level Requisitions to the National System...9
2.3. BO Rates for AMC-Managed Items, by Type of Repair or Consumable...11
2.4. BO Rates at the MSCs Within AMC...12
2.5. Process Flow Diagram for Army Field-Level Customer Requisitions...14
2.6. CWT Statistics for a Mechanized Infantry Division Installation...15
3.1. Key Activities of the Current Reparable-Management Process...18
3.2. Reparable-Management Process Activities to Replenish Serviceable Inventories...20
3.3. Supply-Management and Repair Activities of the Reparable-Management Process...21
3.4. Tools Used by Item Managers to Understand Demand Patterns (Planning Sequence for Repair-Process Program Development by TACOM IM)...22
3.5. Depot-Level Maintenance and Repair Activities...27
4.1. Variability in Demand for the FY2000 Reparable M88A1...30
4.2. The Repair-Planning Processes for Different PRONs...32
4.3. FY2000 M88A1 PRON vs. Actual Demands...33
4.4. The FY2000 M88A1 Engine PRON Revised to Meet Customer Demands...36
4.5. Current Reparable-Management Activities...43
4.6. A More-Responsive Reparable-Management Process...44
5.1. Repair Production at ANAD Under the FY2000 PRON and the Revised PRON...46
ix
Tables
2.1. Requisitioning Data for FY2002...10
xi
Summary
High Backorder Rates for Reparable Items
Since its inception in 1995, the Army’s Velocity Management (VM) initiative, now known as Army Distribution Management (ADM), has been used to improve the responsiveness, reliability, and efficiency of the Army’s logistics system. However, as VM efforts expanded from order fulfillment at the tactical-unit level to national-inventory management, a troubling pattern emerged: a multiyear pattern of high and variable backorder (BO) rates for reparable items managed by the Army Materiel Command (AMC) and all the major subordinate commands (MSCs) within AMC.
A reparable is an item that can be cost-effectively repaired. When a reparable such as a diesel engine or turbine fuel control malfunctions, it can be replaced by a repaired or rebuilt component; it usually does not need to be replaced by a new item.
From the perspective of the ultimate customer—an Army mechanic trying to bring a malfunctioning piece of equipment back to mission-capable status—a BO can mean a lengthy delay and potentially a shortfall in mission support. The pattern of high BO rates suggests that improvements are needed in the process for managing and repairing reparable items. Improved effectiveness and efficiency of AMC’s com-ponent-repair capabilities and capacity can also contribute directly to other depot programs (e.g., components are also used to repair higher reparable assemblies and even for end-item overhauls), in addition to returning serviceable assets to the shelf, where they will be available for issue to those Army customers directly responsible for repairing mission equipment.
To illustrate the process-improvement approach described in this report, we use a case study of the M88A1 armored recovery vehicle engine. This diesel engine, which has had persistent BO problems, is typical of a large group of unsophisticated, older components needed to keep aging weapon systems in mission-ready condition.
xii Improving the Army’s Management of Reparable Spare Parts
Planning and Execution of the Reparable-Management Process
When an end-item fault or malfunction is discovered, during either equipment op-eration or routine maintenance, if a serviceable reparable is needed to complete the end-item repair, a mechanic requests the part or component from the supply system. The reparable-management process begins with the identification of the malfunc-tioning component and ends when a serviceable asset is made available through either repair or vendor replenishment to replace the item issued to the mechanic.
Whether or not there are serviceable reparables in stock at the national level de-pends on the effectiveness and responsiveness of the AMC process for planning and executing reparable workload, both repair programs and new buys. The planning ac-tivity analyzes inventory levels and produces a formal decision package for a reparable repair program or a vendor procurement, both known as a PRON (procurement-request order number) that is submitted for approval. Over the long term, the plan-ning process also provides input to the Army working-capital fund (AWCF) budget process and the program-objective memorandum (POM) budget planning process, which has a rolling six-year planning horizon and ultimately feeds into the congres-sional appropriations process.
Once a repair PRON receives management approval, it is typically scheduled to begin execution at the start of a new fiscal year 18 months after the start of the plan-ning cycle. Once a repair is completed, the item manager (IM) may immediately ship the item to a customer to satisfy a due out, move it to a centralized distribution depot for future issue, or leave it in storage at the distribution center collocated with the repair facility.
The PRON is usually described as a yearly repair requirement. Unserviceable items are often inducted in monthly batches, and output is also usually processed in batches. However, the formal PRON process also drives the overall planning process for long-term capacity adjustments (e.g., workforce, equipment, facilities). Quarterly replanning meetings provide a venue for adjusting production schedules.
Three Critical Issues in the Reparable-Management Process
Our examination of the reparable-management process identified three key issues that need to be addressed:
• The impact of uncertainty and variability in customer demands on long-term planning forecasts.
• The need for increased emphasis on near-term replanning for execution. • The inability of repair responsiveness to meet changing requirements.
Summary xiii
The Impact of Uncertainty and Variability in Customer Demands on Long-Term Planning Forecasts
The current process for planning reparable workload requires and uses forecasts made over long horizons. It is nearly impossible to accurately make such forecasts 18 to 30 months into the future because of changes in mission scenarios and other sources of demand uncertainty and demand variability. In other words, forecast error is to be expected.
We use the M88A1 diesel engine to illustrate a case in which increasing demand over the extended planning horizon led to underproduction. In this example, forecast error was caused by demand uncertainty, rather than variability. The current plan-ning process can also create the opposite situation by overproducing items with de-clining demand. In either case, the reparable-management process must be capable of adapting to changing demand. Fundamentally, successful planning requires frequent replanning to incorporate emerging information so that the execution will meet valid needs.
Increased Emphasis on Near-Term Replanning for Execution
The reparable-management process tends to focus primarily on long-term budget planning, and thus it is less responsive to changing customer needs that emerge dur-ing near-term execution. Although the MSCs and their repair depots hold quarterly meetings to revise schedules and address problem areas, these meetings typically focus on only the most critical issues.
Improved Repair Responsiveness to Meet Changing Requirements
To the extent that an IM can change a production plan or program to meet changing demands, the question arises as to whether the depot can adjust its repair program to meet those changing demands. We found, for example, that the procedures used for inventory management and control at Anniston Army Depot (ANAD) did not pro-vide sufficient visibility to identify repair-part problems before they became critical in the production process.2
Alternatives for Improving the Reparable-Planning Process
Strategies for Dealing with Uncertain Demand
A review of the literature on commercial business practices identified the following four promising approaches for meeting customer needs under conditions of uncer-tain demand:
____________
2 The case study provided an in-depth view of ANAD, but similar systems and policies would have similar results
xiv Improving the Army’s Management of Reparable Spare Parts
• Frequently update forecasts. • Increase safety stock.
• Improve replenishment lead times.
• Improve communication about customer needs and requirements.
Frequently update forecasts. The literature suggests that the fundamental problem in forecasting reparable demand is not the type of model used but the length of the planning horizon. Some decisions must be made with the best informa-tion available at the time, whereas other decisions can be revisited as new informainforma-tion emerges. The forecasting model used in the reparable-management process is capable of making adjustments. In planning a repair program, an IM uses several tools, in-cluding the Requirements Determination and Execution System (RD&ES), which analyzes data on demands and other transactions in order to make recommendations for repair and/or buy quantities. RD&ES generates a monthly repair plan that starts with an updated forecast (using an exponential moving average model) supplemented by known factors that have changed or are expected to change, such as fielded equipment density, operating tempo, etc. This approach can rapidly adjust to changing conditions, helping accommodate highly variable demand. Forecasting for PRON execution and production control could be improved through frequent recal-culations to update predictions with current data. The near-term predictions we re-viewed during the case study demonstrated improved output.
Increase safety stock. Safety stock refers to inventory that is held to buffer a process against uncertainty. The RD&ES module has the capability to determine safety-stock needs within the planning calculation. Safety stock should not be con-sidered merely an added cost to the logistics system.
Improve replenishment lead times. The time to process and deliver a customer order for a component or part is known as the lead time. If a request for an item can be filled immediately from tactical- or national-level inventory, the lead time can be very short, but when the request cannot be satisfied until the next repair is com-pleted, the lead time can be quite long. In the case of the M88A1 engine, the lead time necessary to fill a customer request might be many days or weeks if the reparable is not in stock, mostly due to lengthy queuing or waiting times within the various depot repair activities.
Approaches to reducing lead time must examine the chain of events necessary to meet a need to determine where it is more efficient and effective to insert buffers or to reduce constraints so that the desired response time can be achieved at lower total cost. It is possible, for example, that some work-in-process (WIP) engines could be used to shorten the achievable repair time. All the activities in the chain of lead-time events should be addressed to improve responsiveness.
Improve communication about customer needs and requirements. The pattern of changing customer demands for reparables is not likely to change. In light of such
Summary xv
realities, it is important to adjust expectations and to increase communication about how the process must change to better meet customer needs and requirements. Cus-tomers and providers across the system supported by the Army’s reparable-management process must understand both the nature of the issues involved and ac-tions that could contribute to an improved outcome. Unless the process changes, the outcome is not likely to change.
Frequent Replanning and Near-Term Repair Execution
When the results of the planning process are shown to be inadequate to meet emerging customer demand, the plans should be adjusted promptly under appropri-ate management controls. An initial goal might be to transition as quickly as possible to monthly repair-schedule changes (i.e., replanning) using the available monthly RD&ES outputs. In the future, the management decision process might be informed weekly or even daily about customer demand, and production-schedule changes could be implemented when warranted.
Improving Repair Responsiveness
Several alternatives for improving repair responsiveness emerged from interactions with managers and technicians within the system and from lessons learned from commercial practice.
Reduce lead time for the next repair and overall repair flow time. Reducing flow time in the repair activities of the reparable-management process will involve looking very closely at all the process activities required to return a broken asset to serviceable status and to deliver it to the Defense Logistics Agency (DLA) distribu-tion center packaged and ready for issue. The intent of such analysis would be to es-tablish a mechanism that could respond to customer needs by increasing production when demand increases, thus reducing the potential for BOs, and decreasing produc-tion when demand is low, thus reducing unnecessary inventory investment.
Replan frequently to synchronize repairs with demand. Updated information could be used monthly by the current RD&ES module to revise production sched-ules that cover the currently approved PRONs. In addition, the proposed lead-time reduction efforts could provide the kinds of operating practices necessary to enable depot production to respond to forecast changes. A mechanism or signal should be established that communicates to depot managers and workers the need to perform a given task and the quantity of items to be produced. This replanning works two ways: It increases production when demand increases, thus reducing the potential for BOs, and it decreases production when demands are not as great as forecasted, thus reducing unnecessary inventory investment.
Assure the availability of unserviceable assets. Repair actions cannot begin un-til unserviceable assets that have been removed from end-items are available for in-duction. Currently, unserviceables (unless they are specially identified) are treated as
xvi Improving the Army’s Management of Reparable Spare Parts
the lowest-priority items within both the supply and the transportation activities. The supply and transportation communities need to review the priorities assigned to dealing with unserviceable assets to allow them to be used more effectively in meeting the needs of individual customers and the Army as a whole.
Improve the process for managing depot repair parts. Under the current pro-cess, technicians must leave their work locations and go to the shop supply room to get parts that are needed, wasting time and manpower. A more effective approach would be to provide repair parts, both new and reclaimed (i.e., recycled), at the workstations. For example, routing reclaimed parts to the Automated Storage and Retrieval System (ASRS) facility would improve visibility of assets and would allow parts to be brought forward to mechanics in an orderly manner.
The inventory policy for repair parts at AMC maintenance depots would also benefit from greater flexibility in setting inventory levels for different items. Current policy sets inventory levels at 60 days of supply (DOS) for all items other than bench stock and special-project assets. A more flexible policy would allow for addressing the different characteristics of individual repair parts, thus reducing the risk of stock-outs. Such a policy might distinguish among at least three kinds of items:
• Items used for nearly all repairs. As long as there is recurring monthly produc-tion or availability of these items, replenishment with the current 60-DOS pol-icy should ensure that assets are on hand and that there is a continuing vendor relationship to meet future needs. Over time, the 60-DOS level might actually be reduced. For these types of items, replenishment time and variability, as well as cost, should determine the final inventory depth.
• Less frequently used items. The programmed logic for inventory decisions in DLA’s automated inventory-replenishment system is based on the frequency with which items are ordered. Low-demand items replenished by large orders are typically replenished only infrequently and thus may not be stocked at DLA if the repair depot orders them too infrequently to qualify them for stockage. Infrequent orders also complicate vendor relationships. Smaller, more-frequent replacement orders have the benefit of both limiting inventory investment and communicating to IMs and vendors the continuing need for such items to sup-port repair programs. The relevant IMs must understand that these less fre-quently used items are still necessary.
• Infrequently used items with long lead times for replenishment. These items require and justify intensive management. They typically represent a small per-centage of the total number of items but a majority of the total inventory in-vestment.
Adopt policies that make repair programs responsive to customer demands.
Summary xvii
AWCF, which does not require that revolving-fund activities spend all their funds by the end of the fiscal year to avoid losing the money. Thus, a depot can carry over workload beyond its intended fiscal year to provide approved cash flow for labor and materiel while awaiting the approval of a new PRON. Workload carryover and the pattern of delayed production, along with changes in demand, contribute to the due-out volume, or the BO rate. The Army needs a policy that is more responsive to cus-tomer demands.
Adopt financial policies that encourage appropriate use of repair capacity.
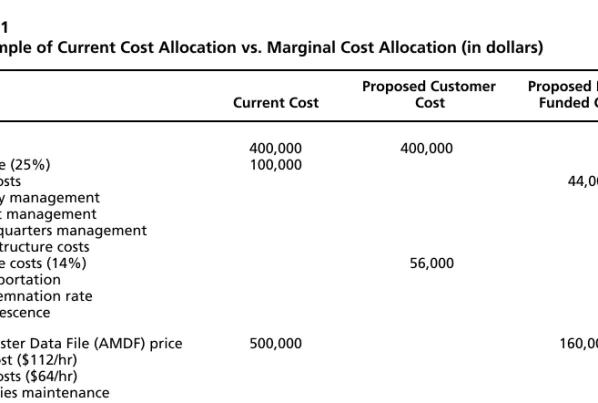
Prices of Army-managed items include a supply-management surcharge to recover the costs of operating the national supply system. This surcharge, which includes both fixed costs (costs that do not vary by supply-management activity) and variable costs (costs generated by specific items), can result in comparatively high prices and can lead to lost sales—even for items with low acquisition costs. For example, the surcharge acts as a “tax” on purchases from the supply system, whereas locally pur-chased or repaired equivalents avoid such a charge. One approach for addressing this problem would be to fund fixed costs (e.g., costs for Department of Defense (DoD) agencies, depreciation, and adjustments for prior-year losses or gains) through direct funding and to allocate variable costs more specifically to the items generating them.
A Pilot Effort to Implement Improvements
The implementation of improvement initiatives can be made more tractable by starting with a pilot effort that allows the development and testing of alternative ap-proaches. The results obtained in a pilot implementation could be measured, rules could be adjusted, and confidence would be developed in the selected improvement approaches.
We recommend that senior management at an MSC appoint a small pilot im-plementation team. The team’s effort should focus initially upon a few reparable NIINs (national item identification numbers) related to a single weapon system or end-item that is repaired at the same facility. This approach could create a vertical slice of the overall reparable-management process and thus would facilitate actions across activities to achieve recognized results.
It is possible to dramatically improve the availability of reparables to customers. This report discusses approaches that can efficiently improve each activity in the process. Many of these approaches are drawn from successful commercial practice, and others derive from successes within military practice that deserve expansion.
xix
Acknowledgments
The authors wish to thank the many people who have helped to make this research possible. We first thank General John Coburn (USA, Ret) for his support, initially as Deputy Chief of Staff for Logistics (G4), HQDA, and then as Commanding General (CG) of Army Materiel Command (AMC). We are also indebted to LTG Charles Mahan (USA, Ret) for his support in his roles as Deputy CG of AMC and then as the Army G4. Thanks also go to Eric Orsini, the Special Assistant to the Army G4 (and then Deputy Assistant Secretary of the Army for Logistics), and his associates, COL Glenn Harrold and COL Albert Love. At AMC Headquarters, we thank General Paul Kern, Commanding General; MG Mitchell Stevenson, Deputy Chief of Staff, G3; COL Hugh Hudson; and Thomas Hedstrom. At AMC’s Tank-Automotive and Armaments Command (TACOM) we thank MG N. Ross Thompson, Commanding General, and Thomas Boyle, David Carter, Chris Thomasson, and John Jacobs. At the Anniston Army Depot (ANAD), we thank Borden Norten, David Sok, and Shelby Cupp. Thanks also to the many other dedi-cated Army, AMC, and Combined Arms Support Command (CASCOM) staff who provided assistance.
The research reported here follows directly from earlier RAND Velocity Man-agement (VM) research for the Army Deputy Chief of Staff, G4. We are indebted to LTG Claude Christianson, Army G4, and Thomas Edwards, Deputy to the Com-mander, CASCOM, and Executive Agent for Army Distribution Management, for their continued interest in research aimed at improving support to Army warfighters and at implementing change to improve Army logistics processes.
RAND research explicitly addressing the impacts of the uncertainty of logistics requirements and the implicit requirement for process changes to create more re-sponsive capabilities, including rere-sponsive repair, improved distribution, and the ap-plication of “lean” management concepts, can be traced at least to the late 1970s. RAND colleagues including Irv K. Cohen, Gordon B. Crawford, and James S. Hodges created a body of work that bibliographic references only begin to document. We are grateful for the efforts of two formal reviewers who contributed directly to the clarity and quality of this report. Vincent Mabert of Indiana University and
xx Improving the Army’s Management of Reparable Spare Parts
Lionel Galway of RAND made substantive, direct contributions that improved the quality of our research.
At RAND, we wish to thank Eric Peltz, John Dumond, Rick Eden, Marc Robbins, Ken Girardini, Chris Hanks, and Patricia Boren for their contributions to this document and for providing feedback as the project progressed. Kristin Leuschner provided fundamental guidance and excellent prose that vastly improved the report. Finally, thanks go to Sarita M. Anderson for formatting the draft of this document and managing its preparation.
xxi
Acronyms
ADM Army Distribution Management AMC Army Materiel Command AMCOM Aviation and Missile Command AMDF Army Master Data File
ANAD Anniston Army Depot
APICS American Production and Inventory Control Society AR Army regulation
ASL authorized stockage list
ASRS Automated Storage and Retrieval System AWCF Army working-capital fund
BO backorder
CASCOM United States Army Combined Arms Support Command CCP containerization and consolidation point
CCSS Commodity Command Standard System CECOM Communications and Electronics Command CFS container freight station
CG Commanding General Class IX repair parts, class of supplies CLM Council of Logistics Management CONUS Continental United States
CTASC Corps Theater Automatic Data Processing Service Center CWT customer wait time
DAAS Defense Automated Addressing System
DAASC Defense Automated Addressing System Center DDJC Defense Distribution Depot, San Joaquin, California
xxii Improving the Army’s Management of Reparable Spare Parts
DDSP Defense Distribution Depot, Susquehanna, Pennsylvania DLA Defense Logistics Agency
DLR depot-level reparable DM Distribution Management DMI define, measure, improve
DMWR depot-maintenance work requirement DoD Department of Defense
DOS days of supply
DRMS Defense Reutilization and Marketing Service DVD direct vendor delivery
DWCF Defense working-capital fund FDP forward distribution point FLR field-level reparable
FMR Financial Management Regulation FMS foreign military sales
G4 Deputy Chief of Staff for Logistics GAO General Accounting Office
GSA General Services Administration HQ headquarters
ICP inventory control point
ILAP Integrated Logistics Analysis Program IM item manager
ISA installation supply account IT information technology LAC latest acquisition cost
LIDB Logistics Information Data Base LIF Logistics Information File
LMP Logistics Modernization Program LORA level-of-repair analysis
M88A1 armored recovery vehicle; type, model designation MRO materiel release order
MSC major subordinate command (of AMC) MTBF mean time between failure
Acronyms xxiii
NICP national inventory-control point NIIN national item identification number NMWR national maintenance work requirement NRTS not repairable this station
NSN national stock number
OCONUS overseas, outside the Continental United States OMA Operations and Maintenance, Army
OMB Office of Management and Budget OSD Office of the Secretary of Defense PEP parts-explosion process
POD point of debarcation POE point of embarcation
POM program-objective memorandum
PPBS Planning, Programming, and Budgeting System PRON procurement-request order number
RD&ES Requirements Determination and Execution System RPAS Repair and Procurement Acquisition System
SAMS Standard Army Maintenance System SARSS Standard Army Retail Supply System SDP strategic distribution platform SLE service-life extension
SOR source of repair
SSA supply support activity SSF Single Stock Fund
TACOM Tank–Automotive and Armaments Command ULLS Unit-Level Logistics System
USA United States Army USC United States Code VM Velocity Management WIP work in process
1
CHAPTER ONE
Introduction
Since its inception in 1995, the Army’s Velocity Management (VM) initiative1 has
sought to improve the responsiveness, reliability, and efficiency of the Army’s logis-tics system. By implementing a simple, yet powerful, process-improvement method-ology, the Army has dramatically streamlined its order-fulfillment process, i.e., the supply and the distribution activities that meet its customers’ needs. VM has enabled the Army to cut median order-fulfillment times for spare parts and materiel by nearly two-thirds across installations in the continental United states (CONUS) and by over 75 percent at several major installations.2
Initially, VM was applied only to the distribution of available inventory assets. However, efforts soon turned to the problem of improving the availability of those assets. As the VM stream of research and analysis expanded from order fulfillment at the tactical-unit level into efforts to improve national-inventory management, the analysis exposed a troubling pattern: Wholesale backorders (BOs) were higher than expected.3
Wholesale BOs had been masked by the slowness of the previous overall order-fulfillment process. Every segment of that process, BO and non-BO alike, took a long time. The improvements in responsiveness of the process exposed the glaring impact of BOs on total sustainment performance. VM’s overall responsiveness metric (i.e., customer wait time (CWT)) established an improved foundation for measuring basic logistics processes. As a process improves, the expected evolution is sequential exposure of the next area in need of improvement. Indeed, as the order-fulfillment process improved, the contribution or impact of the BO issues became more clearly ____________
1 In 2003, VM was renamed Army Distribution Management (ADM). In this report, we have retained the VM
terminology for contextual consistency
2 To learn more about the VM program, see Dumond, Brauner, Eden, et al., 2001; Dumond, Eden, and
Folkeson, 1995; and Wang, 2000.
3 A wholesale BO occurs when a requisition is passed to the national level for “wholesale” fulfillment and cannot
be immediately satisfied from on-hand inventory. Direct vendor deliveries (DVDs) can also experience BOs when materiel is not provided in accordance with contract parameters.
2 Improving the Army’s Management of Reparable Spare Parts
defined and exposed. The process-improvement approach described in this report attempts to understand the causes of the exposed issues.4
Identifying the Causes of Army National-Level Backorders
Inventory planning recognizes the presence of demand variability, and current Army supply policy calls for providing an 85 percent service level (i.e., on average, custom-ers should encounter no more than a 15 percent BO rate). Given variability in both demand and replenishment lead time, inventory levels—specifically safety levels and order-quantity combinations—are set to have parts in stock 85 percent of the time.5
When the BO trend exceeds 15 percent, either inventory investment did not occur as planned, planning is not being executed promptly, demand is being underforecast, or process performance (i.e., procurement lead time or repair lead time) is not in line with planning parameters.6
An item of supply is generally categorized as either consumable or reparable. A consumable is normally expended or used up beyond economic recovery during its intended period of use. A reparable is an item that can be cost-effectively repaired, such as a diesel engine or turbine fuel control. When a reparable malfunctions, it can usually be replaced by a repaired or rebuilt component rather than requiring re-placement by a new item.7 In fact, repaired or rebuilt parts are sometimes the only
source of stock for expensive weapon-system components. Usually, reparables are re-paired to serviceable condition for subsequent reissue to customers. (Throughout this report, the term reparable is used to refer to a class of items; individual reparables may be deemed either repairable or unrepairable.8) However, some unserviceable
reparables, after inspection, are deemed to be unrepairable at a particular repair loca-tion or may even be condemned as economically unrepairable or infeasible to repair.
When we examined Army field-level customer-satisfaction statistics, we discov-ered that the high BO rate was being driven by a BO rate for reparables higher than ____________
4 The issue of BOs was also raised by Congress, resulting in requests for the General Accounting Office (GAO)
to look into the matter. GAO has addressed this and other issues related to the Army and other Department of Defense (DoD) entities in an extensive list of publications. For example, see GAO, 1990a, 1993, 2001a.
5 This is an aggregate target. Different parts have different targets, based upon the most cost-effective allocation
of assets to achieve the overall goal.
6 Delays associated with vendor replenishments or wholesale inventories can involve a complex set of issues and
processes.
7 The term reparable correctly refers to both new items procured from a vendor and repaired items. Inventory of
a specific reparable may include both new and repaired items. However, some items become so worn or damaged that they can no longer be economically repaired and are thus condemned and disposed of.
8 Reparable items include depot-level reparables (DLR) and field-level reparables (FLR), categorized by the
Introduction 3
that for consumables. We found a multiyear trend of high BO rates for reparable items managed by Army Materiel Command (AMC),9 a pattern that also applied to
all the major subordinate commands (MSCs) within AMC. The problem was not simply one of insufficient repairs or procurements—according to the GAO, some items were repaired in insufficient numbers, while others were repaired in excess of computed stock levels.10
Defining, Measuring, and Improving the Army’s Reparable-Management Process
Distribution Management (DM), the Army’s initiative for improving the speed and accuracy of Army logistics processes, employs a systematic methodology for process improvement. As the original name Velocity Management implies, the initiative seeks to satisfy the support needs of customers by improving the agility and responsiveness of logistics processes. Under VM/DM, both information and materiel flow faster and more accurately, and at a lower total cost.
To implement DM, the Army has institutionalized a methodology consisting of three steps: define the process, measure the process, and improve the process (DMI). The key components of these steps are summarized in Figure 1.1.11
This study addresses the need for improvement of the Army’s reparable-management process within AMC.12 It embraces the spirit of the VM methodology
in that it attempts to define this process in detail. However, our ability to measure the process was limited by data availability; we therefore focus on improvement al-ternatives for a case study of one selected item.13
____________
9 The evidence of BOs will be discussed further in Chapter Two.
10 For many years, Congress has had a continuing interest in improving the management of reparable spares and
the inventory of resulting serviceables. The GAO was tasked by Congress on numerous occasions with auditing and/or analyzing various issues related to the management and operation of the military’s repair depots. Whether the specific management environment under review was appropriations or revolving funds, the thread of conti-nuity across the observations reported was the need to make each type of decision based on the most recent data available. See, for example, GAO, 1990b.
11 For more information on the development of VM, see Dumond, Brauner, Eden, et al., 2001.
12 Unfortunately, because of the inherent variability in demand for weapon-system spare parts, an “optimal”
solu-tion that yields zero BOs is not a realistic objective. Although the variability phenomenon has been studied for many years, no successful strategies have been found to control either the demand or the supply variability in practice. See, for example, Crawford, 1988. One of the objectives of the research described in the present report is to identify potential initiatives aimed at reducing supply variability through improvement of the reparable-management process.
13 This initial effort focused on the Tank–Automotive and Armaments Command (TACOM) and its primary
maintenance depot, Anniston Army Depot (ANAD). The data collection and field visits occurred during FY2000.
4 Improving the Army’s Management of Reparable Spare Parts
Figure 1.1
Key Components of the Define-Measure-Improve Methodology
RAND MG205-1.1
Iterate for continuous improvement • Determine customers, inputs,
outputs, value added • Use walk-through to achieve common understanding
Define the process
• Define metrics and identify data • Determine baseline performance • Diagnose performance drivers • Provide reports and feedback
Measure process performance
• Establish goals
• Develop improved process designs • Implement change
Improve the process
We have not attempted to address the overall improvement of depot mainte-nance per se. The depot component-repair workload is not the largest part of the de-pot maintenance workload, in terms of either man-hours or budget. However, com-ponent-repair capabilities and capacity are essential for executing the larger overhaul and recapitalization workloads and for direct support to warfighters. Thus, not only will improved effectiveness and efficiency in component repairs return serviceable assets to the shelf, where they will be available to issue to Army customers, it will also contribute directly to other depot programs. In addition, these improvements should improve overall supply system efficiency by reducing overproduction of serviceables and other unnecessary resource investments.
Our goal is to suggest an improvement path for the reparable-management process, based on the evidence uncovered during the case study and driven by rele-vant critical metrics. Our case study focuses on the M88A1 armored recovery vehicle engine.14 This engine, which has experienced persistent BO problems, is typical of a
large group of unsophisticated, older components that are needed to keep the long-lived current weapon systems in mission-ready condition. The alternatives examined in this study call for added resource investment (e.g., increased safety stock) to buffer the customer from the processes that are not responding rapidly enough. The as-sumptions behind a continuous-process-improvement strategy recognize that change ____________
14 This 10-cylinder, turbo-charged diesel engine (national stock number (NSN) 2815-00-124-5387) has 1,790
Introduction 5
will occur over time and that intermediate states throughout the transition to the de-sired state may require some “targeted” investment or infusions of capital. However, these investments will likely provide better service at the same or lower total cost to the Army.
This analysis was undertaken with the knowledge that a logistics-systems mod-ernization effort is under way to improve decision support in both the supply and maintenance management areas. Furthermore, AMC has undertaken an effort to im-prove depot maintenance through the application of “lean” manufacturing concepts at each of its depots.15 Our analysis specifically addresses improvement opportunities
that need not await technological modernization, nor do they conflict with it. Fur-thermore, the recommendations presented here are totally congruent with a “lean” view of both the planning and execution of the reparable-management process.
Organization of This Report
The remainder of the report is organized into five chapters. Chapter Two takes a closer look at the nature of the problems associated with a high BO rate. Chapter Three examines the current reparable-management process and identifies some key issues that need to be addressed within that process. Chapters Four and Five offer solution alternatives relevant to inventory planning and repair management, respec-tively. Chapter Six summarizes the recommendations for improving the reparable-management process.
____________
7
CHAPTER TWO
Understanding the Scope of the Backorder Problem
In this chapter, we employ a suite of metrics to examine the issues involved in repa-rable-inventory planning and repair activities. We first define the order-fulfillment process, which is delayed by BOs, and we then introduce metrics to measure the ef-fects of those BOs. The metrics measure not only the BO rate (the proportion of requisitions that became BOs), but also the impact of high BO rates on overall per-formance, i.e., responsiveness to customer requisitions.
Defining the Order-Fulfillment Process
Define, the first step of the VM process-improvement methodology, produces a clear picture of the process (common to all participants and stakeholders) through process mapping. Figure 2.1 illustrates the Army’s order-fulfillment process for spare parts and related materiel needed by equipment mechanics, the ultimate customer in this example. Within the figure, solid lines represent materiel flows, and dashed lines rep-resent information flows.
The customer (shown on the left) diagnoses an equipment fault and initiates a request for a part, which can be filled either by one of the installation’s tactical (re-tail) supply activities or by the national-level (wholesale) supply system. When the request for a part cannot be met locally, the national-level supply manager passes the requisition on to the appropriate source for fulfillment. In the case of a reparable, the requisition would go to a national distribution center, which would supply the part. If no reparable items are currently available to fill the request, a BO or due-out is generated, and BO status information is passed to the supply activity supporting the customer. Eventually, the customer’s request is satisfied by either a repaired service-able or a new asset.
8 Improving the Army’s Management of Reparable Spare Parts
Figure 2.1
The Order-Fulfillment Process
RAND MG205-2.1
National-level supply system Installation or tactical-level supply
National Regional Ultimate customer National backorder Equipment readiness
X
Procure or repair Unit parts clerk Tactical supply DLA distribution center Tactical supply Supplymanagement managementSupply
Shop parts clerk National issue Referral Shop fill Shop fill ASL issue Component repair Maintenance to maintenance Fault corrected Fault recorded
X
Metrics to Define the Scope of the BO Problem
Following the VM philosophy, we chose metrics that reflect the perspective of the ultimate customers and their supply activity or forward distribution point (FDP), formerly known as the supply support activity (SSA). These metrics—BO rate, cus-tomer wait time (CWT), and workaround rate—all relate to the responsiveness and effectiveness of the supply chain.1
Extent of the BO-Rate Problem
We began our research by measuring confirmed BO status recorded in the customers’ Standard Army Retail Supply System (SARSS) and archived in the Corps Theater ____________
1 The metrics used in such process-improvement efforts are not necessarily the same metrics reported elsewhere
within the Army logistics system. These “new” metrics tend to evolve as the improvement efforts that use them evolve and need measurement better aligned with customer needs and process diagnosis.
The BOs reported here represent a total composite statistic that includes those for requests by the ultimate Army customer and those for field-level supply-activity replenishment. The reported statistics do not include BOs for other requesters (e.g., depot-level maintenance requests).
Understanding the Scope of the Backorder Problem 9
Automatic Data Processing Service Center (CTASC) document history files.2 The
extent of the BO problem can be seen in Figure 2.2, which displays five years of BO rates for spare parts (supply Class IX items), sorted by national agencies that manage different sets of these items.3 During this period, the BO rate for AMC-managed
items was higher than that for items managed by the Defense Logistics Agency (DLA) and the General Services Administration (GSA).4
The BO rate, or percentage, was calculated by dividing the number of BO req-uisitions (i.e., reqreq-uisitions with “BB” status according to the item manager) by the total number of requisitions for the same period. Only requisitions for spare parts are
Figure 2.2
BOs Reported for Army Tactical-Level Requisitions to the National System
RAND MG205-2.2
Backorder rates
FY1998 FY1999 FY2000 FY2001 FY2002
.20 .15 .10 .5 .25 0
SOURCE: Army LIDB data, Class IX BO rates for closed requisitions, CONUS and OCONUS active units, no DVDs.
AMC DLA GSA
____________
2 Backorders are indicated by a supply-status code of “BB.”
3 The BO rate is calculated based on all spare-part requisitions by active Army retail customers (i.e., BO
requisi-tions/total requisitions). Rates are calculated based on requisitions, not NIINs (national item identification num-bers). The Army sorts all NIINs into ten separate categories. The spare parts used in our calculations are in the Class IX category.
4 The items ordered by Army customers have inventory-management processes performed by AMC, the Defense
Logistics Agency (DLA), or the General Services Administration (GSA). DLA tends to manage more-common items used by more than one service or agency, while AMC tends to manage specialized and weapon-system-unique items for the Army. Reparables tend to be managed by AMC. The DLA-managed items also tend to cost less than the AMC-managed items. Those GSA-managed items are generally paper and housekeeping-type items, but they also include a small number of consumable items in support of repairs.
10 Improving the Army’s Management of Reparable Spare Parts
included. This metric does not consider the duration of the due-out status or the time required to fill the customer’s request. It merely reflects the proportion of BO occurrences.
The BO rates in Figure 2.2 do not correspond to those computed internally by the individual agencies. Each agency has slightly different definitions of BO rates, based on the factors under its control.
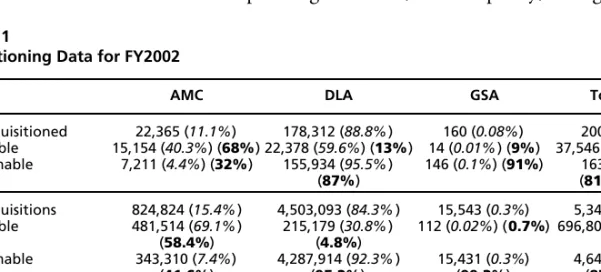
Table 2.1 provides some added perspective on the data summarized in Figure 2.2. The table shows the population of requisitions by tactical-level Army active-duty customers. These are requisitions for spare parts that were delivered to customers during FY2002. The data are sorted by the wholesale agency that manages a NIIN (national item identification number), and by whether that NIIN is a reparable or a consumable.5 The italicized percentage values are to be read horizontally (e.g., 84.3
percent of the total requisitions are for DLA-managed items), and the values in bold type are to be read vertically (e.g., 95.2 percent of the requisitions for DLA-managed items are for consumables).
A 15 percent BO rate is the expected result of current Army inventory policy, and it is the goal in the annual Army working -capital fund (AWCF) budget process; the supply managers (in AMC) and their models thus compute inventory levels using an 85 percent supply-availability goal (1.0 – 0.85 = 0.15). However, although the 85 percent availability factor is incorporated into numerous policies and algorithms, we have not found the source of this specific goal in law, written policy, or regulation
Table 2.1
Requisitioning Data for FY2002
FY2002 AMC DLA GSA Total
NIINs requisitioned 22,365 (11.1%) 178,312 (88.8%) 160 (0.08%) 200,837 Reparable 15,154 (40.3%) (68%) 22,378 (59.6%) (13%) 14 (0.01%) (9%) 37,546 (18.7%) Consumable 7,211 (4.4%) (32%) 155,934 (95.5%) (87%) 146 (0.1%) (91%) 163,291 (81.3%) Total requisitions 824,824 (15.4%) 4,503,093 (84.3%) 15,543 (0.3%) 5,343,460 Reparable 481,514 (69.1%) (58.4%) 215,179 (30.8%) (4.8%) 112 (0.02%) (0.7%) 696,805 (13%) Consumable 343,310 (7.4%) (41.6%) 4,287,914 (92.3%) (95.2%) 15,431 (0.3%) (99.3%) 4,646,655 (87%) BO requisitions 177,528 405,371 911 583,810 Reparable 115,632 35,816 3 151,451 Consumable 61,896 369,555 908 432,359 BO rate 21.5% 9.0% 5.9% 10.9% Reparable 24.0% 16.6% 2.7% 21.7% Consumable 18.0% 8.6% 5.9% 9.3%
SOURCE: LIDB, Class IX, CONUS and OCONUS (overseas, outside the CONUS) active units, no DVDs.
____________
5 In this case, a reparable could be either a field-level or depot-level item, depending on the applicable
Understanding the Scope of the Backorder Problem 11
within the Army or the Office of the Secretary of Defense (OSD). DLA is not using the same policy and has exceeded the 85 percent supply-availability goal significantly, both overall and for consumable items, to the benefit of Army customers in FY2002. Regardless, inventory-policy levels should be set on the basis of desired customer mis-sion-support capabilities, considering the conditions of logistics responsiveness, de-mand predictability, acceptable risk, and acceptable cost.6
As shown in Figure 2.3, BO rates have been problematic for all categories of AMC-managed items, including depot-level and field-level reparables, as well as con-sumables.7 A depot-level reparable (DLR) is designated for repair or disposal at the
depot level of maintenance (or is designated for repair below the depot level, but if repair cannot be accomplished at that level, shall have its unserviceable carcass
for-Figure 2.3
BO Rates for AMC-Managed Items, by Type of Repair or Consumable
RAND MG205-2.3 Backorder rates DLR FLR Consumable .30 .25 .20 .15 .10 .5 .35 0
SOURCE: Army CTASC and LIF/LIDB, all AMC Class IX wholesale sales, CONUS and OCONUS active units, no DVDs. FY1998 FY1999 FY2000 FY2001 FY2002 ____________
6 In recent years, the 85 percent supply-availability goal has been discussed in terms of the financial constraints
associated with reduced budget levels. However, this goal has been a consistent constraint value in the Pentagon for at least the last 40 years. At any rate, the BO rates for AMC-managed materiel (as measured from the tactical Army customer’s perspective over this five-year period) exceeded 15 percent each year.
7 Since this research began, the Army archive for such data has migrated from the Logistics Information File
12 Improving the Army’s Management of Reparable Spare Parts
warded to the depot for repair or condemnation, or reported to the IM for disposi-tion).8 The technical complexity and equipment necessary to complete the repair
de-termines the level of repair designated. A field-level reparable (FLR) is designated for repair or disposal below the depot level of maintenance. A consumable item is one that is replaced by a new item at the end of its service life, when it is used up beyond the level of economically viable repair. As shown in Figure 2.3, BO rates for all three categories of AMC-managed items exceed the 15 percent BO standard, with the DLR BO rate reaching 30 percent.
Moreover, BO rates are high across all three major subordinate commands (MSCs) within AMC, as shown in Figure 2.4.9 The figure shows overall AMC BO
Figure 2.4
BO Rates at the MSCs Within AMC
RAND MG205-2.4
Backorder rates
TACOM
Warren Rock Island Aviation Missile
AMCOM CECOM .30 .25 .20 .15 .10 .5 .35 0
SOURCE: Army CTASC and LIF/LIDB, all AMC Class IX wholesale sales, CONUS and OCONUS active units. FY1998 FY1999 FY2000 FY2001 FY2002 ____________
8 See Department of Defense, 1995, for definitions.
9 The BO rates are considered high here because they exceed the Army’s target goals. Also, the customers
re-ported BOs as a problem during the VM initiative. More-recent RAND Arroyo Center research (unpublished) by Eric Peltz and Thomas Held benchmarked commercial fleet metrics for the retail and tactical levels and found both the target goals and the performance achieved to be typically well above the 85 percent target. At the same time, the Army’s performance does not appear to be significantly worse than that of the other military services.
Understanding the Scope of the Backorder Problem 13
data across the MSCs, with Tank–Automotive and Armaments Command (TACOM) items further split among management activities at Warren, Michigan, and Rock Island, Illinois; and Aviation and Missile Command (AMCOM) items seg-regated into aviation and missile, both managed at Huntsville, Alabama. Communi-cations and Electronics Command (CECOM) is at Ft. Monmouth, New Jersey. As shown, AMCOM has the highest rates. CECOM’s BO rate was just above the 15 percent level at the beginning of the period but has increased. BOs at TACOM Warren exceeded 20 percent throughout the period, peaking at over 26 percent. Rock Island had the best performance, yet its BO rate exceeded 15 percent in two of the five years. The data indicate that each of the MSCs has had problems consistently meeting the 15 percent BO rate goal.10
Effect of High BO Rates on Customer Wait Times
BOs affect customers, who must either delay needed repairs or resort to workarounds when a part is not available. The CWT metric helps illustrate these problems. CWT is the period from the time the mechanic’s supply clerk enters the requisition into the Unit-Level Logistics System (ULLS) or Standard Army Maintenance System (SAMS) computers until the materiel is processed and available to that clerk at his or her sup-ply-support activity or FDA (a local supply warehouse). CWT includes BO delays and encompasses all supply sources.11 Figure 2.5 places the CWT metric within the
generalized process flow diagram shown in Figure 2.1.
The process begins at the left side of Figure 2.5 with an equipment-maintenance activity that identifies the need for a part. The supply clerk then enters a request, which flows to the FDP and SARSS for processing. If the part is available, it will be issued from the FDP’s inventory, the authorized stockage list (ASL); in this case, the CWT “clock” stops at the point at which SARSS releases the materiel re-lease order (MRO). If the part is not available at the direct supporting FDP, auto-mated supply-management actions search for sources at other local FDPs before routing the requisition to the IM for that specific national stock number (NSN). The IM at the national inventory-control point (NICP) searches storage depots, repair programs, and vendors to eventually satisfy the customer’s requisition. The length of the CWT depends, in part, on how long it takes for this process to be completed.12
____________
10 These charts compare only BO rates. The number of requisitions processed by each of these organizations
varies dramatically.
11 CWT was developed to track the total time from the time a mechanic asks for a part until he or she has it in
hand to perform a maintenance task. However, the current Army data system does not record the time between the part’s arrival at the SSA and the mechanic’s receipt of the part. These limitations are not preventing the Army from making continuous improvements to its process activities.
12 For more explanation of CWT, see CWT and RWT Metrics Measure the Performance of the Army’s Logistics Chain for Spare Parts, 2003.
14 Improving the Army’s Management of Reparable Spare Parts
Figure 2.5
Process Flow Diagram for Army Field-Level Customer Requisitions
RAND MG205-2.5
National-level supply system Installation or tactical-level supply
National Regional Ultimate customer Components of CWT National backorder Equipment readiness
X
Procure or repair Unit parts clerk Tactical supply DLA distribution center Tactical supply Supplymanagement managementSupply
Shop parts clerk National issue Referral Shop fill Shop fill ASL issue Component repair Maintenance to maintenance Fault corrected Fault recorded
X
Document date (of request) Issue date (by SSA)Figure 2.6 illustrates the lengthy CWT that can be associated with a BO. The figure presents Class IX CWT performance between January and June 2002 in sup-port of all customers at an installation with a mechanized infantry division.
The leftmost two bars show total overall CWT, sorted by AMC- and DLA-managed items. Each double set of bars following Total CWT displays CWT for each source of fill. The three-part bars show the variability in CWT. The top of each dark gray segment marks the point (in days) at which 50 percent of the requisitions were complete, while the top of each medium-gray segment marks the 75th percentile, and the top of each light-gray segment, the 95th percentile. The squares within the bars indicate mean performance, while the open ends above the bars indicate that the measurement extends beyond the 100-day scale presented. This chart also displays (as triangles) the percentage of requisitions filled from each source of fill. The percent-ages (right axis) for all of the sources sum to the 100 percent depicted in the Total CWT bars.
The 50th percentile for BOs extends past the 40-day mark, and the columns ex-tend well beyond the 100-day scale of the figure for both DLA- and AMC-managed items requested by this division. The rightmost categories, DVD and Other, also
Understanding the Scope of the Backorder Problem 15
Figure 2.6
CWT Statistics for a Mechanized Infantry Division Installation
RAND MG205-2.6
CWT (days)
Percentage of customer issues
AMC DLA AMC DLA AMC DLA AMC DLA AMC DLA AMC DLA AMC DLA AMC DLA DVD BO Immediate issue Local repair Referral ASL issues Total CWT Wholesale Other 90 40 30 20 10 100 0
SOURCE: CTASC data, Ft. Stewart (January–June 2002). 80 70 60 50 90 40 30 20 10 100 0 80 70 60 50 6.8 4.0 0.2 6.1 13.2 40.8 38.9 0 0 9.0 12.3 35.8 27.6 3.0 0–50% 50–75% 75–95% % of fills Mean
have some long CWTs. However, taken together, these categories comprise less than 10 percent of either the DLA- or Army-managed requisitions.13
For the period examined (January to June 2002), these customers received over 50 percent of their requisitions for AMC-managed items from wholesale sources, and approximately 25 percent of those wholesale-filled requisitions were BOs.14 DLA
per-formed better than AMC with respect to this CWT metric at this installation, with a BO rate of about 13 percent of national-level fills. This installation’s CWT is basi-cally consistent with the aggregate Army data shown in Figures 2.2 through 2.4, al-though the rates do vary from unit to unit because of equipment and other differ-ences.15
____________
13 We do not know whether any of these were BOs. We only know the times involved, and because the numbers
are small, they are not discussed further in this report.
14 Wholesale immediate issues plus BOs, or 38.9 + 13.2 = 52.1, while 13.2/52.1 = 0.253 or ~25 percent.
15 It is important to remember at this point that the BO rate shown in Figures 2.2 and 2.4 is calculated only with
respect to the requisitions passed to wholesale; it does not include requisitions satisfied from local sources (i.e., ASL, referrals, and local repair).
16 Improving the Army’s Management of Reparable Spare Parts
Summary
The evidence presented in this chapter supports the anecdotal reports that retail Army customers have been facing higher-than-expected BO rates, particularly for reparable items. For at least some of these items, the number of repairs occurring at the depots is insufficient to meet demands. In other cases, the current reparable pro-cess has resulted in repairs in anticipation of customer needs that did not occur as projected, increasing (and wasting) inventory and repair investment. In the next chapter, we will examine the process used to set inventory levels and manage the depot-level reparable workload. This discussion will help to assess whether IMs are not planning sufficient quantity or whether other problems account for the insuffi-cient supply of serviceable reparable items.
17
CHAPTER THREE
Understanding the Reparable-Management Process
To understand what is driving the Army’s high BO rates, we need to examine the reparable-management process, which sets inventory levels and returns serviceable reparable assets to the shelf. This process brings the supply management and repair activities into a single integrated process. The intended output is the availability of adequate serviceable inventory to meet expected demands. This chapter defines the reparable-management process and identifies issues that impact its effective and effi-cient functioning.
In this analysis, we are attempting to respond explicitly to an evolving Army maintenance concept that calls for troubleshooting and parts replacement forward (in the field) and component repair to the rear (i.e., in support echelons that are re-moved physically from the engaged forward mission forces).1 This concept is
in-tended both to improve effectiveness by reducing the support footprint forward and to improve efficiency by consolidating repair capacity and capabilities. The shift to this new concept could ultimately produce changes in the reparable workload at the AMC depot level. Thus, the Army has specified the need for a highly responsive reparable process and repair activities that can quickly return items to a serviceable and ready-to-issue condition.2
____________
1 A maintenance concept and policies typically define some of the parameters that supporting repair processes
should meet. Army Regulation 750-1, “Army Material Maintenance Policy” (dated August 18, 2003), was revised to incorporate this new view even as the concept continues to evolve. The previous policy in the July 1, 1996, version, Para 3-1h, was “Repair on site, whenever possible, using the lowest level maintenance activity that has the capability and authority to perform the work. Repair forward will minimize repair times by minimizing evacua-tion of materiel.” The language contained in the new version, Para 3-1b, says the “emerging maintenance policy” will help reduce “the forward deployed logistics footprint. This emerging ‘replace forward, repair rear’ policy will replace the Army’s current ‘fix forward’ policy for future Army units.” The same paragraph goes on to state “the Army is examining the elimination of our current four-level maintenance system in favor of a more-simplified two-level maintenance system” (emphasis added).
2 This research does not explicitly address the issues of privatization or other alternatives to organic repair
capac-ity or capabilcapac-ity. It also does not address the projection of workload by location that might result from changing policy alternatives. In this study, we assumed that the current AMC installation alignment exists, and we at-tempted to determine what could be done within those conditions in the near term to bring about significant improvements in support performance. Further, we have attempted to find avenues for improvement within the context of existing information technology (IT) capabilities.
18 Improving the Army’s Management of Reparable Spare Parts
The Current Reparable-Management Process
The reparable-management process is ultimately driven by the need for reparables at tactical weapon-system or end-item repair activities, as illustrated in Figure 3.1.3
As shown in the left portion of the figure, evidence of an end-item fault or mal-function is discovered during equipment operation or within the larger context of maintenance-process activities (e.g., periodic inspections). The weapon system or end-item may be rendered completely inoperative or may be merely degraded in
Figure 3.1
Key Activities of the Current Reparable-Management Process
RAND MG205-3.1 • Periodic inspections • Servicing consumables • Modification • Etc. Unserviceable return Inspection and operational checks Troubleshoot/ diagnose Repair-process activities Maintenance-process activities Evidence of malfunction or fault Parts request Parts issue National supply interface To defense distribution system Ready for use Repair Remove and replace components Weapon system or end-item Tactical supply support activity
Material not available from tactical sources and replenishments generates requisitions to national level via DAAS
____________
3 There are other sources of demand for reparable assets (e.g., end-item overhaul and modification programs and
foreign military sales (FMSs)). However, Figure 3.1 shows the classic rationale for the reparable-management process as an approach for sustaining military operations.