Performance Insights:
This paper was prepared by the Department of Education, Training and Employment to provide a comprehensive background paper for departmental staff regarding trends and issues in student attendance in Queensland state schools.
Contents
1. Why is school attendance so important? ... 5
2. Patterns of school attendance ... 7
3. Attendance related to student factors ... 18
4. Attendance and student outcomes ... 22
5. Improving attendance — what the research reveals ... 29
6. Queensland state schools context... 36
7. Promising practices in Queensland state schools ... 37
8. Conclusion ... 40
Appendix 1: Calculating Student Attendance ... 48
Appendix 2: Scan of selected attendance programs ... 53
List of tables
Table 1: Categorising student attendance rates
Table 2: Prep cohort sample with less than 95% and less than 85% attendance rates over time Table 3: Year 5 cohort sample with less than 95% and less than 85% attendance rates over time Table 4: The attendance rates for a sample of students with SDAs
Table 5: Reasons for student absences from school Table 6: Overview of evidence for attendance strategies
Table 7: Categories of school attendance strategies (not all evidence based) Adapted from Reardon (2008) and others
Table 8: Schools (with more than 100 students) with largest attendance gain
List of figures
Figure 1: Queensland state school students (%) by attendance rate range Figure 2: Proportion of attendance less than 85% by region
Figure 3: Absences by reason by day Figure 4: Absences by week by reason
Figure 5: Attendance rates by year level for all students and Indigenous students Figure 6: Australian states school attendance rates
Figure 7: Queensland state school attendance rate and school band Figure 8: Staff morale and student attendance rate
Figure 9: Queensland state school attendance rate and student mobility Figure 10: Persisting relationship between SES and attendance over time Figure 11: SES and reasons for non-attendance
Figure 12: Student satisfaction and attendance rates
Figure 13: Queensland state school attendance rates by NAPLAN Year 5 mean scale scores Figure 14: Indigenous and non-Indigenous Queensland state school attendance rate by NAPLAN
Reading mean scale score
Figure 15: Attendance rate less than 85% (unauthorised and unexplained) and subsequent school disciplinary absences for a Year 7 Sample
1. Why is school attendance so important?
Since the introduction of the State Education Act of 1875, the Queensland Government has required parents to ensure their children attend school. Under current legislation, Queensland parents have a legal obligation to ensure their children attend school between the ages of 6.5 and 16 years (or the end of Year 10). Parents also have an obligation to ensure their children are participating in school, training or employment until they turn 17 or achieve a prescribed qualification.1
Queensland state schools operate for approximately 200 days each year. Students are expected to attend school on every one of those days unless there is a reasonable excuse. Although individual school and student attendance rates vary considerably, over recent years, on any day, an average of 9% of Queensland’s 480,000 state school students in 2010 were absent from school. Based on 2007–2010 data, approximately 30% of Queensland state school students were absent for 20 or more days per year.
Attendance and student outcomes
Research confirms a strong link between attendance and student outcomes. While some student absences are unavoidable and understandable due to illness and the like, or enforced through school disciplinary absences, many are not. These could be unexplained or unauthorised absences.
Poor school attendance can be linked to a number of related short and long-term adverse outcomes for students including lower academic outcomes, early school leaving, substance use, poverty,
unemployment and negative health outcomes. However these factors may be interrelated in complex ways and factors that lead to low levels of attendance may also independently lead to some of these adverse outcomes.
A student’s regular absence from school may be a critical indicator in disengagement, leading directly to some of these adverse outcomes. Regardless of the nature of the relationship, poor school
attendance, particularly with a high number of unexplained or unauthorised absences, is a readily observable warning sign for potential longer-term adverse outcomes.
Poor school attendance can be an early warning sign for future adverse outcomes
The cost of non-attendance
Any absence from school constitutes a loss of educational opportunity because students miss out on learning. When a student is absent, the investment in their education is still made by governments but the benefits are not received by the student or the wider community. The 2010 state attendance rate
1 A child attends a State school or non-State school only if the child complies with the school’s requirements about physically attending, at
particular times, its premises or another place. A child enrolled in a program of distance education is taken to attend the school of distance education offering the program by completing and returning the assigned work for the program and a child enrolled in an external program is taken to attend the State school or non-State school offering the program by complying with its requirements about communicating with or contacting the school for the purpose of participating in the program.
was 91% and, at an estimated cost of $63.662 per student per day, the missed educational opportunities represented a total notional investment of just over $550 million.
Persistent non-attendance may require additional resources to re-engage students in schooling and to help them catch up on missed learning. This can involve learning and personal student support staff, and interagency collaborations.
Poor attendance represents a loss of educational opportunity and a cost to the community
Schools’ influence on student attendance
School personnel understand the importance of student attendance. While Queensland state schools work hard to identify and mitigate the school factors that impact on student engagement and attendance, they have limited influence over numerous additional student and family factors related to attendance. Although the primary responsibility for a student’s attendance at school rests with the parents/caregivers and student, schools can have a positive influence on student attendance.
Promoting the value of school attendance and supporting students and families to deal with barriers to school attendance where possible are key elements in helping to improve student attendance. Given this, school strategies to improve attendance need to be based on a clear understanding of the range of factors that may be impacting on their own students’ non-attendance and an appreciation of which factors can be changed. Schools must base their approaches to improving student attendance within an understanding of the needs of their students.
Parents/caregivers and schools can positively influence factors related to student attendance
Overview of this paper
This paper combines information from a range of sources including State school data to inform responses to non-attendance of students. It covers:
• patterns and trends in attendance in Queensland state schools
• relationships between student attendance and various student and school factors
• relationships between student attendance and literacy and numeracy outcomes and student behaviour
• effective strategies identified in research literature
• case studies from Queensland state schools with significantly improved attendance between 2007 and 2011.
2
2. Patterns of school attendance
This section presents data on patterns of attendance in Queensland state schools. Over 400,000 student records annually can be analysed using unique student identifiers and linked to information on demographics, student behaviour and student achievement.
Classifying absence types
Student attendance is monitored via roll marking (according to procedure Roll Marking in State Schools) with the data being recorded using the department’s OneSchool platform.
Queensland state schools are guided by nationally-agreed standards for reporting student absence (see Appendix 1). Student absence is categorised as:
• authorised for example, illness, undertaking a medical procedure or attending a funeral • unauthorised for example, shopping, visiting friends and relatives, fishing or camping, or • unexplained when no information has been provided by parents/carers or students and the
absence is pending the school’s own investigations.
Categorising attendance rates
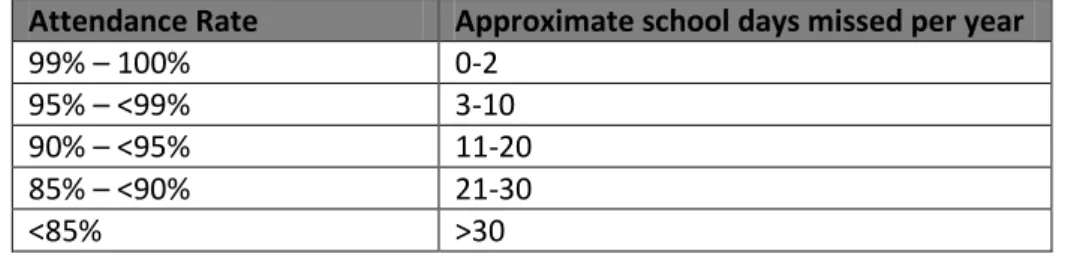
Table 1 presents the standard range of attendance rates used for describing student attendance. Table 1: Categorising student attendance rates
Attendance Rate Approximate school days missed per year
99% – 100% 0-2
95% – <99% 3-10
90% – <95% 11-20
85% – <90% 21-30
<85% >30
The report uses a school attendance rate which allows important patterns across schools to be identified. A school's attendance rate is generated by totalling the number of days attended for all students and comparing this to the total number of days possible for all students, expressed as a percentage (see Appendix 1).
Attendance in Queensland state schools
The overall reported attendance rate in Queensland state schools decreased between 2006 and 2009 from 92.2% to 90.7%, and increased slightly in 2010 to 91.0%.
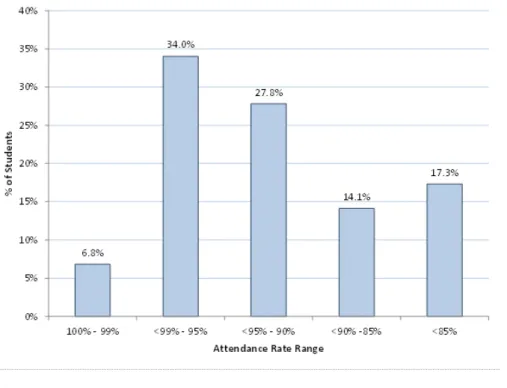
Figure 1 presents the number of students by attendance rate range for 2010. In that year:
• most students (68.6% or approximately 325,000 students) had an attendance rate of 90% or higher
• 40.8% (approximately 196,800) of students had an attendance rate of 95% or higher, thus missing fewer than 10 days school
• 31.4% (approximately 148,800) students had an attendance rate below 90% and missed more than 20 days of school.
Figure 1: Queensland state school students (%) by attendance rate range3
Approximately 70% of students attend school at least 90% of the time Approximately 41% of students have attendance rates of 95% or above
Approximately 30% of students had attendance rates below 90% which means they missed more than 20 days of school in the year
Attendance by region
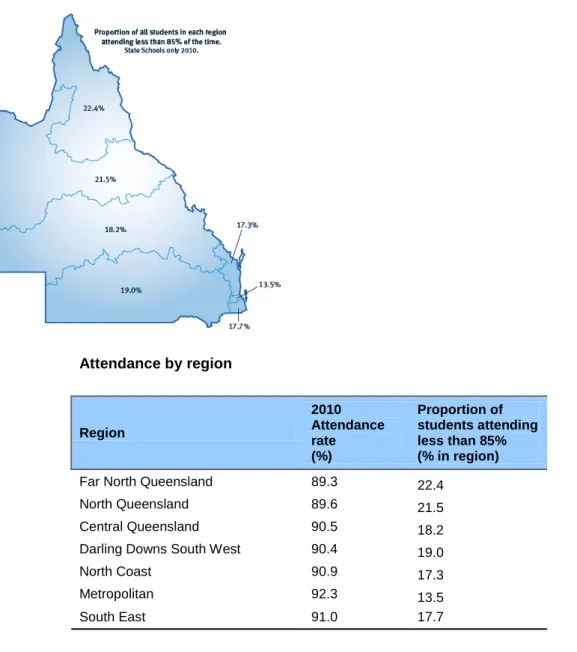
Figure 2 shows that regions with more rural and remote schools tend to have a higher proportion of students with attendance rates below 85%. Percentages represent the students with attendance rates below 85% as a proportion of all students in the region in 2010.
3 Semester 1, 2010.
Figure 2: Proportion of attendance less than 85% by region4 Attendance by region Region 2010 Attendance rate (%) Proportion of students attending less than 85% (% in region)
Far North Queensland 89.3 22.4
North Queensland 89.6 21.5
Central Queensland 90.5 18.2
Darling Downs South West 90.4 19.0
North Coast 90.9 17.3
Metropolitan 92.3 13.5
South East 91.0 17.7
Source: Statistics and Information
(http://education.qld.gov.au/schools/statistics/index.html)
Regions with more rural and remote schools have a higher proportion of students with attendance rates below 85%
4 2010 year only
Reasons for school absences across the week
Figure 3 shows the reasons recorded for student absences in 2010 by day of the week. The two most common reasons for student absences were illness and unauthorised. Generally, more student absence occurs on Fridays and Unauthorised absences are recorded more frequently on Fridays. Unauthorised absence is the default category in the department’s OneSchool application when a student’s non-attendance is first recorded by the school. This category is updated if the school has evidence of the cause of the student absence from the student or parent/caregiver.
Figure 3: Absences by reason by day5
The two most common reasons for student absences were ‘illness’ and ‘unauthorised’ Mondays and Fridays show higher numbers of absences
Reasons for absences across the semester
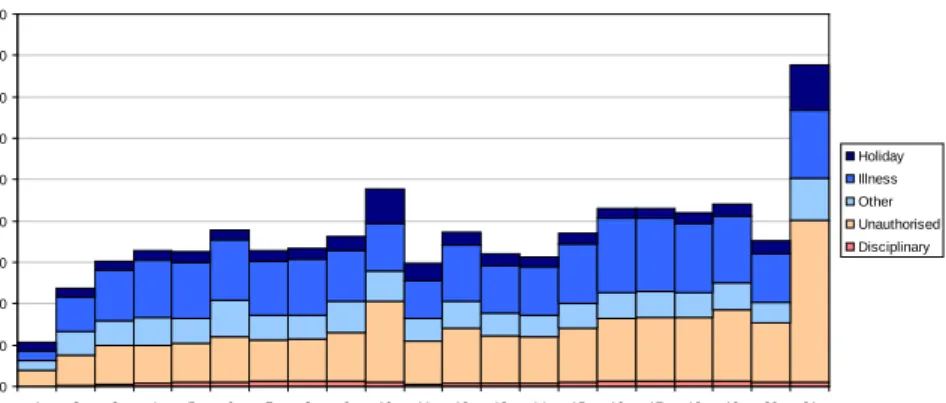
Figure 4 shows that student absence tends to increase slightly over the semester. Absence rates related to illness seem to mirror unauthorised absences across the semester, apart from the final week of each term when holiday and unauthorised absences are relatively high. This may suggest that students and/or parents/caregivers may consider attending school less important during the last week of term or semester. 5 Semester 1, 2010. 0 10 20 30 40 50 60
Monday Tuesday Wednesday Thursday Friday
Day of Week A b sen ces P er W eekd ay ( '000s) Holiday Illness Other Unauthorised Disciplinary
Figure 4: Absences by week by reason6
The final week of term or semester feature lower attendance, largely due to a greater proportion of holiday related and unauthorised non-attendance
Attendance over the years
Figure 5 illustrates that attendance declines as students progress through school. By Year 10, the attendance rate is lowest and below 90%. Indigenous students in Queensland state schools tend to have lower attendance rates throughout their schooling and a sharper decline in attendance in high school. This pattern was consistent regardless of socio-economic status. The 2010 results showed improved rates of attendance across the secondary years compared to 2008 and 2009, as well as an improvement in attendance rates for Indigenous students across all years compared to 2008 and 2009. Figure 5: Attendance rates by year level
for all students and Indigenous students7
Average student attendance declines in Years 8, 9 and 10, with a sharper decline for Indigenous students 6 Semester 1, 2010. 7 2008 to 2010. 0 50 100 150 200 250 300 350 400 450 1 2 3 4 5 6 7 8 9 10 11 12 13 14 15 16 17 18 19 20 21 School Week A b sen ces P er W eek ( '000s) Holiday Illness Other Unauthorised Disciplinary 50% 60% 70% 80% 90% 100% A tt en da nc e Ra te Year Level 2008 All 2009 All 2010 All 2008 Indigenous 2009 Indigenous 2010 Indigenous Indigenous Students All Students
Year 10 student attendance is the lowest of all year levels and below 90%
Attendance over school years – comparison with other states
Despite differences in legislation, recording systems and categorisation across states and territories, Queensland school attendance rates display similar patterns to other Australian jurisdictions. Figure 6 shows that student attendance across jurisdictions declines marginally through the primary schooling years and then more markedly declines in the secondary schooling years. Although not directly comparable, Queensland’s reported attendance rates tend to be closer to those of Western Australia and South Australia than New South Wales or Victoria.
Figure 6: Australian states school attendance rates8
Predicting student attendance
The consistency of the pattern of attendance over years at school raises the question of whether patterns for individual students are maintained over time and whether early patterns are useful in predicting later student attendance.
Following a 2008 Prep cohort
A cohort of 37,899 Prep students from 2008 was tracked to 2010. Although non-compulsory,
Queensland Prep enrolments exceeded an estimated 96% of the eligible population in 2008. Prep Year (non-compulsory) and Year 1 (compulsory) share similar attendance rates.
About 57% (21,500) of the Prep Year cohort attended less than 95% of the time in 2008.
Approximately 75% of this group continued this level of attendance in Year 1. Of the students who attended Prep less than 95%, approximately 60% maintained this rate in both Year 1 and Year 2. About 17% (6,500) of the Prep Year cohort had an attendance rate of less than 85% in 2008. Of these students, approximately 57% maintained an attendance rate below 85% in Year 1 and approximately 41% maintained an attendance rate below 85% in both Year 1 and Year 2.
Illness is a frequent and legitimate reason for absence from school for this age group, however after discounting health reasons approximately 13% (just over 4,900) of the Prep sample attended less than 85% with absences excused because of other reasons. Of this group, 55% continued to have an attendance level below 85%, once compulsory schooling had begun. These results are summarised in Table 2.
8 2007 to 2008. Note: Student attendance data are not collected uniformly across jurisdictionsand schooling sectors and therefore are not directly comparable.
0 10 20 30 40 50 60 70 80 90 100 Year 1 Year 2 Year 3 Year 4 Year 5 Year 6 Year 7 Year 8 Year 9 Year 10 Year 1 Year 2 Year 3 Year 4 Year 5 Year 6 Year 7 Year 8 Year 9 Year 10 2007 2008 A tt en da nc e R at es ( % )
Source: National Reports on Schooling in Australia 2007 and 2008, MCEETYA NSW Vic Qld SA WA
Table 2: Prep Cohort sample9 with less than 95% and less than 85% attendance rates over time Prep Year cohort 37,899 students (2008) % Year 1 students maintaining same rate (2009)
% Year 2 students maintaining same rate (2010)
Attendance rate
<95% all reasons 57% of cohort 21,500 students 75% maintain <95% rate 16,125 students 60% maintain <95% rate 9,675 students <95% all reasons excl health 48% of cohort
18,192 students
62% maintain <95% rate 11,279 students
44% maintain <95% rate 4,963 students
<85% all reasons 17% of cohort 6,500 students 57% maintain <85% rate 3,705 students 41% maintain <85% rate 1,519 students <85% all reasons excl health 13% of cohort 4,927 students 55% maintain <85% rate 2,710 students 39% maintain <85% rate 1,057 students
Following a 2007 Year 5 cohort
A 2007 sample of 31,082 Year 5 students who completed Year 1 in 2003 provided a cohort of students who had been in the state schooling system for at least four years.
About 51% (approximately 15,850) of the Year 5 students had an attendance rate of less than 95% in 2007. Of these students, approximately 74% maintained an attendance rate of less than 95% in Year 6 and approximately 52% maintained this rate in both Year 6 and Year 7.
About 11% (over 3,400) of the Year 5 students had an attendance rate of less than 85% in 2007. Of these students, approximately 52% maintained a low attendance rate in Year 6, and approximately 34% maintained a low attendance rate in both Year 6 and Year 7.
Table 3: Year 5 cohort sample10 with less than 95% and less than 85% attendance rates over time Year 5 cohort
32082 students (2007)
% Year 6 students maintaining same rate (2008)
% Year 7 students maintaining same rate (2009)
Attendance rate
<95% all reasons 51% of cohort 15,852 students
74% maintain <95% rate 11,730 students
52% maintain <95% rate 6,099 students
<95% all reasons excl health 39% of cohort 12,122 students
79% maintain <95% rate 9,576 students
60% maintain <95% rate 5,745 students
<85% all reasons 11% of cohort 3,419 students
52% maintain <85% rate 1,778 students
34% maintain <85% rate 605 students
<85% all reasons excl health 8% of cohort 2,486 students 58% maintain <85% rate 1,442 students 45% maintain <85% rate 649 students 9 2008 Sample of Prep students. 10 2007 Sample of Year 5 students.
Thus, the results demonstrated a very similar relationship to those identified for the Prep students. The strength of prediction of attendance level in Year 6 and 7 was
enhanced by removing illness as a reason for absence. That is, those students who were absent for reasons other than illness tended to be more likely to attend at a similar level in subsequent years. Thus, from one year to the next, attendance can be predicted with between 50% and 75% accuracy using prior attendance. The maintenance of attendance rates for a large proportion of students suggests attendance patterns tend to persist through primary schooling. Moreover, the results indicate health-related absences had less association with on-going non-attendance for students. Establishing strong attendance patterns at an early age may be a key factor influencing latter attendance patterns
There is a strong relationship between early schooling attendance patterns and higher attendance throughout schooling
Attendance can be predicted with some confidence based on prior attendance
Attendance and school size
It is worth considering whether features of schools themselves, such as school size are important in student attendance. When other factors such as regional location have been considered, school size is not related to student attendance (Figure 7).
Figure 7: Queensland state school attendance rate and school band11
School size does not have a significant relationship with student attendance
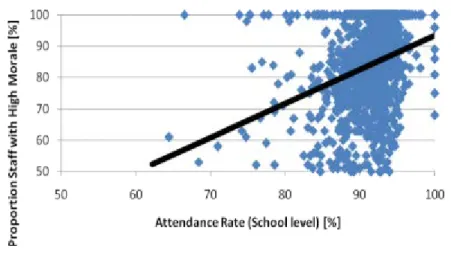
Attendance and staff factors
Other school-level factors that might be related to student attendance include staffing factors. Analysis of the 2009 workforce data from 1,222 schools related to 2010 student attendance
information12 revealed that, after their Index of Relative Socio-Economic Advantage (IRSED) was accounted for, 26% of variance in student attendance was explained by all staff factors combined.
The factor most strongly correlated with student attendance was staff morale in the year prior. A scatter plot of the relationship between staff morale and student attendance is presented in Figure 8. It should be noted that the relationship between staff morale and student attendance was weak. Figure 8: Staff morale and student attendance rate13
Summary
In summary, the department’s state school student attendance data reveals: • approximately 70% of students attend school at least 90% of the time
• substantially more students miss fewer than 10 days of school (approximately 41% of students have an attendance rate of >95%) than are absent for more than 20 days (approximately 31% of students have an attendance rate of less than 90%)
• regions with more rural and remote schools have a higher proportion of students with attendance rates below 85%
• overall attendance rates are lower on Mondays and Fridays than other weekdays • the most common reasons recorded for student absences are illness and unauthorised • holiday and unauthorised absences predominate in the last week of each school term and are
notably higher in the final week of semester
• average student attendance declines over Years 8, 9 and 10 with a sharper decline for Indigenous students.
12It was assumed that as the 2010 student attendance data was drawn from Semester 1 data that EQ workforce data would need to pre-date
it. For this reason 2009 EQ workforce data were regressed on the 2010 student attendance data.
13
• the lowest attendance rate is recorded in Year 10 and is below 90% which is consistent with patterns in other states
• attendance rates tend to ‘persist’ over time, that is, early school attendance is a reasonable predictor of likely later attendance
• school size is not related to attendance rates
• staff morale appears to be the staff factor most strongly correlated with student attendance. These analyses show the trends and patterns in attendance across the State, across the school year, and across student years at school. These patterns do not imply this is the situation for every student or every school. The data provide useful information for helping to develop and implement system-wide and local initiatives to improve attendance. The patterns of attendance over days of the week, weeks of the term and years of schooling suggest that strategies targeting attendance at these times could be effective in lifting overall attendance rates. The finding that attendance rates tend to be maintained over time appears to support consideration of approaches that explore early and concerted intervention with students who have lower attendance.
3. Attendance related to student factors
This section looks at relationships between student attendance and student: • mobility
• socio-economic status • satisfaction ratings.
Although some of these factors may be beyond the school’s direct influence, strategies at school can serve to positively influence student attendance.
Attendance and student mobility
Most students experience at least one move between schools as they leave primary school and enter secondary schooling. Some students move considerably more often during their schooling years. According to the 2010 data, the number of moves a student made (in the two years prior) was associated with attendance rates, with most effect for Year 9 students (indicated by the green line in Figure 9). Figure 9 indicates that on average each move is associated with a 2 percentage point decline in attendance rate.
This relationship between mobility and attendance remained after controlling for socio-economic status. Lower attendance may result from the very nature of relocation of families but it is clear that each move reduces the time in school.
Figure 9: Queensland state school attendance rate and student mobility14
Students who move between schools more often tend to have lower attendance rates
14 Attendance rates are for Semester 1, 2010 and student mobility is presented for 2008 to 2010. 50% 55% 60% 65% 70% 75% 80% 85% 90% 95% 100%
no moves 1 move 2 moves 3+ moves
Av er ag e St ud en t A tt en da nc e Ra te (% )
Number of School Moves
Yrs 3 to 5 Yrs 5 to 7 Yrs 7 to 9
Attendance and student socio-economic status
Data from two student groups was examined to determine if there is a relationship between socio-economic status (SES) and student attendance.
A sample of state school Prep students in 2008 (37,899) tracked to 2010 demonstrated slight but consistent correlations between their 2006 Index of Relative Socio-Economic Disadvantage (IRSED) and their attendance in Prep and subsequent attendance in Years 1 and 2. The correlations were slightly stronger using IRSED calculated based on student address rather than school address. A sample of state school Year 7 students in 2009 (31,753) also showed the same slight, but very consistent, correlations between their IRSED and their attendance.
Figure 10 shows the relationship between SES for both the 2008 Prep sample and the 2009 Year 7 sample of students.
Figure 10: Persisting relationship between SES and attendance over time15
* All correlations significant at p<.001
These findings suggest that the lower the schools’ or students’ SES, the lower the students’
attendance, irrespective of the method for calculating SES. SES is correlated with student attendance as early as in the Prep Year and the relationship is still present many years later. Similar patterns of results were identified for every year level of schooling.
On average, students from lower SES areas exhibit lower attendance rates
It is likely that SES, student attendance and outcomes are interrelated.
15 Results are presented tracking 2006 IRSED information and 2007 to 2010 attendance information, as indicated. 2006 School IRSED 2008 Prep Attendance r = .16 2009 Year 1 Attendance r = .16 2010 Year 2 Attendance r = .13 Associated with 2006 School IRSED 2007 Year 5 Attendance r = .18 2008 Year 6 Attendance r = .17 2009 Year 7 Attendance r = .16 Associated with 2006 Student IRSED 2008 Prep Attendance r = .21 2009 Year 1 Attendance r = .22 2010 Year 2 Attendance r = .19 Associated with 2006 Student IRSED 2008 Year 5 Attendance r = .18 2009 Year 1 Attendance r = .19 2010 Year 2 Attendance r = .20 Associated with
The SES of students in Prep in 2008 was considered in relation to their reasons for non-attendance. Unauthorised and unexplained absences were more substantially related to
IRSED than other types of absences. The findings were consistent regardless of whether school or individual measures of IRSED are used as illustrated in Figure 11.
Figure 11: SES and reasons for non-attendance
Investigation of sampled students in Year 1 in 2009 and in Year 2 in 2010 confirm the notion that lower SES is associated with lower levels of attendance. Lower SES was associated with more unexplained and unauthorised absences, but not with more illness-related absences.
Students from lower SES backgrounds tend to exhibit higher levels of unauthorised and unexplained attendance
Attendance and student satisfaction with the school
Every year, Queensland state schools undertake opinion surveys with students, parents and school staff. Student satisfaction from the 2010 School Opinion Survey (SOS) was analysed in relation to average student attendance for the same school in 2010.
The SOS is given to a random sample and students complete it on an optional basis. This means the sample might not be representative of students with low attendance rates. Recognising the limitations of available data, the results indicate only a small correlation between higher student satisfaction with the school and higher attendance rates (see Figure 12).
Figure 12: Student Satisfaction and Attendance Rates16
16 2010 data. 50% 55% 60% 65% 70% 75% 80% 85% 90% 95% 100% 0% 10% 20% 30% 40% 50% 60% 70% 80% 90% 100% A tt en da nc e R at e (% ) Satisfied Students (%)
2010 Student Satisfaction versus Attendance Rates
Satisfied that this is a good school Lower
Socio-Economic Status
More unexplained and unauthorised absences
Likewise, similar patterns based on data from the annual parent SOS in 2010 suggest only a very weak relationship exists between the 2010 parent satisfaction rating and student attendance rates.
Only a slight relationship exists between student satisfaction/parent satisfaction and student attendance
Summary
A consideration of factors related to student attendance reveals:
• students who move schools are more likely to have lower attendance rates
• lower SES is associated with more unexplained and unauthorised absences, but not with more illness-related absences
• student and parent satisfaction are only slightly related to attendance.
While these analyses can illustrate the relationships for a range of factors with attendance, they do not suggest this is the reality for each individual student.
Many of these factors are outside of the direct control of the school, but schools may be able to implement strategies to mitigate their impact.
4. Attendance and student outcomes
This section considers the relationship between student attendance and student outcomes. It uses data available from the National Assessment Program Literacy and Numeracy (NAPLAN) results and data on students’ disciplinary absences.
Attendance and student performance
There is a correlation between students’ attendance rates at school and academic performance. Figure 13 shows higher attendance is associated with higher student performance in all Year 5 NAPLAN areas of numeracy, reading, spelling, writing and grammar & punctuation (using 2009 data). Figure 13: Queensland state school attendance rate
by NAPLAN Year 5 mean scale scores17
School attendance rate
The relationship between attendance and NAPLAN scores shows that each 1 percentage point increase in attendance for Year 5 students is related to higher student outcomes by an average of 2-3 NAPLAN scale score points in numeracy, reading, spelling, writing and grammar & punctuation. While there is a consistent relationship, this does not suggest a causal relationship between attendance rates and academic performance; the relationship is likely to be complex and impacted upon by the range of other factors not available for analysis in these data.
Every day absent may be impacting on student performance—thus, for school attendance, every day counts
Attendance and student performance on NAPLAN are related
17 Attendance rates are for Semester 1, 2009 and NAPLAN Year 5 data for 2009 are shown.
300 350 400 450 500 550 600 0.7 0.75 0.8 0.85 0.9 0.95 1 Sc al e S co re Numeracy Reading Writing Spelling
Figure 14 demonstrates that Indigenous student NAPLAN reading results are lower than non-Indigenous student results and match the state-wide relationship between
attendance and NAPLAN results. The graph appears less flat due to the smaller number of Indigenous students being represented (as averages across larger numbers of any students tend to show less fluctuation).
Figure 14: Indigenous and non-Indigenous Queensland state school attendance rate by NAPLAN Reading mean scale score18
The relationship between attendance and NAPLAN scores is similar for Indigenous and non-Indigenous students
18 Attendance rates for Semester 1, 2009 and NAPLAN Reading 2009 are shown.
300 350 400 450 500 550 600 1 0.95 0.9 0.85 0.8 0.75 0.7 N A PL A N M ea n Sc al e Sc or e Attendance Rate Non-Indigenous Year 9 Year 7 Year 5 Year 3 300 350 400 450 500 550 600 1 0.95 0.9 0.85 0.8 0.75 0.7 N A PL A N M ea n Sc al e Sc or e Attendance Rate Indigenous Year 9 Year 7 Year 5 Year 3
Relative effect of attendance in various years on reading and
numeracy
Although student attendance tends to be higher in the early years of schooling, the effect of each day absent in the early years may be greater than in the later years. Each day absent in the earlier years appears to have a more deleterious effect on student performance than a day in later years, and the effects appear greater for some areas of NAPLAN than others.
Analysis based on 2009 NAPLAN Reading Scale Scores and attendance rates shows that the relative impact of less than 95% attendance (more than 10 days absent) at Year 3 is 2.1 times the effect of the same rate of attendance in Year 9. At less than 85% attendance (more than 30 days absent) the relative effect at Year 3 is approximately 1.2 times that at Year 9.
Extrapolating this trend suggests that less than 95% attendance in Year 1 may have as high as three times the effect at Year 10 and 7 times at Year 12. Similar estimations for the effect of less than 85% attendance at Year 1 suggest that the effect may be 1.4 times at Year 10 and 1.5 times at Year 12. The relationships presented here suggest that lower attendance results in lower performance but we cannot establish causality with the available data.
Each day absent in the early years has a greater effect on reading performance in the later years
In contrast to the higher relative impact of early attendance on reading, the attendance in later years has a greater impact on numeracy (2009 NAPLAN scale scores). The relative effect of 95% attendance (10 missed days of school) at Year 9 is 1.2 times higher than the effect at Year 3. For students with 85% attendance, the relative effect at Year 9 is 1.1 times higher than the effect at Year 3.
Extrapolating this trend suggests that less than 95% attendance (more than 10 day absent) in Year 12 may have 1.3 times the effect at Year 1. Similar estimations for the effect of 85% attendance at Year 12 suggest that the effect may be 1.4 times higher than the effect at Year 1.
Each day absent in the later years of schooling has a greater effect on numeracy in the later years
These findings do not imply causality, but reveal a complex and interesting relationship between attendance and achievement. One aspect of this complexity is that the differential impact of
attendance on student outcomes over time may be less apparent when using school attendance rates. More students are absent from school more often in later years, which tends to focus school
initiatives on non-attendance in later years. However, these data suggest the effect of non-attendance on student development may be just as large or larger in earlier years.
A focus on school attendance rates or the absolute number of days absent may disguise the relatively higher impact of non-attendance in the early years
School disciplinary absences and attendance
School disciplinary absences (SDAs) are absences enforced by a school for student conduct that is prejudicial to the good order and management of the school. SDAs include detention, suspension, exclusion and cancellation of enrolment.
Two samples were considered to explore the relationship between SDAs (specifically, suspensions and exclusions) and attendance.
From a sample of 30,623 Year 6 (2008) students who had been enrolled in Queensland state schools since Year 1 (2003), students were grouped according to four different categories of student
disciplinary absences (SDA) in 2008. The attendance rates of the four groups were tracked over the period 2008 to 2010 — see Table 4.
Students who experienced an SDA in Year 6 (2008) generally demonstrated lower attendance rates in 2008 when compared to all sampled students. The rate of decline in attendance rate was greater for students experiencing short suspensions and exclusions when compared to the entire sample. The rate of decline in attendance appeared to accelerate into Year 8 (2010).
Table 4: The attendance rates for a sample of students with SDAs19
All Year 6 Students Short Suspensions (1–5 days) Students Long Suspensions (6–20 days) Students Suspension with Recommended Exclusion Students Exclusion Total Number 30,623 790 54 4 6 2008 Year 6 attendance rate 93% 85% 74% 88% 90% 2009 Year 7 attendance rate 92% 85% 81% 86% 85% 2010 Year 8 attendance rate 90% 79% 72% 86% 67%
SDAs in a given year are related to attendance rates around or below 85% in subsequent years
A different sample of 33,402 Year 7 students (2008) revealed that attendance patterns statistically predict subsequent school disciplinary absences. A previous attendance rate of less than 85% in 2007 comprised only of unauthorised or unexplained absences was strongly related to students having an SDA in the subsequent year. Students with profiles of high levels of unauthorised or unexplained absences (for example, more than 20 days) were over four times more likely to experience student disciplinary absences in the subsequent year when compared to those with higher attendance (Figure 15).
Figure 15: Attendance rate less than 85% (unauthorised and unexplained) and subsequent school disciplinary absences for a Year 7 Sample20
Students with attendance rates lower than 85% (unauthorised and unexplained absences) are four times more likely to have subsequent SDAs
The literature on attendance and student outcomes
Analysis of the department’s attendance data found consistent correlations between attendance and student NAPLAN scores and disciplinary absences. This aligns with findings in the research literature on a much broader range of student outcomes.
The literature suggests that a low level of school attendance may be associated with:
• poor academic achievements including lower levels of achievement on literacy (for example, reading, writing) and numeracy (Simons, Bampton, Findlay & Dempster, 2007)
• reduced opportunities for students to learn and access educational resources e.g. programs, teachers who impact on students’ academic attainment (Bridgeland, DiIulio & Morison, 2006) • further absenteeism in subsequent grades (Alexander, Entwisle & Horsey, 1997; Barrington & Hendricks, 1989; Kaplan, Peck & Kaplan, 1995; Rumberger, 1987; Rumberger, Ghatak, Poulos, Ritter& Dornbusch, 1990)
• early school leaving (Capps, 2003; Epstein & Sheldon, 2002; Reid, 1999, 2002; Bridgeland, DiIulio & Morison, 2006). Studies of early school leavers show that leaving school is merely the culminating act of a long withdrawal process from school (Finn, 1989; National Center for Education Statistics, 2003; Newmann, Wehlage & Lamborn, 1992)
• leaving school with fewer qualifications (National Audit Office, UK, 2005)
• alcohol, tobacco, and substance use in adolescents (Hallfors, Vevea, Iritani, Cho, Khatapoush & Saxe, 2002); attendance is a stronger predictor of youth substance use than academic
achievement (Hallfors, et al, 2002; Hendricks et al, 2010)
• unemployment and long-term unemployment (Rumberger, 1987) • labour force status (Rumberger, 1987)
• increased likelihood of poverty (Bell, Rimmer & Rimmer, 1992)
20 2007 attendance rate data and 2008 SDA data are shown. 2007 Year 6 Attendance rate <85% (unauthorised/unexplained) 2008 Year 7 Student Disciplinary Action
• criminal activity (Harlow, 2003)
• lower level of health/life expectancy (Cohen & Soto, 2002).
Gottfried (2009) found that distinguishing between authorised or unauthorised absences is important for isolating the impact of low attendance. A higher proportion of authorised absences to total absences is linked to a positive relationship between reading and math test scores. Conversely, students with a higher proportion of unauthorised absences display lower achievement.
It is plausible for some factors that contribute to low levels of attendance also independently lead to some of these outcomes. On the other hand, it may be that a student’s attendance itself is a critical factor in a disengagement process, which leads directly to some of these adverse outcomes. At a minimum, it can be asserted that poor attendance at school, particularly with a high number of unexplained absences, is a readily observable warning flag for potential future adverse outcomes.
Poor attendance can be an early warning flag for potential future adverse outcomes
Summary
In terms of student attendance and student outcomes:
• attendance has a strong and persisting relationship with student outcomes as measured by NAPLAN scores
• each day absent in the early years has a stronger relationship with lower performance reading in later years
• each day absent in the later years has a stronger relationship with lower performance numeracy in the later years
• a focus only on the number of days absent in the later years as a school trigger for
intervention may obscure the relatively higher impact of non-attendance in the early years on later outcomes
• unauthorised and unexplained absences have the strongest correlations with lower student outcomes
• Student Disciplinary Absences (SDAs) in a given year are related to attendance rates below 85% in subsequent years
• an attendance rate of lower than 85% (unauthorised absences) is related to subsequent SDAs • research literature suggests a number of adverse outcomes are related to lower student
attendance levels.
It is important to note that a statistical correlation does not establish a causal relationship between two factors and it is not asserted that attendance has a simple causal relationship with student outcomes. In addition, although the patterns indicate probability, they do not predict the experience
of each or every student. This information may prove useful in informing responses to student attendance at the system, school, community, family and/or student levels.
These findings suggest that students, parents and school staff need to find ways to ensure all students maximise their attendance at school. Knowledge about how schools function and what underpins human behaviour and motivation must also be considered in using these findings.
The evidence suggests that developing and nurturing high levels of school attendance throughout schooling is likely to support improved learning outcomes and improved future attendance patterns.
5. Improving attendance — what the research reveals
This section provides an overview of the national and international research on the reasons for student absence as well as the effectiveness of strategies to improve school attendance. Schools have only limited influence over some factors, but a clear picture of all factors is important to developing locally responsive initiatives for students.
Factors influencing student absences
Students are absent from school for different reasons, depending on the age and circumstances of each student.
Baker, Sigman and Nugent (2001) concluded that the reasons for low attendance fall into four categories: school, family, student, and economic and cultural (Table 6). Some factors may directly engage student non-attendance, while other factors may have an inadvertent or indirect effect. A range of factors is listed below within the four categories proposed by Baker et al (2001).
Table 5: Reasons for student absences from school Student absences from school
school factors family factors student factors economic and cultural
factors
School factors
• policies and procedures about attendance, including inconsistent attendance policies and lack of meaningful consequences for students of inappropriate absence
• student behaviour management; school’s expectations of students (for example, workload, testing, performance); levels of school support for students and relationship with teachers; attitudes of teachers, students, and administrators
• ability to engage the diverse cultures and learning styles of students • teaching quality (DEEWR, 2006)
• the response by schools to monitoring attendance and intervening when issues arise for a student is critical to ensuring attendance rates remain high
Family or home factors
• specific parental behaviours such as limited monitoring of student whereabouts • parents not being aware of attendance laws and obligations
• lack of parental insistence that children go to school in the morning (DEEWR, 2006) • differing views about education (Baker et al 2001) or lack of value for education
• competing family priorities; for example, conflicts, getting organised, preparation of lunches, babysitting, transport, holidays or students caring for other family members • domestic violence, child abuse or neglect, drug or alcohol issues
• employment obligations of parents and carers and inflexible employers
Student factors
• past negative school experiences, lack of interest in school and education and levels of self-insight and knowledge about future pathways and the links between school attendance, educational outcomes and work, personal occupational goals and school completion
• habituated school absence or misunderstanding or ignorance of attendance laws and incentives (Baker et al., 2001; Rohrman, 1993)
• conflict with other students and teachers or lack of school-engaged friends (DEEWR 2006) • being bullied (Gastic, 2009)
• need to demonstrate ‘adult’ behaviour, rejection of authority (Moffit, 1993) • levels of attention in classes, lower levels of literacy and numeracy achievement
• students’ health and wellbeing; for example, low self-esteem, physical health (for example, long-term illness) including asthma (Moonie et al, 2008) or high levels of anxiety (Baker et al, 2001) • drug and alcohol use (Reid 2010)
Economic and cultural factors
• low socio-economic status (Attwood & Croll, 2006) • single parent families
• parents with multiple jobs
• the need for student employment to supplement family incomes • a lack of affordable transportation to school
• the lack of affordable child care for students with parenting responsibilities • higher family mobility rates
• cultural obligations; for example, Sorry Business or commitments by families to significant cultural celebrations, such as Chinese New Year.
Attendance may relate directly or indirectly by a range of school, family/home, individual student, economic and cultural factors
Schools have limited influence over some factors which may impact on attendance
Student views on reasons for their non-attendance
Given that poor attendance, particularly unauthorised absences, may indicate a trend in
disengagement from school, students’ views on attendance can potentially give unique insights into ways to improve school attendance. Students with low attendance rates report a range of reasons for this, including:
• poor relationships with teachers, including teaching that doesn’t match their expectations (White 2009)
• student perception of the classroom or teacher as disorganised or uncaring (Duckworth & DeJong, 1989; Roderick et al, 1997)
• a general dislike of the atmosphere of the school or a dislike of schoolwork (Reid, 2010)
• school programs seen by students as irrelevant, too difficult or too easy (Clement, Gwynne, and Younkin, 2001)
• preferring to be truant and deal with the consequences rather than attending school (Reid, 2010) • suspensions (Clement, Gwynne, and Younkin, 2001)
• feeling unsafe (Clement, Gwynne, and Younkin, 2001) • issues such as anxiety.
It is interesting that these studies found young people’s perceptions are related most to
characteristics of the school, rather than the other types of factors identified by Baker et al (2001).
Students’ views on their reasons for non-attendance are important for determining successful strategies to promote attendance
Evidence base on strategies to increase student attendance
International literature shows that strategies to encourage students to attend school range from the use of recognition and reward enticements, such as prizes, to fines or threats of imprisonment for parents or guardians of chronically truant students (Henderson, 1999). Collaborations with families to reduce absenteeism through home–school connections are also recognised as an important strategy to increase student attendance (Cimmarusti, James, Simpson, & Wright, 1984; Corville-Smith, Ryan, Adams, & Dalicandro, 1998; Epstein & Sheldon, 2002; Weinberg & Weinberg, 1992; Ziesemer, 1984). Strategies to improve student attendance are often used in combination with, or overlap, strategies to enhance behaviour, wellbeing or learning. While this combination of strategies reflects the reality of working with students, it does mean it can be difficult to measure the specific factors that are impacting directly on attendance rates, or determine exactly how much each factor is contributing to changes in attendance.
A search of ‘school attendance’ on the Educational Resources Information Centre (ERIC) website found almost 10,000 related publications. However, only a few measured and
reported on school programs (Corville-Smith, 1995; Epstein & Sheldon, 2002; Hendrickson 2010). The evidence base of successful programs for Indigenous students in Australia is also not strong (Purdie & Buckley 2010).
Gerrard, Burhans and Fair (2003) found only 28 articles that contained some research evidence of program effects although many of these were not peer-reviewed. They explored findings on studies with commonly used strategies to increase student attendance (see Table 7) and concluded that some evidence existed for certain strategies, but that overall it did not constitute a substantial body of evidence.
Table 6: Overview of the evidence for attendance strategies
Some evidence Inconclusive results No Evidence Not tested • Relationship-building • Contacting parents regarding absenteeism • Incentives for parental responsibility • Including parents in truancy prevention activities
• Strong and clear attendance policies • Family counselling • Intensive school interventions • Ongoing truancy prevention programs • School staff trained,
committed, and supported • Rewards and/or incentives for attendance • Peer group counselling • Probation officers devoted to truancy cases • Financial sanctions against families • Wearing school uniforms decreases absenteeism
• Publicising good attendance • Make-up work for absentees • Involving truants in
extracurricular activities • Creating a pleasant
classroom environment, classroom attendance reward system, and
individualising student work • Letters from the principal to
the parents
• Alternative scheduling • Attendance contracts • Individual, group and family
counselling
• Testing for learning problems • Home visits by school or
community staff
• Police sweeps of frequent neighbourhood hangouts • Media campaigns (Gerrard et al, 2003)
More recently Maynard, Tyson-McCrea, Pigott and Kelly (2011) reiterated concern about the lack of a strong evidence base related to attendance strategies. Of the extensive body of research literature on attendance, Maynard et al (2011) found only 62 studies that looked at program effectiveness, of which 33 met their required criteria for inclusion in a meta-analysis of intervention effects.
Maynard et al (2011) found some positive findings in their meta-analysis with an overall effect size of interventions of 0.47, that is, a moderate effect. Although some interventions demonstrated a moderate average effectiveness, the average absence rates after intervention for the majority of studies remained above 10%. Thus the improvement was still less than that required for schools to reach levels of regular attendance above 90%. This is sobering in terms of what schools are aiming to achieve and reflects the fact that school attendance is a marker for a range of complex social issues that students experience.
A wide variety of strategies to increase student attendance have been tried, however the evidence base for effective strategies is not strong
School attendance is a marker for a range of complex social issues
Strategies to increase student attendance
Walls (2003) noted that no one program or strategy will be suitable for every student and every school. Locally appropriate strategies, and possibly a combination of strategies, will be necessary to address the range of contributing factors in student attendance. Reardon (2008) categorised strategies to increase attendance as:
• connective or affective approaches: relational approaches that offer services (opportunities) to families and/or students or strengthen family–school relationships
• incentives or reward-based approaches: approaches that provide incentives or rewards for students to attend school
• sanctions or punitive approaches: approaches that punish the student/parent for school absences. Schools often adopt mixed connective and incentive approaches for all students as a universal
approach to attendance. Schools may also use other strategies less frequently, including integrated family support, prosecution of parents for non-attendance or providing alternative education programs for students with on-going non-attendance patterns. Strategies commonly used in schools to increase student attendance are listed in Table 7.
Table 7: Categories of school attendance strategies
Connective Incentives Sanctions
• Integration and coordination of services available to students and families
• Individual or family counselling , mentoring or case management21,22
• Individualised contracts that enable the student to express reasons for non-attendance
• Social marketing campaigns that promote the benefits of school attendance or raising awareness of the importance of attendance
• Using technology to alert parents to student non-attendance
• Data taxonomies to better understand attendance patterns23 • School attendance Improvement plans24 or attendance audits • Computerised attendance registration systems
• Support to families such as referral to community services for families to receive financial, social and occupational support • Increasing parental involvement in education by improving parent-teacher communication, use of translators, parental participation in classroom activities, home visits
• Assigning part grades based on attendance
• Exemption for final exams based on good attendance record
• Prizes for good attendance (for example, vouchers, pizza days)
• Privileges of a child’s choice
• No school no pool policy – reward access to local swimming pool based on school attendance
• Withholding grades or credit points
• Assigning a fail for assignments or tests held on a day a student is absent
• A student not being able to make up work/grades for being absent
• A student not being able to attend a school function or sport activity (for example, no school no play declarations administered by sporting organisations)
• On the spot fines for parents25
• Liaison with police to enforce truancy laws
• Policy action including prosecutions of parents for their child’s non-attendance
• Sanctions on parents (for example, withholding income support payments) 26,27
• No school no pool policy – students not allowed to swim during or after school based on attending28
Adapted from Reardon (2008)
21Youth Connections
22UK Fast Track to Attendance Strategy 23US Every School Day Counts 24Every Day Counts
25Antisocial Behaviour Act2003 (United Kingdom)
26The Improving School Enrolment and Attendance through Welfare Reform Measure (SEAM) 27Family Responsibilities Commission Act 2008
The National Centre for School Engagement (NCSE, 2007), found successful programs in improving school attendance are more likely to:
• be family focused
• have intensive case management
• consist of both sanctions for continued truancy and reward for improved attendance. DeSocio et al (2007) suggested that family engagement was enabled by:
• inviting parents to participate in developing a re-entry plan that addresses practical issues such as getting alarm clocks, accessing school transport or changing family routines • providing transport support for attending school meetings.
Students with persistent low attendance and their families often experience a myriad of barriers to school attendance, including poverty, lack of parental aspiration, lack of transport, poor physical health, and a lack of peer relationships with higher attending students (Baker et al., 2001). Hendricks et al (2010) suggest a collaborative, comprehensive intervention that involves the school, social service agencies, justice system and family can have a substantial positive impact on attendance, particularly for chronic non-attendance. Further information on selected attendance programs are described in Appendix 2.
Summary
The evidence base for identifying strategies effective in improving student attendance is not
particularly strong, although the evidence is building gradually. Given the demonstrated relationship between attendance and student outcomes, this is a concerning gap in the research literature. Much remains to be done to build this evidence base to support schools to choose and implement effective, sustainable strategies.
When schools develop programs of school, family, and community partnerships, they have higher levels of parent involvement, higher student attendance rates, higher percentages of students pass standardised achievement tests, and schools take fewer disciplinary actions with students (Desimone, Finn-Stevenson, & Henrich, 2000; Epstein, 2001; Sheldon, 2003a; Sheldon, 2003b; Sheldon & Epstein, 2002; Sheldon & Van Voorhis, 2004).
As numerous authors have commented, no single program will accommodate the needs of every student, school and community. Schools and communities need to work together to select an approach suitable to their own context. Successful schools have implemented a range of strategies, including connective and reward approaches for all students, and specific individualised responses for some students.
6. Queensland state schools context
Every Day Counts is a state-wide initiative addressing student attendance at school. The initiative is designed to change parent, community and student attitudes to school attendance. It requires the support of parents and the community to maximise student attendance.
Every Day Counts promotes four key messages:
• all children should be enrolled at school and attend on every school day
• schools should monitor, communicate and implement strategies to improve regular school attendance
• truanting can place a student in unsafe situations and impact on their future employability and life choices
• attendance at school is the responsibility of everyone in the community. Materials for schools including fact sheets for parents and case studies are available at
http://education.qld.gov.au/everydaycounts/.
The following section provides an overview of promising practices in Queensland state schools with impressive improvements in student attendance.
7. PROMISING PRACTICES IN QUEENSLAND STATE
SCHOOLS
Maximising student attendance is a key aim for all schools. Various strategies have been adopted at the state and school levels and examining the strategies of schools that have improved student attendance can highlight important insights for others. This section reports on strategies and experiences of schools in Queensland.
Identifying schools with improvements in attendance
The ten Queensland state schools with the largest attendance gains between 2007 and 2011 were identified to examine approaches employed by those schools. These schools are listed in Table 8 and provided the basis of case study work.
Table 8: Schools (with more than 100 students) with largest attendance gain29
Host centre name Attendance rate gain
2007-2011
(percentage points) Spinifex State College – Mt Isa Education
and Training Precinct
9.2
Woodridge State High School 6.7
Mabel Park State High School 6.1
Kingston College 5.9
Cunnamulla State School 5.2
Western Cape College 4.7
Glenala State High School 4.0
Mornington Island State School 4.0
Merrimac State High School 3.7
Charters Towers State High School 3.4
Investigating school-based practices and programs
On-site interviews were conducted with principals and staff to help identify reasons their school’s attendance rates had improved. The interviews collected information on successful innovations or interventions the schools had put in place to improve student attendance.
Schools were asked to provide information on the sorts of strategies in place to increase student attendance, particularly strategies they had also found successful in improving learning outcomes. The semi-structured interview schedule used is at Appendix 3.
29
Gain is calculated by comparing 2011 to 2007 attendance rates. Excluding Youth Education and Training Centres and Schools of Distance Education
Case Study 1: Woodridge State High School
Student attendance at Woodridge State High School improved by 4.8 percentage points between 2007 and 2010, with an improvement in the attendance rate of over seven percentage points between 2008 and 2010.
A dedicated Student Attendance Team (the ‘A Team’) is central to Woodridge State High School’s improvement. The ‘A Team’ developed protocols for intervention when students are absent including:
• parents of students with two days unexplained absence from school receive a telephone call from the ‘A Team’ Leader
• parents of students with four days unexplained absence from school receive a home visit from the ‘A Team’ Leader
• action planning and weekly reviews for every student with low attendance rates.
Students with persistent low attendance are monitored at a weekly ‘A Team’ meeting and strategies considered to increase their attendance and/or engage them in a suitable continuing education program. Wireless internet in the school has enabled teachers to efficiently record student attendance in real time. Daily reports on student attendance and weekly ‘A Team’ meetings mean proactive follow-up of student absences.
Central to the success of Woodridge State High School has been the Logan Community Attendance Team. This initiative involves strong partnerships with local business that refuse to serve children of school age during school hours and local residents who telephone the school if they see students truanting. Community Elders and the Queensland Police Service (QPS) are also involved.
The ‘A Team’ works with parents to help raise expectations, create routines and provide basic needs. Support provided to families includes referrals to employment assistance, welfare or mental health services.
Woodridge State High School utilises an incentive scheme by rewarding students with high attendance rates with certificates presented at school assemblies. Other strategies employed by the school include:
• lunchtime programs
• one on one sessions for students requiring more intensive support
• ‘Knowing Your Student’ is a central theme to the Woodridge State High School approach to personalised learning
• professional development including coaching and mentoring for all leadership staff in 2010 and all teaching staff in 2010.
Principal John Norfolk said: ‘Having the students attend school regularly is the beginning of a partnership and commitment from the school to ultimately deliver further education, training or employment.’
Case Study 2: Mabel Park State High School
The Mabel Park State High School student attendance rate improved by 5.6 percentage
points between 2007 and 2010 and by 11.2 percentage points between 2009 and 2010. The school’s success was grounded on a systematic approach to attendance combined with a focus on pedagogy.
Systems
• accurate and timely recording of student absences
• training scenarios for staff on coding the reasons for student absences more accurately • clarification of roles and responsibilities for attendance between students, staff and parents • use of SMS and email to notify parents of student absences
• weekly reports to all school staff on the attendance rates for all year levels and classes • monitoring and review of attendance patterns (especially unexplained and unauthorised
absences)
• the attendance officer and deputy principal meet regularly to discuss the coordination of responses to student absences.
Spotlighting attendance – making student attendance a ‘big deal’
• consistent messages to the whole school community at school assemblies, in school newsletters and at staff meetings that missing school is a ‘big deal’
• setting a public attendance target of 95% for all students
• taking a ‘no-tolerance’ approach to unexplained absence by setting a zero unexplained absence target for every student
• educating parents and carers to understand their legal obligation to ensure their child attends school
• encouraging parents not to condone absences for reasons such as shopping, birthdays or to look after siblings
• offering support to parents if their child refuses to attend school
• involving students in calculating their own attendance rate every month
• using rewards for students including “Excellent Attendance” certificates and letters to parents about student effort and achievement
• introducing an incentive program where students achieving at least 95% attendance are eligible to enter a draw for vouchers.
Improving pedagogy across the whole school
Mabel Park State High School has adopted an instructional model that focuses on high-quality teaching and learning, reviewing performance targets every five weeks and a staff coaching model. These seem to have contributed to improved behaviour and contributed to better attendance. The school no longer uses a ‘withdrawal room’ to manage student behaviour.
During the interview, Principal Mike O’Connor summed up the importance of good student attendance: “We can’t improve student learning outcomes if our students don’t attend.”