Journal of Sports Medicine and Allied Health Sciences: Official
Journal of Sports Medicine and Allied Health Sciences: Official
Journal of the Ohio Athletic Trainers Association
Journal of the Ohio Athletic Trainers Association
Volume 5
Issue 2 JSMAHS Fall Issue 2019 Article 2
July 2019
Health Behaviors of Athletic Trainers
Health Behaviors of Athletic Trainers
Zachary K. Winkelmann
University of South Carolina, winkelz@mailbox.sc.edu Maura E. Shea
Indiana State University, maura.shea@indstate.edu Kelcey C. Granger
Indiana State University, kgranger@sycamores.indstate.edu Lindsey E. Eberman
Indiana State University, lindsey.eberman@indstate.edu Kenneth E. Games
Indiana State University, kenneth.games@indstate.edu
Follow this and additional works at: https://scholarworks.bgsu.edu/jsmahs
Part of the Exercise Science Commons, Other Kinesiology Commons, Sports Medicine Commons, and the Sports Sciences Commons
Recommended Citation Recommended Citation
Winkelmann, Zachary K.; Shea, Maura E.; Granger, Kelcey C.; Eberman, Lindsey E.; and Games, Kenneth E. (2019) "Health Behaviors of Athletic Trainers," Journal of Sports Medicine and Allied Health Sciences: Official Journal of the Ohio Athletic Trainers Association: Vol. 5 : Iss. 2 , Article 2.
DOI: 10.25035/jsmahs.05.02.02
Available at: https://scholarworks.bgsu.edu/jsmahs/vol5/iss2/2
This Article is brought to you for free and open access by the Journals at ScholarWorks@BGSU. It has been accepted for inclusion in Journal of Sports Medicine and Allied Health Sciences: Official Journal of the Ohio Athletic Trainers Association by an authorized editor of ScholarWorks@BGSU.
Journal of Sports Medicine and Allied Health Science | Vol. 5 | Issue. 2 | Fall 2019
Health Behaviors of Athletic Trainers
Zachary K. Winkelmann, PhD, SCAT, ATC €; Maura E. Shea, DAT, LATC, ATC*; Kelcey C. Granger, MS,
LAT, ATC*; Lindsey E. Eberman, PhD, LAT, ATC*; Kenneth E. Games, PhD, LAT, ATC*
€University of South Carolina; *Indiana State University
Purpose: Health behaviors, such as diet, tobacco, and physical activity, may serve to prevent disease and promote wellness throughout the population including athletic trainers (AT). Good health behaviors act as disease prevention measures to decrease prevalence of pathologies. Hours of sleep, substance use, nutritional intake, and physical activity are behaviors that may impact the health of athletic trainers (AT). The objective of the study was to describe health behaviors of ATs in comparison to the general population and recommended behaviors. Method: We used a cross-sectional, web-based survey of clinically practicing ATs recruited from the National Athletic Trainers’ Association member database. A total of 1,229 ATs completed the web-based survey. The survey contained the Healthy Eating Vital Sign (HEVS) Questionnaire with physical activity items and Center for Disease Control Annual Consensus Survey. We calculated statistics of central tendency (means, frequency, and mode) to describe the characteristics of the athletic training population represented by our sample. The main outcome measures were hours of sleep, frequency of alcohol consumption and number of drinks consumed while drinking, weekly consumption of fast food, daily consumption of vegetables, daily servings of caffeine, smoking behavior in the last month, and exercise in the last day and week. Results: We found that the majority of ATs sleep 5-8 hours per night. From the sample, 66.2% of ATs reported eating fast food at least one time per week, while 95.7% ate vegetables at least one time per day. Only 1.9% of ATs reported smoking a cigarette in the last 30 days as compared to the national average of 15.5%. Finally, 50% of ATs performed physical activity on three or more occurrences per week. ATs most frequently report drinking alcohol weekly with an average of three alcohol beverages per sitting. Conclusion(s): Overall, the health of ATs is similar to the general population except ATs consume fast food more frequently and fewer athletic trainers smoke compared to the general population. Despite ATs base knowledge, many ATs do not engage in at the recommended health behaviors and may place themselves at the increased risk of poorer health and chronic disease. Key Words:nutrition, sleep, substance abuse, physical activity
_________________________________________________________________________________________________
INTRODUCTION
Health behaviors are actions directed at improving and sustaining good health as it relates to disease prevention.1,2 While good
habits can act as deterrents to health issues, poor habits can be detrimental to one’s health.2 Sleep, fitness, and nutrition (both diet
and hydration) are the triad of human performance and directly influence the most critical health behaviors related to well-being.3 The health behaviors of other medical
professions, such as nurses and physicians, have been previously examined.4,5 In regards
to substance use, 25% of registered nurses were classified as having an alcohol abuse
disorder and 17% reported smoking.4
Additionally, 34% of physicians reported sleeping less than 6 hours per day and over 35% stated they never exercised.5 Many
healthcare providers exhibit behaviors that may increase their risk for poor health, despite their extensive knowledge of optimal health behaviors.4,5
When exploring the available literature related to health behaviors in athletic trainers (ATs), we can identify that ATs are meeting or exceeding the general population norms but not meeting the recommended health
1 Published by ScholarWorks@BGSU, 2019
behaviors.6 This was evidenced through
alcohol and tobacco use in which ATs consumed these less often than the general population but were not meeting the dietary reference intake in this area.6 Additionally, no
ATs were meeting the recommended health behaviors related to nutritional intake of the five food groups.6 Unfortunately, this data has
not been revisited in 10 years after it was collected in a small sample of ATs.6 Therefore,
the purpose of this study was to describe the health behaviors, specifically substance use, sleep, nutrition, and physical activity, of ATs with comparisons to the general population and recommended behaviors.
METHODS
Study Design and Participants
A random sample of ATs (n=10,911) practicing clinically in various settings were
recruited from the National Athletic Trainers’ Association (NATA) membership database to complete this cross-sectional, web-based survey. Two-thousand and twenty ATs opened the survey (access rate=2,020/10,911, 18.5%). Many (n=602) responses were excluded from the study due to eligibility (not practicing clinically=591, wished not to participate=11). The sample (n=1,229, age=34±10 years, years credentialed=11±9 years) ,was representative of the athletic training profession (sex, age, highest degree, job setting) when compared to data published by the NATA in October 2017,7
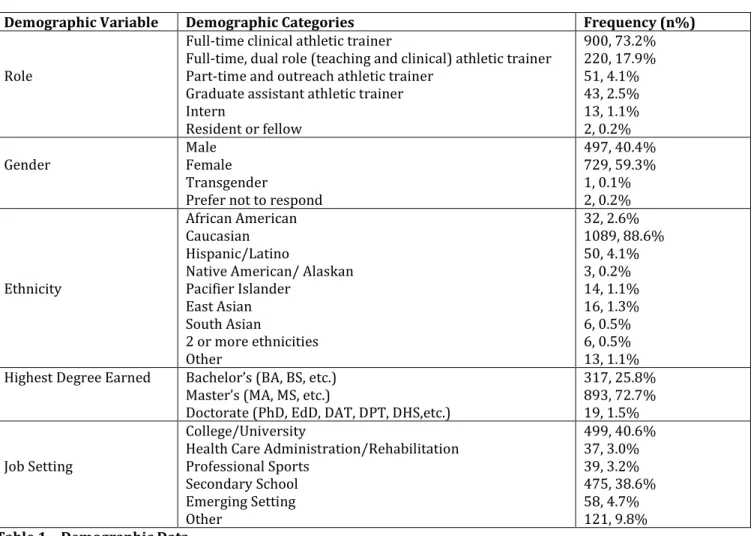
completed the tool in its entirety (completion rate=84.8%) and were included in the data analysis. Table 1 provides demographic data of the participants. The Indiana State University Institutional Review Board approved this study.
Demographic Variable Demographic Categories Frequency (n%) Role
Full-time clinical athletic trainer
Full-time, dual role (teaching and clinical) athletic trainer Part-time and outreach athletic trainer
Graduate assistant athletic trainer Intern Resident or fellow 900, 73.2% 220, 17.9% 51, 4.1% 43, 2.5% 13, 1.1% 2, 0.2%
Gender Male Female
Transgender
Prefer not to respond
497, 40.4% 729, 59.3% 1, 0.1% 2, 0.2% Ethnicity African American Caucasian Hispanic/Latino
Native American/ Alaskan Pacifier Islander East Asian South Asian 2 or more ethnicities Other 32, 2.6% 1089, 88.6% 50, 4.1% 3, 0.2% 14, 1.1% 16, 1.3% 6, 0.5% 6, 0.5% 13, 1.1%
Highest Degree Earned Bachelor’s (BA, BS, etc.)
Master’s (MA, MS, etc.)
Doctorate (PhD, EdD, DAT, DPT, DHS,etc.)
317, 25.8% 893, 72.7% 19, 1.5% Job Setting
College/University
Health Care Administration/Rehabilitation Professional Sports Secondary School Emerging Setting Other 499, 40.6% 37, 3.0% 39, 3.2% 475, 38.6% 58, 4.7% 121, 9.8% Table 1 – Demographic Data
Journal of Sports Medicine and Allied Health Science | Vol. 5 | Issue. 2 | Fall 2019
Instrumentation
The instrument for this study included 24 questions; 5 questions related to demographics and 19 related to health behaviors. The health behaviors included the Healthy Eating Vital Sign (HEVS) tool, as well as selected items from the Center for Disease Control National Health Interview Survey (CDC-NHIS) health behaviors section.8,9
The CDC-NHIS tool was created to encompass a range of behaviors and the current health status across the United States of America as a means of tracking the overall health of the country.8,10 The CDC-NHIS tool does not
undergo validation testing, however the questions selected from the tool for the survey are all considered “core questions,” which remain on the instrument for a minimum of ten years to collect public health behavior information for the government.10,11 Five
questions were selected pertaining to adult health behaviors in the areas of sleep and substance use.
The HEVS questionnaire consisted of 14 items.9 The first 13 items asked participants to
report their frequency to engage in the target behavior (nutritional considerations and physical activity) in the respective recall period with one additional item related to meal completion.9 The HEVS has been
validated against the Block Food Frequency Questionnaire by individual item, with the majority of items having moderate criterion validity.9
Procedures
A web-based survey platform (Qualtrics, Inc., Provo, UT) distributed the tool via an initial e-mail sent September 5, 2017 with three reminder e-mails sent weekly and the survey closing October 6, 2017. Following the electronic informed consent, the participants entered the survey to provide demographic variables and reflect on their health behaviors via the CDC-NHIS and HEVS.
Statistical Analysis
The investigators transferred the data to a custom spreadsheet application. The statistical analysis excluded incomplete responses. A frequency count was calculated for each nominal and ordinal variable upon the interval (e.g. Likert scale, categorical options) at which the data were collected. The investigators analyzed the data using SPSS (SPSS, Version 24.0. Armonk, NY: IBM Corp). RESULTS
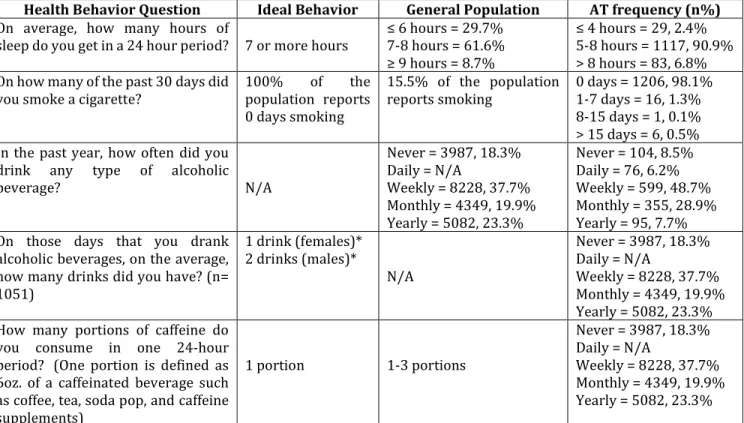
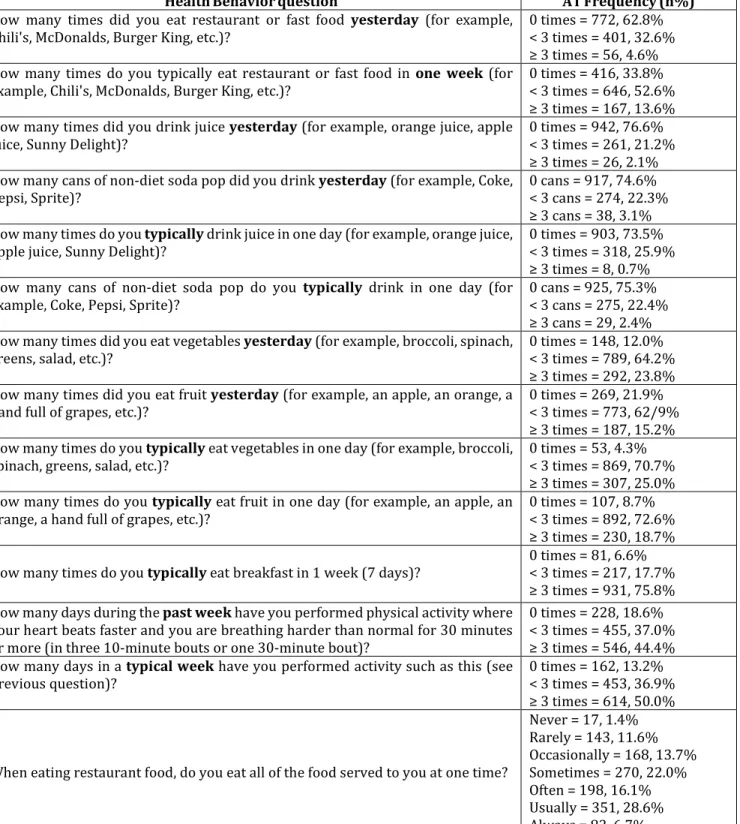
For the majority of health behaviors, ATs generally reported similar health behaviors as the general population.The exceptions to this are a higher amount of alcohol beverages per sitting and a lower frequency of cigarette smoking for the AT population compared to the general population. Tables 2 and 3 provide complete data from the sample on the CDC-NHIS and the HEVS tool, respectively.
DISCUSSION
Although it was found that ATs did not meet all the recommended health behaviors, the findings were consistent with that of other healthcare providers12,13 The health
behaviors examined in this study are within the scope of athletic training practice through the injury and illness prevention and wellness domain. As such, the behaviors are ones that ATs have the knowledge and skills of at a higher level than the general population.12
While ATs met the recommendations for tobacco use, they exceeded the recommended behaviors related to weekly alcohol and fast-food intake.
The CDC-NHIS Data on Alcohol, Smoking, Caffeine, Sleep
When exploring the frequency of drinking alcohol in the past year, more ATs were drinking weekly or monthly as compared to the general population. The general population reported higher percentages either never/no drinking or yearly drinking.14
Additionally, the ATs that were consuming alcohol above the recommended “moderate drinking” amount set by the dietary reference
3 Published by ScholarWorks@BGSU, 2019
index.15 The quantity of alcoholic beverages
that the majority of ATs report consuming on a weekly basis may predispose them to short- and long-term risks to their social, physical (high blood pressure and injury), and
emotional (alcoholism, depression, anxiety) wellness.16 These findings are comparable to
the trend in the general population and ATs, in which male ATs were consuming more alcoholic
Health Behavior Question Ideal Behavior General Population AT frequency (n%) On average, how many hours of
sleep do you get in a 24 hour period? 7 or more hours ≤ 6 hours = 29.7%7-8 hours = 61.6%
≥ 9 hours = 8.7%
≤ 4 hours = 29, 2.4%
5-8 hours = 1117, 90.9% > 8 hours = 83, 6.8% On how many of the past 30 days did
you smoke a cigarette? 100% of the population reports
0 days smoking
15.5% of the population
reports smoking 0 days = 1206, 98.1% 1-7 days = 16, 1.3% 8-15 days = 1, 0.1% > 15 days = 6, 0.5% In the past year, how often did you
drink any type of alcoholic
beverage? N/A Never = 3987, 18.3% Daily = N/A Weekly = 8228, 37.7% Monthly = 4349, 19.9% Yearly = 5082, 23.3% Never = 104, 8.5% Daily = 76, 6.2% Weekly = 599, 48.7% Monthly = 355, 28.9% Yearly = 95, 7.7% On those days that you drank
alcoholic beverages, on the average, how many drinks did you have? (n= 1051) 1 drink (females)* 2 drinks (males)* N/A Never = 3987, 18.3% Daily = N/A Weekly = 8228, 37.7% Monthly = 4349, 19.9% Yearly = 5082, 23.3% How many portions of caffeine do
you consume in one 24-hour period? (One portion is defined as 6oz. of a caffeinated beverage such as coffee, tea, soda pop, and caffeine supplements) 1 portion 1-3 portions Never = 3987, 18.3% Daily = N/A Weekly = 8228, 37.7% Monthly = 4349, 19.9% Yearly = 5082, 23.3% Table 2 – Reported Behaviors of the CDC-NHIS for Athletic Trainers compared to the General Population and Ideal Behaviors13,14,15,16,29,
* = for moderate level consumption
beverages per sitting (mean=3 drinks) compared to their female AT counterparts (mean=2 drinks).6 Excessive drinking is
indicative of problematic behavior that has not changed over the ten years since the previous study was completed examining these health behaviors.6
The national goal for cigarette smoking is complete cessation.17 ATs are closer to
meeting this goal as compared to the general population with 8 times more people in the general population smoking cigarettes as compared to ATs.18 While cigarette smoking
cessation has continued to improve in the United States,18 there is a need to explore the
self-reported frequency of alternative delivery products, such as smokeless tobacco and electronic cigarettes, emerging in the market.19 The Affordable Care Act states that
health insurance providers should cover at least two attempts of tobacco cessation per year to be compliant with the preventive services provisions.17 The profession of
athletic training must be aware of the resources provided to us from our employers and third-party insurers to utilize the health care benefits afforded to each of us from employment. As ATs have reported long work hours and typically practice in an educational or clinical setting, one possibility for the discrepancy in smoking frequency could be the restriction on the ability to smoke on-site at their job, which has been cited as a deterrent in previous studies.20,21
Caffeine intake can come in several forms such as coffee, soda, and tea.22 While the
recommendation is one portion (6 ounces) of caffeine in a 24-hour period, consumption of a
Journal of Sports Medicine and Allied Health Science | Vol. 5 | Issue. 2 | Fall 2019
HealthBehaviorquestion ATFrequency(n%)
How many times did you eat restaurant or fast food yesterday (for example,
Chili's, McDonalds, Burger King, etc.)? 0 times = 772, 62.8% < 3 times = 401, 32.6%
≥ 3 times = 56, 4.6%
How many times do you typically eat restaurant or fast food in one week (for
example, Chili's, McDonalds, Burger King, etc.)? 0 times = 416, 33.8% < 3 times = 646, 52.6%
≥ 3 times = 167, 13.6%
How many times did you drink juice yesterday (for example, orange juice, apple
juice, Sunny Delight)? 0 times = 942, 76.6% < 3 times = 261, 21.2%
≥ 3 times = 26, 2.1%
How many cans of non-diet soda pop did you drink yesterday (for example, Coke,
Pepsi, Sprite)? 0 cans = 917, 74.6% < 3 cans = 274, 22.3%
≥ 3 cans = 38, 3.1%
How many times do you typically drink juice in one day (for example, orange juice,
apple juice, Sunny Delight)? 0 times = 903, 73.5% < 3 times = 318, 25.9%
≥ 3 times = 8, 0.7%
How many cans of non-diet soda pop do you typically drink in one day (for
example, Coke, Pepsi, Sprite)? 0 cans = 925, 75.3% < 3 cans = 275, 22.4%
≥ 3 cans = 29, 2.4%
How many times did you eat vegetables yesterday (for example, broccoli, spinach,
greens, salad, etc.)? 0 times = 148, 12.0% < 3 times = 789, 64.2%
≥ 3 times = 292, 23.8%
How many times did you eat fruit yesterday (for example, an apple, an orange, a
hand full of grapes, etc.)? 0 times = 269, 21.9% < 3 times = 773, 62/9%
≥ 3 times = 187, 15.2%
How many times do you typically eat vegetables in one day (for example, broccoli,
spinach, greens, salad, etc.)? 0 times = 53, 4.3% < 3 times = 869, 70.7%
≥ 3 times = 307, 25.0%
How many times do you typically eat fruit in one day (for example, an apple, an
orange, a hand full of grapes, etc.)? 0 times = 107, 8.7% < 3 times = 892, 72.6%
≥ 3 times = 230, 18.7%
How many times do you typically eat breakfast in 1 week (7 days)? 0 times = 81, 6.6% < 3 times = 217, 17.7%
≥ 3 times = 931, 75.8%
How many days during the past week have you performed physical activity where
your heart beats faster and you are breathing harder than normal for 30 minutes or more (in three 10-minute bouts or one 30-minute bout)?
0 times = 228, 18.6% < 3 times = 455, 37.0%
≥ 3 times = 546, 44.4%
How many days in a typical week have you performed activity such as this (see
previous question)? 0 times = 162, 13.2% < 3 times = 453, 36.9%
≥ 3 times = 614, 50.0%
When eating restaurant food, do you eat all of the food served to you at one time?
Never = 17, 1.4% Rarely = 143, 11.6% Occasionally = 168, 13.7% Sometimes = 270, 22.0% Often = 198, 16.1% Usually = 351, 28.6% Always = 82, 6.7% Table 3 – Reported Behaviors of the HEVS for Athletic Trainers7
typical 12 to 16 ounce beverage automatically doubles the caffeine portion. Although each beverage has a different caffeine count, the safety of caffeine only becomes worrisome after 400 mg, or the equivalent of consuming of two tall black coffees.23,24 One fifth (21%) of
the ATs in this study reported consuming 18 ounces or more of caffeine per day which is concerning to their overall health as excessive caffeine consumption leads to chronic illness such as sleep problems.25 Sleep problems in
healthcare have led to medical errors in the
5 Published by ScholarWorks@BGSU, 2019
workplace.26 The nature of the job may
contribute to this excessive intake. Athletic trainers often have work hours that fluctuate, or work several per diem jobs to subsidize their income.
As such, the irregularity of work hours may contribute to this negative health behavior. It is important to consider the timing of this study (mid-season in the fall), which is one of the busiest times for ATs in traditional interscholastic sport settings, that may have influenced caffeine intake.
Adequate sleep has been known to increase workplace productivity,26,27 whereas
inadequate sleep (less than 7 hours in a 24-hour period) increases the risk of health comorbidities including high blood pressure and obesity.28,29 Additionally, poor sleeping
behaviors can impair reaction time and cause irritability.30,31 Based on previous research in
other healthcare professions, it was hypothesized that ATs do not meet the recommendation for sleep;5 however, ATs
self-reported to sleep similar amounts as the general population. It is important to note that 91% of the participants noted sleeping 5-8 hours, yet the categorical options from the survey (≤ 4 hours, 5-8 hours, > 8 hours) has made it difficult for us to further discern what percentage of the sample slept 5-7 hours versus 7-8 hours to best understand how many ATs were failing to meet the recommended behavior of more than 7 hours of sleep set by the American Academy of Sleep Medicine.32 Regardless, ATs need to explore
ways to gain additional hours of sleep if they fall below the recommended seven hours of sleep per night. Some potential solutions for ATs to better sleep quality align well with current habits that are being promoted in the profession including adoption of the medical model of healthcare delivery that includes creating an appointment-based scheduling system for daily patient care, ensuring that sporting event schedule changes are communicated at least 24 hours in advance, and promoting a “do not disturb” time.33
The HEVS Data on Food and Drink Intake
Over one third of the ATs in this study reported restaurant and fast food intake the day prior to the study, with 66% of ATs reporting one or more times of weekly restaurant and fast food consumption. Previous research has identified those individuals who consume fast food more than twice a week gained 8-17 pounds of bodyweight as compared to those with infrequent fast food intake.34 While excessive
bodyweight does not directly correlate to obesity, previous research stated that overweight workers face hiring discrimination.35,36 As we seek to describe and
improve the health behaviors in the professions, ATs should consider the long-term consequences of their professional livelihood reflective of a short-term decision related to restaurant/fast food consumption. It is important to consider the source of fast food for the practicing clinician. Due to the busy schedule in traditional athletic training settings, the nature of the job sometimes requires meals on the go potentially provided by their employer or selected due to time. One avenue to curb the high fast food intake behavior is to speak with stakeholders and employers that provide meals to ATs to consider healthier options outside of the traditional concession stand or “meal on the go” choice.
Although we identified frequent fast food intake, we did identify that ATs do make healthy selection when they are able to make their choice. The current daily recommended intake is 2 to 3 cups of vegetable (e.g. two cups of spinach) and 1.5 to 2 cups of fruit (e.g. two apples) per day.15 Vegetable and fruit intake
was reported at least one time per day in over 90% of the ATs in this study. We hypothesize that vegetable and fruit intake is likely occurring as snacks options during the workday to meet the dietary intake. Previous research has proposed that a healthy lifestyle may be a factor that influences work-life imbalance, specifically in athletic training.37-40
Journal of Sports Medicine and Allied Health Science | Vol. 5 | Issue. 2 | Fall 2019
ATs should consider tracking their nutritional intake per day to improve both physical and mental performance necessary for the job as a way to mediate unhealthy behaviors.39,41 One
method of tracking or preparing is meal preparation. Meal preparation is the process of planning and pre-cooking meals. Due to the busy schedule, ATs may consider this method of nutritional intake to sustain their caloric needs while being mindful of healthier selections in the workday.
Physical Activity
Previous research in the exercise habits of ATs is variable.12,42,43 Most recently, ATs and
athletic training students both cited a lack of time as a contributing factor to a lack of physical activity.42,43 In this study, 50% of ATs
in a typical workweek were meeting the physical activity recommendation of 30 minutes of vigorous exercise at least three times per week. Similar to previous literature, ATs possess the knowledge related to physical activity, yet the modeling of positive health behavior is not occurring across the profession.12 The previously referenced data
on athletic training students is particularly interesting as compared to the current research findings as a negative role modeling behavior may be occurring during clinical education. For example, if an athletic trainer that serves as a preceptor is exhibiting and partaking in negative health behaviors, the athletic training student may replicate these behaviors as part of their anticipatory socialization into the field. Interestingly, while the health benefits of physical activity related to blood pressure and mental health are well established in the literature, an individual’s psychological stress may deter physical activity in the same manner as that stress negatively influences substance use.44,45 As
the profession of athletic training has cited high levels of job-related stress, positive healthy lifestyle behaviors may serve as a way to address burnout in ATs.33 Not only do ATs
need to be able to respond to an emergent situation, but we are also role models for an already physically active population. Time
management and perceived physical demands of work may also be factors related to the frequency of physical activity in ATs.
LIMITATIONS AND FUTURE RESEARCH
This study suffered threats to external validity. The study was retrospective and self-reported in nature, which may have affected the recall over different periods. In addition, the participants may have felt a pressure to normalize their answers rather than honestly reporting to adhere to norms. Due to the lack of control of their time, travel, and inconsistency of work hours, all factors may contribute to AT’s inconsistent health behaviors. The potential lack of time may also contribute to a lack of sleep, increased fast food intake, and lack of physical activity that may manifest into other health issues later in life. Future research and revisions to this study should focus on controlling the threats to external validity; doing so will help validate the cause and prioritization of health behaviors, as well as implementation of strategies for improving health behaviors in ATs such as the role of sleep in athletic training clinical performance.
CONCLUSION
The results shed light on the opportunities to improve the health behaviors of ATs. While ATs possess the base knowledge regarding a healthy lifestyle, they should be mindful of how their personal health behaviors may be influencing their professional satisfaction. This sample of ATs reported better health behaviors related to food and vegetable intake and smoking than the general population, yet failed to meet the recommended behaviors established by national health organizations. The behaviors that failed to meet the recommended behavior standard and were less than the general population included in fast food/restaurant intake and frequency of alcohol consumption. Similar to previous findings in healthcare professions, not all ATs report practicing the principles of healthy living despite knowing the benefits as it relates to injury and illness prevention and
7 Published by ScholarWorks@BGSU, 2019
promotion. Not only could these behaviors lead to physical and mental stress, it can affect patient rapport and future clinician practice. REFERENCES
1. Pate RR, Pratt M, Blair SN, et al. Physical activity and
public health: a recommendation from the Centers for Disease Control and Prevention and the American College of Sports Medicine. Jama. 1995;273(5):402-407. https://doi.org/10.1001/jama.273.5.402
2. McGinnis JM, Foege WH. Actual causes of death in the
United States. Jama. 1993;270(18):2207-2212. https://doi.org/10.1001/jama.1993.0351018007703 8
3. Lentino CV, Purvis DL, Murphy KJ, Deuster PA. Sleep as
a component of the performance triad: the importance of sleep in a military population. US Army Medical
Department Journal. 2013. https://doi.org/10.1016/j.chest.2018.08.1061
4. Bakhshi S, Sun F, Murrells T, While A. Nurses' health
behaviours and physical activity-related health-promotion practices. Br J Community Nurs. 2015;20(6):289-296.
https://doi.org/10.12968/bjcn.2015.20.6.289
5. Bazargan M, Makar M, Bazargan-Hejazi S, Ani C, Wolf
KE. Preventive, lifestyle, and personal health behaviors among physicians. Acad Psychiatr. 2009;33(4):289-295. http://doi.org/10.12968/bjcn.2015.20.6.289
6. Groth JJ, Ayers SF, Miller MG, Arbogast WD.
Self-reported health and fitness habits of certified athletic trainers. J Athl.Train..2008;43(6):617-623. http://dx.doi.org/10.4085/1062-6050-48.2.07
7. National Athletic Trainers' Association. Membership
Demographic Data - October 2017.
https://members.nata.org/members1/documents/me mbstats/2017-10.htm. Accessed May 3, 2018.
8. Schoenborn C, Adams P. Health behaviors of adults:
United States, 2005-2007. Vital Health Stat. 2010;10(245).
9. Greenwood JL, Lin J, Arguello D, Ball T, Shaw JM.
Healthy eating vital sign: a new assessment tool for eating behaviors. ISRN obesity. 2012;2012. http://dx.doi.org/10.5402/2012/734682
10. Canfield B, Miller K, Beatty P, Whitaker K, Calvillo A,
Wilson B. Adult questions on the health interview survey–Results of cognitive testing interviews conducted April-May 2003. Hyattsville, MD: National Center for Health Statistics, Cognitive Methods Staff
Downloaded from: http://wwwncdc gov/QBANK/report%
5CCanfield_NCHS_2003AdultNHI SReport pdf. 2003.
11. Centers for Disease Control and Prevention. National
Health.Interview.Survey.https://www.cdc.gov/nchs/d ata/nhis/brochure2010January.pdf.
12. Cuppett M, Latin RW. A survey of physical activity levels of certified athletic trainers. J Athl Train. 2002;37(3):281.
13. Helfand BK, Mukamal KJ. Healthcare and lifestyle
practices of healthcare workers: do healthcare workers practice what they preach? JAMA internal medicine.
2013;173(3):242-244. DOI: 10.1001/2013.jamainternmed.1039
14. Centers for Disease Control and Prevention. 2017
National Health Interview Survey Sample Adult Public Use..File.2018;ftp://ftp.cdc.gov/pub/Health_Statistics /NCHS/Dataset_Documentation/NHIS/2017/samadul t_freq.pdf. Accessed October 5, 2018.
15. US Department of Health Human Services. Dietary
guidelines for Americans 2015-2020. 2017; https://health.gov/dietaryguidelines/2015/resources /2015-2020_Dietary_Guidelines.pdf.
16. World Health Organization. Global status report on
alcohol and health, 2014. World Health Organization; 2014.
17. US Department of Health and Human Services. The
health consequences of smoking—50 years of progress: a report of the Surgeon General. Atlanta, GA: US Department of Health and Human Services, Centers for Disease Control and Prevention, National Center for Chronic Disease Prevention and Health Promotion, Office on Smoking and Health. 2014;17.
18. Jamal A, Phillips E, Gentzke AS, et al. Current cigarette smoking among adults—United States, 2016. Morbidity and Mortality Weekly Report. 2018;67(2):53. http://dx.doi.org/10.15585/mmwr.mm6702a1
19. Glasser AM, Collins L, Pearson JL, et al. Overview of
electronic nicotine delivery systems: a systematic review. Am J Prev Med. 2017;52(2):e33-e66. https://doi.org/10.1016/j.amepre.2016.10.036
20. Naugle KE, Behar-Horenstein LS, Dodd VJ, Tillman MD,
Borsa PA. Perceptions of wellness and burnout among certified athletic trainers: sex differences. J Athl Train. 2013;48(3):424-430. https://doi.org/10.4085/1062-6050-48.2.07
21. Wilson N, Oliver J, Thomson G. Ten years of a national
law covering smoke-free school grounds: a brief review. Tob Control. 2016;25(1):122-122. http://dx.doi.org/10.1136/tobaccocontrol-2014-052127
22. Frary CD, Johnson RK, Wang MQ. Food sources and
intakes of caffeine in the diets of persons in the United States. J Am Diet Assoc. 2005;105(1):110-113.
23. Starbucks. Pike Place® Roast Nutrition Facts. 2018;
https://www.starbucks.com/menu/drinks/brewed-coffee/pike-place-roast#size=2. Accessed October 6, 2018.
24. Higdon JV, Frei B. Coffee and health: a review of recent
human research. Crit Rev Food Sci Nutr. 2006;46(2):101-123.
https://doi.org/10.1080/10408390500400009
25. Roehrs T, Roth T. Caffeine: sleep and daytime
sleepiness. Sleep Med Rev. 2008;12(2):153-162. https://doi.org/10.1016/j.smrv.2007.07.004
26. Rosekind MR, Gregory KB, Mallis MM, Brandt SL, Seal B,
Lerner D. The cost of poor sleep: workplace productivity loss and associated costs. J Occup Environ
Journal of Sports Medicine and Allied Health Science | Vol. 5 | Issue. 2 | Fall 2019 Med. 2010;52(1):91-98.
10.1097/JOM.0b013e3181c78c30
27. Lockley SW, Barger LK, Ayas NT, Rothschild JM, Czeisler
CA, Landrigan CP. Effects of health care provider work hours and sleep deprivation on safety and performance. Jt Comm J Qual Patient Saf. 2007;33(11):7-18.
28. Gangwisch JE, Malaspina D, Boden-Albala B, Heymsfield
SB. Inadequate sleep as a risk factor for obesity: analyses of the NHANES I. Sleep. 2005;28(10):1289-1296. https://doi.org/10.1093/sleep/28.10.1289
29. Aggarwal B, Makarem N, Shah R, et al. Effects of
inadequate sleep on blood pressure and endothelial inflammation in women: Findings from the American Heart Association go red for women strategically focused research network. Am Heart J. 2018;7(12):e008590.
https://doi.org/10.1161/JAHA.118.008590
30. Daniela T, Alessandro C, Giuseppe C, Fabio M, Cristina
M. Lack of sleep affects the evaluation of emotional stimuli. Brain research bulletin. 2010;82(1-2):104-108. 10.1016/j.brainresbull.2010.01.014
31. Dubetz C, Cripps A. Sleep deprivation affecting athletic
performance. Journal of Sports Medicine and Allied Health Sciences: Official Journal of the Ohio Athletic Trainers Association. 2017;3(1):11. DOI: 10.25035/jsmahs.03.01.11
32. Badr MS, Belenky G, Bliwise DL, et al. Recommended
amount of sleep for a healthy adult: a joint consensus statement of the American Academy of Sleep Medicine and Sleep Research Society. J Clin Sleep Med. 2015;11(06):591-592. DOI:10.5665/sleep.4716
33. Mazerolle SM, Pitney WA, Goodman A, et al. National
Athletic Trainers' Association position statement: facilitating work-life balance in athletic training practice settings. J Athl Train. 2018;53(8):796-811. doi: 10.4085/1062-6050-51.11.02
34. Pereira MA, Kartashov AI, Ebbeling CB, et al. Fast-food
habits, weight gain, and insulin resistance (the CARDIA study): 15-year prospective analysis. The lancet. 2005;365(9453):36-42.
https://doi.org/10.1016/S0140-6736(04)17663-0
35. Kyle RG, Wills J, Mahoney C, Hoyle L, Kelly M, Atherton
IM. Obesity prevalence among healthcare professionals in England: a cross-sectional study using the Health Survey for England. BMJ open. 2017;7(12):e018498. http://dx.doi.org/10.1136/bmjopen-2017-018498
36. Pingitore R, Dugoni BL, Tindale RS, Spring B. Bias
against overweight job applicants in a simulated employment interview. J Appl Pyschol. 1994;79(6):909. DOI: 10.1037/0021-9010.79.6.909
37. Mazerolle SM, Bruening JE. Work-family conflict, part 2:
how athletic trainers can ease it. Athletic Therapy Today. 2006;11(6):47-49. https://doi.org/10.1123/att.11.6.47
38. Mazerolle SM, Pitney WA, Casa DJ, Pagnotta KD.
Assessing strategies to manage work and life balance of athletic trainers working in the National Collegiate Athletic Association Division I setting. J Athl Train.
2011;46(2):194-205.
https://doi.org/10.4085/1062-6050-46.2.194
39. Kheirandish M, Farahani A, Nikkhoo B. The impact of
organizational culture on employees’ Job Burnout. Hum Resour Manage. 2016;3(10):1-15.
40. Mazerolle SM, Goodman A. Fulfillment of work–life
balance from the organizational perspective: a case study. J Athl Train. 2013;48(5):668-677. https://doi.org/10.4085/1062-6050-48.3.24
41. Krebs P, Duncan DT. Health app use among US mobile
phone owners: a national survey. JMIR mHealth and uHealth. 2015;3(4). DOI: 10.2196/mhealth.4924
42. Budruk M, Cowen LJ, Yoshioka CF, Kulinna P. Physical
activity participation constraints among athletic trainers: a profession based assessment. Leisure/Loisir.…2009;33(2):563-587.
https://doi.org/10.1080/14927713.2009.9651453
43. Stanek J, Rogers K, Anderson J. Physical activity
participation and constraints among athletic training students. J Athl Train. 2015;50(2):163-169. https://doi.org/10.4085/1062-6050-49.3.56
44. Haskell WL, Lee I-M, Pate RR, et al. Physical activity and public health: updated recommendation for adults from the American College of Sports Medicine and the American Heart Association. Circulation. 2007;116(9):1081.
DOI: 10.1249/mss.0b013e3180616b27
45. Stults-Kolehmainen MA, Sinha R. The effects of stress
on physical activity and exercise. Sports Med. 2014;44(1):81-121. doi: 10.1007/s40279-013-0090-5
9 Published by ScholarWorks@BGSU, 2019