Mismatch in Law School by
Jesse Rothstein, Princeton University and NBER Albert Yoon, Northwestern University
CEPS Working Paper No. 123 February 2006
Abstract: An important criticism of affirmative action policies in admissions is that they may hurt minority students who are thereby induced to attend selective schools. We use two comparisons to identify so-called “mismatch” effects in law schools, with consistent results. Black students attain better employment outcomes than do whites with similar credentials. Any mismatch effects on graduation and bar exam passage rates are confined to the bottom quintile of the entering credentials distribution, where selection bias is an important, potentially confounding factor. Elite law schools’ use of affirmative action thus does not appear to generate mismatch effects.
Acknowledgements: We thank Rick Abel, Bill Bowen, Tom Kane, Larry Katz, Jide Nzelibe, Max Schanzenbach, and seminar participants at NBER, UCSB, the Northwestern University School of Law Faculty Workshop, and the Ramon Areces Foundation for helpful comments and suggestions. We are extremely grateful to the Andrew W. Mellon Foundation and the Princeton Center for Economic Policy Studies for financial support.
Jesse Rothstein: Industrial Relations, Firestone Library, Princeton, NJ 08544; [email protected] Albert Yoon: School of Law, 357 E. Chicago Ave., Chicago, IL 60611; [email protected]
I.
Introduction
Affirmative action policies in college admissions have been legally and politically contentious since their inception in the late 1960s. Instituted with the goal of offsetting the legacy of discrimination against blacks, these policies grant preferences in admissions to black and other underrepresented minority applicants. The United States Supreme Court has repeatedly held that race-conscious policies are a permissible response to the compelling state interest in “diversity.”2
Public and academic debate over affirmative action policies has focused at least as much on their impacts on black students’ academic and labor market outcomes as on other students’ educational experiences (see, e.g., Arcidiacono, 2005). Critics have argued that affirmative action hurts black students by admitting them to schools for which they are unprepared, and that these students would do better—learn more, be more likely to graduate, avoid psychological damage, etc.—if they were required to attend schools more appropriate for their qualifications (Summers, 1970; Sowell, 1978; Thernstrom and Thernstrom, 1997). Although legally irrelevant, this claim is central to the political
evaluation of affirmative action: Support for preferences would almost certainly evaporate if they were shown to make black students worse off.
Evidence regarding the so-called “mismatch” hypothesis has been extremely limited (Holzer and Neumark, 2000). Substantial differences between black and white college completion rates are sometimes presented as indications of mismatch (Thernstrom and Thernstrom, 1997; Herrnstein and Murray, 1994; D’Souza, 1991), though these may simply reflect large black-white gaps in entering students’ qualifications (Kane, 1998).
Mismatch might be characterized as a negative peer effect: A student’s outcomes will decline if the average qualifications of her classmates rise too high above her own (Loury and Garman, 1995). Bowen and Bok (1998) find that minority students at elite colleges, despite having qualifications well below their white classmates, experience better long-run outcomes than do similarly qualified minority students at less selective colleges. More recently, however, Sander’s (2004) analysis of differences in outcomes between black and white law students leads him to conclude that mismatch effects are substantial.3
In this paper, we use Sander’s data but apply more direct empirical strategies to assess the mismatch hypothesis as it applies to law schools. The key challenge in estimating mismatch is the measurement of counterfactual outcomes. Namely, what would have happened to black students admitted to selective schools had they not received admissions preferences? We use two simple comparisons, each directly related to the hypothesis of interest. First, we compare students attending the most selective law schools with students of the same race, with similar admissions credentials, at less-selective schools. Second, we compare black students with white students.4 Black students, on average, attend much more
selective schools than do whites with similar admissions credentials. If selectivity has a negative effect on educational outcomes, this should appear as a negative black effect on those outcomes.
We expect that our two strategies are biased in opposite directions, the between-selectivity comparison providing an upward-biased estimate of the between-selectivity effect (so
3 Sander’s analysis and conclusions have been the subject of vehement criticism (Ayres and Brooks
2005; Chambers et al. 2005; Dauber 2005; Wilkins 2005; Ho 2005), to which Sander (2005a; 2005b) responded. As we discuss in the Appendix, Sander’s results are driven by large between-race gaps in law school grades and a strong within-race association between grades and later outcomes like graduation and bar exam passage rates.
4 This is essentially the comparison used by Sander (2004). Both our approach and his assume that
observable credentials summarize the gap in potential outcomes between black and white entering students. Sander additionally requires assumptions about the role of law school GPAs in mediating the effects of credentials on later outcomes, which we are able to avoid and which the data appear to reject.
understating mismatch) and the between-race comparison a downward-biased estimate. The results should therefore bracket the true effect.
At the outset, it is important to emphasize the limited overlap between the distributions of admissions credentials of black and white law students: Using Sander’s (2004) index of Law School Admissions Test (LSAT) scores and undergraduate grade point averages, the 95th percentile black student is at only the 54th percentile of the white
distribution; and the 5th percentile white student is at the 61st percentile of the black
distribution. Any mismatch analysis must distinguish the effect of interest from the effects of these differences in credentials. We use reweighting techniques that do not require us to parameterize the effects of entering credentials.
Our comparison between more- and less-selective schools offers no support for the mismatch hypothesis. Although school selectivity has a substantial negative effect on class rank for both black and white students, this does not translate into later outcomes: Students attending more selective schools are more likely to complete their programs, are equally likely to pass the bar exam, and earn higher salaries after graduation.
Results of our second comparisons are more mixed. Even after adjusting for differences in entering credentials, black students are significantly less likely to graduate or pass the bar than are white students. Black law graduates, however, obtain better jobs than do their white counterparts. Underperformance on the first two dimensions is concentrated at the very bottom of the entering credentials distribution, and among students in the upper four quintiles of the admissions index distribution blacks perform as well or better than whites on every outcome except class rank.
Although three quarters of blacks in our sample fall in the bottom quintile, inference about mismatch in this range is hazardous: Law school admissions rates for applicants with
such poor credentials are very low, particularly among whites. If better prepared students are more likely to be admitted—e.g. if lower-ranked law schools evaluate applications for indications of preparedness that we cannot observe—differential sample selection could generate mean performance differences between admitted white and black students even in the absence of mismatch effects.
We interpret our results as demonstrating that there are no mismatch effects on the bar passage rates of the most qualified black students. For students in the bottom quintile of the qualifications distribution the data are consistent either with mismatch effects on
graduation and bar passage or with differential selection, so do not support strong conclusions. By contrast, there are clearly no mismatch effects on black employment outcomes in any part of the credentials distribution.
The structure of the paper is as follows: Part II argues that legal education is a particularly attractive arena in which to study mismatch. Part III discusses the mismatch hypothesis. We define the term, distinguish it from related phenomena, and identify various formulations of the hypothesis. Part IV introduces our identification strategies and our empirical approach. Part V describes the Bar Passage Study (BPS) data. Parts VI and VII presents results of our two strategies, and Part VIII concludes.
II.
Why Law Schools?
Though our focus on law school admissions is largely a function of data availability, the mismatch hypothesis is particularly plausible in this arena. Students must pass a bar exam to practice law, and the subjects covered by the exam receive little emphasis in elite law schools’ curricula. Lower-ranked, less-selective schools tend to devote more of their
school thus reduces the amount of bar preparation students receive, perhaps reducing their success rates on the exam.
Moreover, students’ grades—particularly those earned in the first year of law school when courses are typically exam-based and graded on strict curves—are important
qualifications for opportunities during law school (e.g., law review membership and good summer internships) and after graduation. Even without mismatch effects, a student can be expected to rank lower within her class the more selective the school she attends. Unless employers take school selectivity into account when evaluating job applicants’ class ranks, this mechanical rank effect could carry over into employment outcomes.5
There are also analytic advantages to a focus on legal education. First, the bar exam provides an objective measure of students’ accomplishment early in their post-school careers. Bar exams are the same for all prospective lawyers in a state, are graded without regard to the test-taker’s ethnicity or educational background, and are outside of law schools’ direct control.6 Other outcome measures are subject to criticism: Colleges may lower their
grading and graduation standards to mask racial achievement gaps (Mansfield 2001); salaries of recent graduates may not correlate with the desirability of their jobs, as some prestigious jobs (e.g. judicial clerkships) have low current salaries but promise higher long-run income; and direct measures of job quality may be affected by affirmative action in hiring. Though we also present results on graduation, employment, and salaries, we focus on bar exam passage as our primary outcome measure.
5 On the other hand, there is a relatively strict hierarchy of law schools, and some employers may
consider job candidates only from highly-ranked schools; this could create a selective-school premium that is unrelated to achievement.
6 The exam varies across states, but nationally only 83% of students pass the exam on the first try
A second analytical advantage is that law school admissions decisions depend strongly on applicants’ numerical qualifications. Both of our empirical strategies require assumptions that a treatment and a comparison group would have achieved the same outcomes, conditional on observables, had their treatment status been the same. This is implausible if treatment depends to a great extent on unobserved characteristics— application essays, letters of recommendation, extracurricular activities—that may be correlated with potential outcomes.
While these factors influence law school admissions, they receive substantially less weight relative to numerical qualifications than in undergraduate admissions. LSAC (1992) reports counts of applications and admissions for the 1991-92 cycle, by LSAT and GPA range, from each law school that provided data. Using data from 17 schools ranked in the U.S. News and World Report (2005) top 25, we estimated a grouped probit model for admissions decisions as a function of the cell-mean LSAT score and undergraduate GPA. Marginal effects from this model are reported in Column 1 of Appendix Table A. A single extra LSAT point or a 0.07 increase in undergraduate GPA—measured on the traditional 4-point scale—raises admissions probabilities for average applicants by about 1.6 percentage points.
Estimates for undergraduate admissions at the most selective quintile of colleges, reported by Kane (1998, Table 12-2) and reproduced as Column 2 of Appendix Table A indicate much smaller effects: A SAT increase equivalent (in standard deviation terms) to 1 LSAT point improves admissions probabilities by only 0.9 percentage points, while a 0.07
point increase in GPA is worth only 0.4 percentage points.7 Admissions rates differ
dramatically between the samples, however, confounding comparisons of marginal effects at the mean. The bottom rows show the marginal effects for students with admissions
probabilities of 0.5. Test scores and grades are 3.2 and 7.6 times as important, respectively, to law school admissions as to undergraduate admissions. The potential endogeneity of school selectivity to unobserved ability is thus a relatively minor concern in law schools.
III.
Defining Mismatch
The “mismatch” hypothesis is that some students would obtain better outcomes— higher grades, higher graduation and bar passage rates, and better jobs at higher salaries—if they attended less selective schools than if they attended more selective schools, and that the minority students affected by affirmative action preferences fall into this group. Elimination of affirmative action would thus improve outcomes of the students who would be displaced into less selective schools.
Two closely related claims are not, in our understanding, what is commonly meant by mismatch. First, it might be that the most selective law schools have negative treatment effects on all students. In this case, the ideal policy might eliminate the selective law schools or alter their curricula to more closely resemble those seen at less competitive schools. We find the “universal mismatch” hypothesis implausible. Consideration of this hypothesis, however, suggests that an appropriate analytical framework for mismatch must allow for heterogeneous treatment effects of attending selective law schools.
7 Kane’s model includes controls for race, family income and parental education, which ours does not.
To the extent that colleges give preferences for demographic characteristics that are negatively correlated with SATs and GPAs, exclusion of these controls would likely reduce Kane’s estimated SAT and GPA effects.
A second hypothesis contends that some applicants receive negative treatment effects from attending law school, irrespective of the school they attend, and would be better off pursuing other careers. Only a bit over half of law school entrants from the bottom decile of the admissions qualifications distribution pass the bar exam within 5.5 years of entering law school, and it is plausible that students in this range should not go to law school.8 To the extent that affirmative action is responsible for admissions of applicants
with extremely poor prospects for bar passage, then, elimination of preferences might benefit these applicants.
Evaluation of this claim requires data on students’ alternatives if they do not attend law school, as an applicant may prefer even a low probability of becoming a lawyer to her other options. We focus on mismatch among law schools, which can plausibly be observed in bar passage rates and other indicators of law school success, rather than on mismatch between
law school and other career choices. It is the effect of attending a highly selective school, relative to a less selective school, that is at the center of most discussions of mismatch.
It is important also to note that naïve comparisons that do not take careful account of differences in credentials among students may be extremely misleading. Students
attending less selective law schools achieve much worse outcomes, on average, than do those attending more selective schools, and black students’ outcomes are generally inferior to those of whites. These gaps cannot easily be attributed to mismatch effects, however, as each of these comparisons is between groups that differ substantially in their entering credentials (Kane 1998). An important advantage of our analytical approach is that we do
8 It is also plausible that students who never practice law nevertheless benefit from attending law
school. When we analyze employment outcomes, below, we include students who failed or did not take the bar exam, so long as they graduated from law school.
not rely on assumptions about the particular parametric form of the relationship between entering credentials and student outcomes.
Finally, there is reason to think that selectivity effects may be more negative for black students. While a white student with anomalously low credentials for her school may be able to avoid notice, the visibility of race may make this impossible for black students. Observers with incomplete information about particular students’ ability may form lower estimates for members of groups that benefit from admissions preferences (Murray, 1994; Steele, 1990; Sowell, 2004).9 The resulting low expectations may be self-fulfilling for black students, as
so-called “stereotype threat” has been claimed to worsen black performance in contexts where racial performance differences are salient (Steele and Aronson, 1998). The Socratic method of instruction, widely used in law schools, may further aggravate these effects by focusing classroom attention on black students as representatives of their race (Guinier et al., 1994).
The relevant selectivity effects for the mismatch hypothesis are those on black students. Our first comparison, between more- and less-selective schools, provides separate estimates of average selectivity effects on blacks and on whites. Our second comparison, between black and white students, identifies average selectivity effects on blacks.
Notation
We adopt a potential outcomes framework. For simplicity, suppose that law schools come in only two types, more- (s=1) and less-selective (s=0). Let pis be the outcome that
student i would obtain if he or she attended a school of type s. The treatment effect of a more-selective school on student i is τi ≡ pi1-pi0. Let bi be a race indicator (with bi=1
9 Justice Thomas writes in his Grutter dissent (539 U.S. 306, 373) that “The majority of blacks are
admitted to the [University of Michigan] Law School because of discrimination, and because of this policy all are tarred as undeserving. This problem of stigma does not depend on determinacy as to whether those stigmatized are actually the ‘beneficiaries’ of racial discrimination.”
indicating a black student), and let Xi be a vector of observable admissions qualifications.
The average treatment effect of selectivity on (b, X) students is M(b, X) ≡ E[τi | bi=b, Xi=X].
In its weakest form, the mismatch hypothesis states that some students are hurt by selectivity:
Mismatch version 1: For some i, τi < 0.
This is untestable without further structure, as for any individual student only pi = sipi1 +
(1-si)pi0 can ever be observed. A slightly stronger version states that some ex ante identifiable
categories of students have negative average treatment effects of selectivity: Mismatch verson 2: For some (b, X), M(b, X) < 0.
A final version of the hypothesis states that the average black student who is “treated” by affirmative action policies is mismatched. This is the claim that seems to motivate most discussions of mismatch.10 Let s
inoAA∈ {0, 1} be the selectivity of the law school that the
student would attend in the absence of racial preferences. Mismatch version 3: E[ τi | bi=1, si > sinoAA]< 0.
The effect of affirmative action on mean outcomes of black students with characteristics X is E
[
(
s snoAA)
τi bi Xi X]
i
i − | =1, = . This can be written as the product of
admissions preferences and the mismatch effect, plus a term reflecting the selectivity of affirmative action beneficiaries with respect to their treatment effects,
(1)
[
(
)
]
(
,) (
,)
cov(
(
)
, | ,)
, , | X X b τ s s X M X δ X X b τ s s E i i i noAA i i i i i noAA i i = = − + = = = − 1 1 1 110 An example is Sander’s (2004) claim that affirmative action reduces the number of black lawyers.
Sander’s conclusion also requires that any black students who would not attend law school in the absence of affirmative action pass the bar exam at sufficiently low rates that they are outweighed by those who fail the exam due to affirmative action-induced mismatch.
where δ(b, X)=E[si-sinoAA | bi=b, Xi=X] is the effect of affirmative action on (b, X) students’
distribution across schools.
IV.
Observable Implications and Methods
To evaluate the intermediate version of the mismatch hypothesis, we require estimates of M(b, X) throughout the (b, X) distribution. For the strong version, we also require estimates of δ(b, X) and an assumption about the covariance term in (1). We assume unconfoundedness (Rosenbaum and Rubin, 1983; Rubin, 1978): Admissions offices at selective schools—which presumably seek to identify students with either a large pi1 or a
large τi—observe no more about students’ qualifications than do we, and student
matriculation decisions are similarly ignorable. Thus, (pi0, pi1) ⊥ (si, sinoAA) | bi, Xi. This
eliminates the second term of (1): Average treatment effects are the same for students who attend selective schools as for observationally identical students who attend unselective schools.
We approximate a race-blind admissions rule by that observed among white students, and we further assume that black application and matriculation decisions would mirror those of white students with similar qualifications in the absence of affirmative action (Krueger, Rothstein, and Turner, 2005): δ(0, X)=0 and δ(1, X)=E[si | bi=1, Xi=X] - E[si |
bi=0, Xi=X].11
It is helpful to decompose M(b, X) into components deriving from the subsets of (b, X) students attending selective and unselective law schools:
11 In practice, a race-blind admissions rule will likely produce E[sinoAA | Xi=X] intermediate between
E[si | bi=1, Xi=X] and E[si | bi=0, Xi=X], so our expression for δ(1, X) overstates the impact on black
enrollment rates of moving to race-blind admissions. However, blacks make up only 8% of whites and blacks in law school, so the approximation δ(0, X)=0 is likely reasonably accurate and the overstatement small.
(2)
(
)
[
]
(
(
)
(
)
)
[
]
(
1 | ,) (
(
0, ,) (
0, ,)
)
, , , 1 , , 1 , | , X b p X b p X b s E X b p X b p X b s E X b M c c − − + − = where p(
s b X)
E[
ps si s bi b Xi X]
i = = = = | , , ,, is the average outcome among (b, X) students attending type-s schools and p
(
s b X)
E[
p s si s bi b Xi X]
i
c , , = 1−| = , = , = is the
counterfactual average outcome had these students attended schools of the other type. Our two strategies involve different assumptions about this counterfactual.
A. Within-race comparisons between more- and less-selective schools
Our first strategy is simple: We use students observed attending less selective schools as the counterfactual for students of the same race and observed qualifications at more selective schools. The difference between the two types of schools in observed outcomes of students with the same (b, X) is
(3)
(
)
[
] [
]
[
] [
]
[
]
(
[
] [
]
)
(
,)
(
(
, ,) (
, ,)
)
. , , | , , | , , | , , | , , | , , | , , | , X b p X b p X b M X b s p E X b s p E X b s τ E X b s p E X b s p E X b s p E X b s p E X b D c i i i i i i i i i i i i i i 0 1 0 1 1 0 1 0 1 0 0 0 1 − + = = − = + = = = − = = = − = =The unconfoundedness assumption is that E
[
pij|s,b,X] [
= E pij|b,X]
for j=0, 1.12 With it,(
s b X) (
p s b X)
pc , , = 1− , , for each (s, b, X) and D
(
b,X)
=M(
b,X)
.This assumption is unlikely to hold exactly: Law school admissions offices can observe student qualifications that are not reported in our data sets but that may be correlated with potential outcomes. This would imply pc
(
,b,X) (
p ,b,X)
0
1 > and D(b, X)
> M(b, X). Given the evidence above that law school admissions probabilities depend
12 Note that this rules out the Roy model of self selection, where si is increasing in τi. To the extent
that students rationally choose from among their available options to maximize their outcomes, we will not find evidence of mismatch. Of course, in this case affirmative action merely enlarges black students’ choice sets so cannot hurt them.
heavily on variables included in X, we expect that the difference is relatively small. If so, estimates of the mismatch effect obtained from this comparison will provide a reasonably tight upper bound for the true effect.
B. Comparisons between whites and blacks
Our second strategy compares the outcomes of black students to those of white students with similar admissions qualifications. The average outcome among (b, X) students can be written as
(4) E[pi | bi=b, Xi=X] = E[pi0 + siτi | bi=b, Xi=X]
= pb0
( )
X +sb( )
X *M(
b,X)
+Cb( )
Xwhere Zb
( )
X indicates E[Zi | bi=b, Xi=X] and Cb(X)=cov[si, (pi1-pi0) | bi=b, Xi=X]. Thewhite-black gap in mean outcomes among students with qualifications X is then
(5)
( )
( )
( )
( )
(
)
(
( )
(
)
( )
( )
)
(
( )
( )
)
( )
X s( )
X M X s( )
X(
M(
X)
M( )
X)
C( )
X p X C X C X M X s X M X s X p X p X p X p Δ , , ) , ( * Δ Δ , * , * + − + + = − + − + − = = − 1 0 1 1 0 0 0 1 0 1 0 0 1 0 0 1 0where Δf(X) indicates f0(X)-f1(X). The first term in the final line of (5) is the white-black
difference in outcomes if everyone attended unselective schools. The third term is the difference between the selective school effect on white students and that on black students, multiplied by the white enrollment rate at selective schools. The final term is the white-black difference in the covariance between selectivity and the selective school treatment effect; it is positive if selective schools do a better job of identifying and admitting white students with positive treatment effects than they do of identifying positive-τ black students. We assume that each of these is zero:
(6) Δp0
( )
X =M(
0,X)
−M(
1,X)
=ΔC( )
X =0.(7) Δp
( )
X = Δs( )
X *M(
1,X)
,the average selectivity effect on black students multiplied by the difference between black and white enrollment rates at selective schools. If black students with characteristics X would achieve worse outcomes at selective than unselective schools, M(1, X) < 0 and Δp(X)<0. Note that the difference in enrollment rates, Δs
( )
X , is the negative of the estimator of the affirmative action preference, δ(X), proposed earlier.The key assumption implicit in our approach is that black students’ outcomes would mirror those of white students with the same admissions credentials if the two groups were similarly distributed across schools. This assumption is almost certainly violated in ways that lead us to overstate the degree of mismatch. At the undergraduate level, a long literature establishes that black students underperform white students with the same entering credentials, even when they attend the same colleges (see, e.g., Rothstein, 2004; Young, 2001). A similar pattern appears to hold in law school (Wightman 2000; Wightman and Muller 1990; Anthony and Liu 2003; Powers 1977). It thus seems likely that Δp0(X) < 0. The sign of ΔC(X) is less obvious, but given a reduced observables threshold for black applicants, admissions offices may exert more effort to identify unobserved correlates of future success for black than for white applicants, which could produce ΔC(X)<0. Finally, black underperformance suggests that a difficult law school curriculum may overmatch black students more than it does whites with similar observable characteristics, producing M(0, X) - M(1, X) > 0 and −s0
( )
X(
M(
0,X)
−M(
1,X)
)
<0. We thus view Δp( )
X as a lower bound for the true mismatch effect M( ) ( )
1,X Δs X .There is another important source of bias in our estimates of mismatch at the lowest X values. We compare black and white students who are observed attending law schools;
potential students who were at risk for attending law school but did not actually attend are not in our sample. Below, we show that low-X applicants are quite likely to receive zero admissions offers, particularly when they are white. There is likely selection on
unobservables within race: Those low-X students who are admitted to some law school likely have better unobserved qualifications than are those who are rejected everywhere. If so, our sample estimates of pb0
( )
X are upward-biased relative to what would be seen ifoutcome measures were available for all race-b students with qualifications X.
The black-white difference in sample selection is a direct consequence of the use of affirmative action at the margin of admission to the least-selective law schools. Because black selection rates are so much higher than those of whites, p0
( )
X1 is less biased than is
( )
Xp0
0 . Our estimates of Δp
( )
X are therefore upward-biased (assuming that selection ispositive), particularly at low X values where the differential selection is most extreme. We do not attempt to correct our estimates for this. Instead, we present estimates of mismatch both including and excluding the lowest X values. When we exclude the lowest-X portion of our sample, we obtain estimates of the effect of affirmative action on the most qualified black students.
C. Methods
All of our analyses allow for an arbitrary nonlinear relationship between an index of entering credentials (LSAT scores and undergraduate GPAs) and potential outcomes. We accomplish this via a form of matching, re-weighting data from a comparison group so that the index distribution within that group matches that in the group of interest (DiNardo, Fortin, and Lemieux, 1996; Hahn, 1998; Hirano, Imbens, and Ridder, 2003).
Our first strategy is based on the difference between mean outcomes of s=1 and s=0 students of race b and qualifications X,
(8) D
(
b,X) (
= p1,b,X) (
− p 0,b,X)
.We estimate the p
(
s,b,X)
functions as kernel means, using an Epanechnikov kernel. We use bootstrap resampling for inference, re-estimating the kernel means in each bootstrap sample and reporting pointwise 90% confidence intervals for D(b, X).To obtain the average treatment effect on race-b students, we estimate
( )
b ≡∫
D(
b X)
f( )
X dXD , b (where fb(X) is the density of X for race-b students) as a difference in re-weighted means:
(9)
( )
(
( )
( )
)
( )
( )
( )
( )
(
)
( )
( )
∑
∑
∑
∑
= = = = − = b s b b b s i b b b s b b b s i b b X f X f X f X f p X f X f X f X f p b D , , , , ˆ 0 0 0 0 1 1 1 1 .13fbs(X) is the density of X among race-b students at type-s schools. We use a kernel density
estimator for both fb(X) and fbs(X), again using an Epanechnikov kernel. There is sampling error in our density estimates that carries over into the reweighting factors. We compute standard errors for Dˆ
( )
b by bootstrapping the entire process (including the densityestimation). Our approach amounts to a decomposition of the selective/unselective gap in mean outcomes into a component due to differences in X distributions and a remainder that we treat as an estimate of the average selectivity effect for race-b students (see, e.g.,
DiNardo, Fortin, and Lemieux 1996 and Firpo, Fortin, and Lemieux 2005).
13 This is equivalent to a propensity score (Rosenbaum and Rubin, 1983; Dehejia and Wahba, 2002)
estimator of the average treatment effect for race-b students in which the propensity score is a nonparametric function of X. The propensity score can be written as Nb1fb1(X)/Nbfb(X), where Nbs is the total number of
Our second strategy uses white students as the counterfactual for black students with the same X. We present kernel mean estimates of p0
( )
X and p1( )
X ; the difference estimates Δp( )
X , the treatment effect of being black for students with credential X. We estimate the average treatment effect on the treated, Δ=∫
Δp( ) ( )
X f1 X dX, as anotherdifference in reweighted means, this time between the actual black mean outcome and a reweighted white mean that makes the white X distribution identical to that of blacks:
(10)
(
( ) ( )
)
( ) ( )
1 1 1 1 0 0 1 0 N p X f X f X f X f p b i s b i∑
∑
∑
= = = − = Δˆ .An important advantage of this approach is that we do not require a perfect measure of the admissions preferences enjoyed by black students; as we discuss below, we have only limited information about the selectivity of the schools that students in our data attend.
V.
Data
Our data come from the Law School Admissions Council’s (LSAC) Bar Passage Study (BPS; Wightman 1998, 1999), which attempted to survey all students entering accredited law schools in the fall of 1991. Survey responses were matched with
administrative records containing students’ undergraduate grade point averages (UGPAs) and Law School Admissions Test (LSAT) scores, and with information from law schools and state bar associations about law school and bar passage outcomes through July 1996.
The BPS contains information on over 27,000 students, about 62% of 1991 entering students.14 We focus on black and white students, yielding an analysis sample of 24,212 of
which 7.6% are black. A subset of BPS respondents was chosen for follow-up surveys, the
14 Most non-response was individual: 163 of 172 accredited law schools participated in the study
last of which took place four to six months after students’ scheduled graduation.15 Our
sample for analyses of employment outcomes is 3,174.
The BPS data are exceedingly rich, providing a reasonable approximation to a full cohort of law school students. Our analysis is limited, however, by a few decisions made by LSAC in its aggressive protection of respondents’ privacy. Most importantly, the BPS data group law schools into six “clusters” and report only the cluster that each student attended. Clusters are intended to group similar schools along dimensions like size, cost, selectivity, tuition level, and minority representation. In practice, it is difficult to rank the clusters by selectivity. We characterize two clusters (labeled “Elite” and “Public Ivy” in the BPS data, though neither label is quite accurate; see Wightman, 1993) as “more selective” and the remaining clusters as “less selective,” acknowledging the substantial measurement error in this classification (Sander, 2005b).
A second data limitation relates to measurement of grade point averages (GPAs). Law school admissions frequently use adjusted undergraduate GPAs that account for differences in grading standards between colleges. The BPS, however, reports unadjusted GPAs and contains no information about the undergraduate institution. As a result, our undergraduate GPA variable is imperfectly related to that actually used in admissions. Oddly, the BPS law school GPA variables are limited in the opposite way: Only GPAs standardized within law schools are reported. These variables are best seen as measures of class rank rather than of absolute performance. It would not be surprising to find large
15 Sampling probabilities for the follow-up surveys depend on race, school cluster (see below), and
school racial composition. Unfortunately, the BPS data contain no information about the last, so do not permit construction of inverse probability weights. The codebook recommends weighting by race, which would not yield a representative sample. We weight by the interaction of race and school cluster to match the full-sample distribution. With these weights, the subsample is representative of black students but
mismatch effects on class rank, as these are a nearly mechanical consequence of the effect of students’ own credentials on achievement.
Finally, the bar exam measures are limited in two ways. First, states vary substantially in the difficulty of their bar exams, but the BPS does not report which state’s exam a student took, much less which the student considered. Second, in 14 states successful attempts at the exam are observed but failed attempts are not, biasing observed success rates. To avoid this bias, we focus on whether a student passed the bar in any state during the 2.5 years for which data were collected, irrespective of whether, where, or how many times the exam was attempted. “Failures” on this outcome thus include students who chose careers that did not require admission to the bar as well as those who took the exam and failed.16
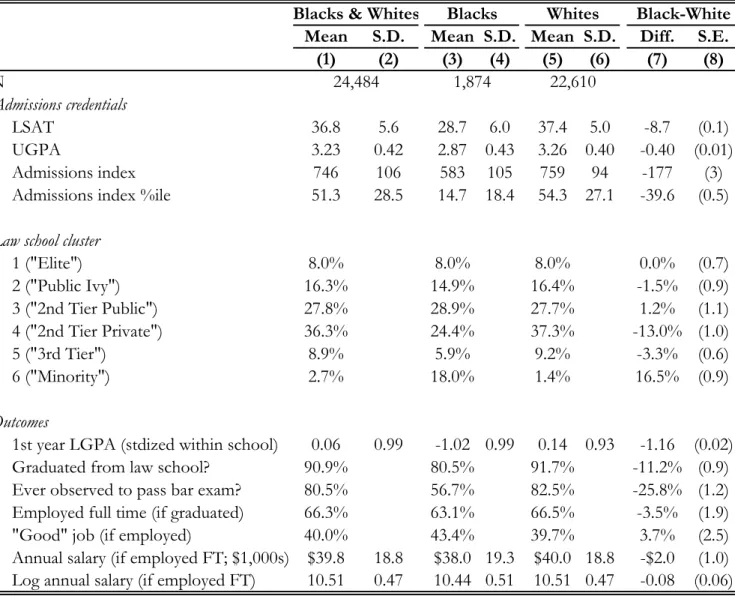
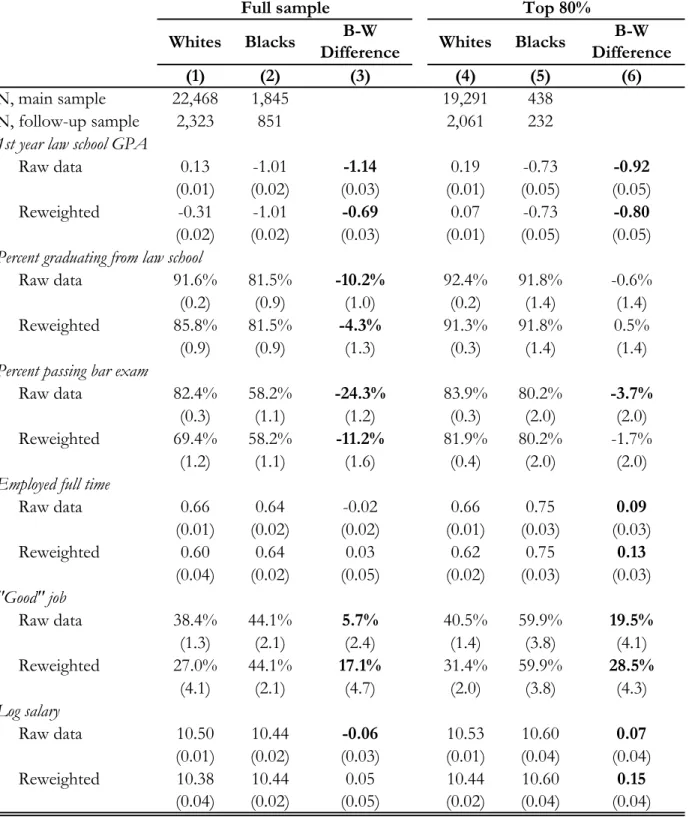
Summary statistics for black and white students in the BPS data are reported in Table 1. The first several rows describe admissions credentials. LSAT scores ranged from 10 to 48 in 1991, with a mean of 33.3 and a standard deviation of about 7 among applicants. Matriculants have a higher mean (36.8) and a smaller standard deviation (5.6). The black-white LSAT gap is over 1.5 standard deviations and the UGPA gap is about one S.D.17 We
combine these two variables into a single index, (8) 10 48 10 600 4 400 − − + = i i i LSAT UGPA Index * * .18
16 About 16% of study participants (7% of those observed to graduate from law school) were not
matched to any bar exam data, indicating either that they did not take the exam at all or that they failed the exam in a state that did not report failed attempts.
17 Among all 1991 law school applicants, the LSAT gap is 1.33 standard deviations (Wightman, 1997,
Table 3), though the standard deviation is larger for this group; the absolute LSAT gap is slightly bigger among applicants than among BPS respondents.
18 This index is taken from Sander (2004), who describes it as a close approximation to the weights
used in law school admissions. A probit model for attendance at the most selective cluster of law schools yields nearly identical weights, as does a model predicting law school GPAs within clusters. None of our results are sensitive to the substitution of indices based on weights from either of these models.
The black-white gap in this index is nearly 1.7 standard deviations. We present most of our results in terms of percentile scores computed from the index using its distribution within the BPS sample. The average percentile score for black BPS respondents is 15; for whites it is 54. 76 percent of blacks but only 13 percent of whites score in the bottom quintile. Figure 1A displays the density of admissions index scores among black and among white students in the BPS, while Figure 1B displays cumulative distribution functions of percentile scores for each group.
The second group of rows in Table 1 reports the distribution of students across the six “clusters” of law schools. We order clusters by their index score ranking; the clusters have mean indices of 848, 784, 765, 711, 661, and 578. Blacks and whites are more similarly distributed across clusters than one might expect given the large gaps in entering credentials, a reflection of affirmative action in admissions. Figure 2 displays the fractions of white and black students at each index percentile who attend schools in clusters 1 and 2 (“elite” and “public ivy,” respectively, in the BPS documentation). Although this figure incorporates the effects of any differences in application behavior, unobserved admissions credentials, or matriculation decisions, it is clear that admissions preferences must be quite large: Probit models for enrollment at schools in clusters 1 and 2 indicate that black students have
enrollment probabilities resembling those of white students with index scores 165 points (1.6 standard deviations) higher.
The final rows of Table 1 present statistics for our outcome measures. The first row shows the GPA during the first year of law school, which as mentioned above is best
thought of as a long-tailed measure of class rank.19 The next two rows show law school
19 Analyses of the cumulative law school GPA, available for students who completed law school and
graduation and eventual bar passage.20 Finally, we consider several employment-related
outcomes measured from the post-graduation survey.21 The first is a measure of whether the
respondent is employed full time. Second, for those who are employed we form an indicator for whether the current work setting is a judicial clerkship (14.0% of respondents), an
academic job (0.8%), a prosecutor’s office (4.4%), a public defender’s office (2.3%), or a large law firm (20.0%), each of which we take to be a positive employment outcome for lawyers.22 Finally, the BPS reports the annual salary, which we report in both levels and
logs.23 Black students’ GPAs, graduation rates, and bar passage rates are significantly worse
than those of white students. Differences in employment measures are much smaller and do not take a consistent sign.
A. Selection into law school
An issue that will become important below is the possibility of selectivity in which law school applicants ultimately matriculate. Figure 3 shows the fraction of white and black applicants for the 1991 entering cohort who appear in the BPS sample. Applicants with low index scores are notably underrepresented, particularly among whites.
These differences in representation appear largely to reflect admissions decisions. Unlike colleges, even the least selective law schools have competitive admissions, and only
20 Students who stopped out of the survey are counted as having missing graduation status. They
(along with dropouts) are included in the bar passage variable.
21 We include only students who graduated from law school in our employment analyses, as response
rates to the follow-up survey were extremely low for non-graduates. Among graduates, the response rate was 74% overall but only 65% for blacks, a difference that does not appear to be attributable to differences in entering credentials. Caution is therefore required in interpretation of our analyses of employment outcomes.
22 This variable is set to zero for lawyers in mid-size or smaller firms (29.7%), solo practice (3.1%),
government agencies and legislative offices (7.5%), public interest (2.5%), business/finance (4.0%), other law related (3.8%), and non-law-related work other than academics (7.9%).
23 Salaries are reported in 8 bins (less than $20,000, $20-$30,000, …, $70-$80,000, and greater than
$80,000). We assign each respondent to the log of the midpoint of the relevant bin, using $15,000 for the lowest bin and $100,000 for the highest; respondents who are not employed full-time are excluded from the salary analyses, though this has little impact on the results.
56% of the 92,648 applicants from the BPS cohort were admitted to any law school (Barnes and Carr, 1992; see also Wightman, 1997). Figure 4 shows the fraction of applicants who were admitted to at least one school, by entering credentials and race.24 White students
whose credentials would have placed them in the bottom quarter of the BPS distribution were more likely to be rejected than to be accepted. Black admission rates were well above one half everywhere above the fifth percentile, and are double or more those of similarly-qualified whites through much of the lower part of the distribution.
These differential admission rates by race suggest that between-race comparisons may be subject to sample selection bias. It is somewhat plausible that mean latent outcomes are similar for white and black applicants with identical index scores. But admissions offices have more information than just the LSAT score and UGPA, and students who were admitted likely had better essays, recommendation letters, or other qualitative qualifications than did observably (to us) identical students who were rejected from all the schools to which they applied. If admissions offices distinguish among students on the basis of characteristics that are correlated with potential outcomes, and if these offices set a lower threshold for black than for white applicants, then comparisons using the BPS data are biased in favor of whites.
On the basis of Figure 3, it seems reasonable to assume that selection bias is not a major problem for black-white comparisons at index values above about the 30th percentile.
Restricting our analysis in this way would come at a substantial cost, as it would exclude 85% of black students in the BPS sample. We instead use the 20th percentile as a compromise
24 The data for this figure (and the denominator for the previous figure) are from Barnes and Carr’s
(1992) report of the number of 1990-1 applicants in each of 90 LSAT-undergraduate GPA cells, separately by race, and the number admitted to at least one school. We assign to each cell the mean index percentile of BPS respondents in that cell.
threshold that risks limited selection bias in order to enlarge the sample size, and we report estimates for both the full sample and the top four quintiles.
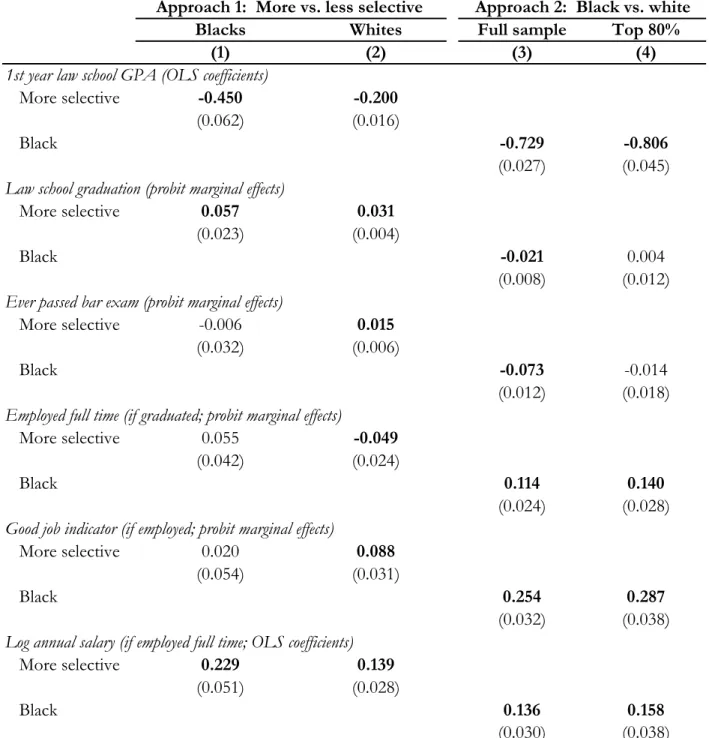
B. Simple regression estimates
Table 2 presents regression versions of our two comparisons, first between students attending more- and less-selective schools (columns 1 and 2) and second between blacks and whites (columns 3 and 4). Each specification controls for quadratics in the LSAT and the undergraduate GPA and for an interaction between the two. The first pair of columns indicates that attending a more selective school—proxied throughout by the “elite” and “public ivy” clusters—has a positive effect on all outcomes but law school grades and employment, though this is generally insignificant and the point estimate for bar passage is very slightly negative in the smaller black sample. Column 3 indicates that black students earn much lower GPAs than do whites with similar qualifications. Blacks also graduate and pass the bar at lower rates, but achieve better employment outcomes. Column 4 restricts the sample to students with admissions qualifications above the bottom quintile. The negative black effect on graduation and bar passage is absent here, indicating that black
underperformance is concentrated at the bottom of the qualifications distribution.
These models include relatively sparse parameterizations of the relationship between students’ entering qualifications and their eventual outcomes. If they are mis-specified, the estimated effects are biased in unknown directions. The next two sections present
reweighting analyses that are robust to arbitrarily nonlinear relationships between the index and outcomes. In Section VI, we explore the selective-unselective comparison, and in Section VII we turn to the black-white comparison.
VI.
Results: Within-race comparisons across clusters
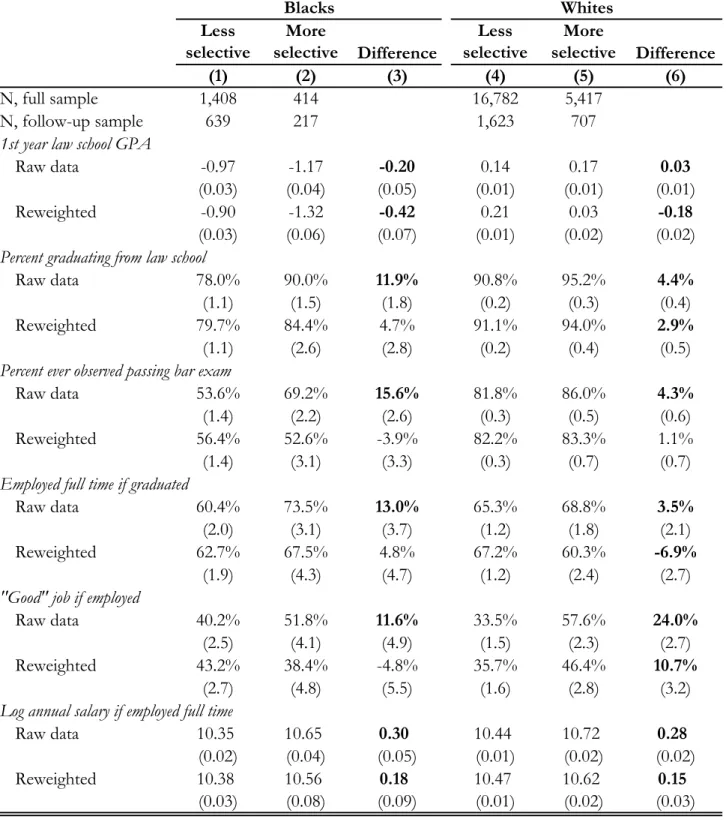
Figure 5A displays the fraction of students passing the bar by race, index percentile, and school selectivity, and Figure 5B displays the selective-unselective gap by race and percentile.25 This gap is generally close to zero, and is positive at many points.
Integrating over the within-race distributions, we estimate that the black bar passage rate would be 3.9 percentage points lower if all blacks attended selective schools than if all attended unselective schools, though this estimate is insignificantly different from zero. For whites the corresponding figure is 1.1 percentage points higher, also insignificant. The third set of rows in Table 3 presents this result in tabular form. Without accounting for
differences in index distributions, blacks attending more selective schools pass the bar at a rate 15.6 percentage points higher than do blacks attending less selective schools. When the two subsamples are reweighted to have the same index distribution as the overall black sample, however, we obtain the -3.9 figure cited above. Thus, more than 100% of the raw selective-unselective gap in black bar passage rates can be attributed to differences in entering credentials.26
The other rows of Table 3 present mean treatment effects on our remaining outcomes, before and after reweighting. Unsurprisingly, selective schools have large
negative effects on law school GPAs (class ranks) for both races, but these do not carry over
25 Graphs are trimmed at the 3rd and 97th percentile of the within-race or pooled distributions,
whichever is more restrictive. Thus, for blacks the graphs are shown for percentile scores between 3 and 69; for whites, between 8 and 97.
26 The choice of a “base” distribution for reweighting is analogous to the choice of a base group in a
Oaxaca-Blinder decomposition (Oaxaca and Ransom, 1999). Our use of the overall index distribution is akin to use of the grand mean of X as the base for a Oaxaca-Blinder decomposition, and provides us with estimates of the average treatment effect on black students.
consistently to the more cardinal outcomes.27 The estimated selectivity effect is positive and
significant for whites for three of the other five outcomes, positive and insignificant for one, and significantly negative for full-time employment. For blacks, only the positive estimate for salary is significant, and the other point estimates show no clear pattern.
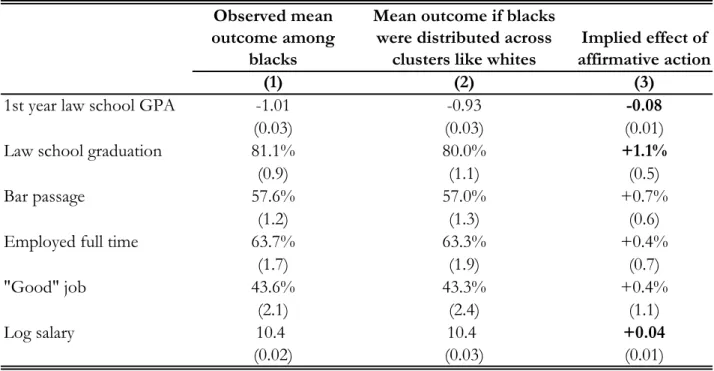
Another way to express these results is as estimates of the impact of affirmative action on black students’ average outcomes. Figure 2 shows black and white students’ probabilities of attending “selective” law schools at each admissions index percentile. Elimination of affirmative action can be approximated as forcing black students to the observed white profile. Table 4 reports the estimated effect of this on black mean outcomes, under the continued assumption that selectivity is uncorrelated with latent outcomes conditional on race and the index. Where Table 3 reported average treatment effects for blacks (“reweighted” estimates in Column 3), the estimates in Table 4 can be seen as local average treatment effects for affirmative action “compliers” (Angrist and Imbens, 1994). Elimination of affirmative action would worsen black outcomes along every dimension but LGPA, significantly so for graduation rates and salaries.
VII.
Results: Comparisons between whites and blacks
Due to affirmative action, blacks have the opportunity to attend more selective law schools than do whites with similar entering credentials, even if we cannot always observe selectivity. Our second strategy takes advantage of this, comparing average outcomes of whites and blacks, irrespective of cluster, with the same entering credentials.
27 A given individual’s rank within her school’s X distribution is by definition decreasing in the
school’s selectivity. Thus, if there is any relationship between students’ incoming and outgoing ranks, we will see negative selective school effects on outgoing rank. For comparison, when we repeat the analysis from Table 3 for an incoming rank variable, computed by normalizing the X variable within cluster, we estimate selectivity “effects” of -0.85 for blacks and -0.74 for whites.
Figure 6A shows average bar passage rates by race and index percentile in the BPS data, and Figure 6B shows the white-black gap at each percentile in the common support. In the upper four fifths of the distribution, black students generally perform about as well as white students with similar credentials and sometimes outperform them, but in the lower quintile—where passage rates are lower for both races—blacks substantially underperform whites. About three quarters of black law school students are in the bottom quintile, so when we average the gaps in Figure 6B over the black distribution the black effect on bar passage rates is negative and significant.
This is presented in the left-hand columns of Table 5, in the third set of rows for bar passage: A bit over half of the raw black-white gaps in bar passage and law school
graduation are attributable to differences in entering credentials. A smaller portion of the GPA gap is attributable to observables, consistent with a larger mismatch effect on class rank than on other outcomes. Reweighted black-white differences in full-time employment and salaries are small and insignificant, but blacks are much more likely to obtain “good” jobs than are whites with similar credentials.28
As noted earlier, white-black comparisons at the bottom of the index distribution may be biased by endogenous matriculation. Columns 4-6 of Table 5 present white-black gaps among students in the upper four-fifths of the distribution. Only a quarter of black students fall into this category, but estimates are nevertheless reasonably precise. On average, black students in this subgroup pass the bar at rates only 1.7 percentage points (s.e. 2.0) lower than do similarly-qualified white students. Employment outcomes are uniformly better for blacks than for whites, even in the raw data but particularly after reweighting. The
28 The “good jobs” effect is driven by the “prosecutor” and “large firm” categories: Blacks are much
more likely than whites with the same credentials to be in these categories. Blacks are much less likely to work at small firms or in solo practice and somewhat more likely to work for government agencies.
only indication of mismatch is in GPAs, where black underperformance is worse than it was in the full sample. This suggests that the sample restriction has not eliminated black-white gaps in admissions prospects, so any mismatch effects should be apparent even in the subsample.
The black-white comparison—which is likely biased toward overstating mismatch— thus indicates zero or a small negative effect on the bar passage rates of black students in the top four quintiles. In the bottom quintile, the estimated negative effects are substantially larger, consistent either with large mismatch effects or with selection biases deriving from the exclusion of many white applicants not admitted to any law school. The black effect on employment outcomes is positive in the top four quintiles and zero or positive in the bottom quintile, despite any selection bias.
To convert our estimates of Δp
( )
X into estimates of the mismatch function M(1, X), we divide by the affirmative action effect on selectivity. We explore two measures of selectivity. First, we treat our dichotomous measure, clearly a poor proxy, as true selectivity. Figure 2 showed the black-white gap in enrollment at schools in the two most selective clusters, which we take as an estimate of -Δs( )
X . Dividing the gap in bar passage rates from Figure 6B by (the negative of) this affirmative action effect on admission yields an estimate of the mismatch function, M(1, X). This is graphed as the solid line in Figure 7. As might be expected from the previous results, this mismatch function is large and negative in the bottom quartile of the qualifications distribution but is close to zero elsewhere.The point estimates of M(1, X) are clearly incorrect, as they indicate that selective schools depress graduation rates of the least qualified students by much more than 100 percentage points. This reflects limitations of our proxy for admissions preferences, Δs
( )
X , which is particularly poor at the bottom of the X distribution where preferences at lessselective schools are more relevant than those for the few students admitted to the most selective schools. The dashed line in Figure 7 derives from an alternative computation that uses the log-odds ratio,
(9)
[
[
]
]
[
[
]
]
⎟⎟ ⎠ ⎞ ⎜⎜ ⎝ ⎛ = = = = − = = − = = X X b s E X X b s E X X b s E X X b s E i i i i i i i i i i i i , | , | * , | , | ln 0 0 1 1 1 1 ,as a measure of Δs
( )
X .29 This has a similar pattern to the earlier estimates and a muchmore reasonable scale. The indicated effect of a one standard deviation increase in selectivity is now a sensible -25 percentage points at the very lowest X values. Above the 15th percentile, the mismatch effect is generally smaller than ten percentage points in
absolute value and is as often positive as negative.
VIII.
Conclusion
Absent an experiment that randomly assigns students to schools without regard to their entering credentials, we will never have completely convincing estimates of the causal effect of selective schools on students’ outcomes.30 Researchers and policymakers must
proceed on the basis of non-experimental analyses that can identify mismatch effects only via assumptions about counterfactual outcomes.
This paper has explored two exclusion restrictions, with different likely biases, using data on law students’ graduation rates, bar exam passage rates, and early career employment outcomes. There are many analytical and substantive reasons to study mismatch in law schools, and the Bar Passage Study data are well suited for non-experimental analyses.
29 This would be appropriate if true selectivity had an extreme value distribution conditional on (b, X),
and if our selectivity proxy merely indicated whether true selectivity passed some threshold. M(b, X) =
( )
X s( )
Xp Δ
Δ / then measures the effect of a one standard deviation increase in (latent) selectivity.
We find little support for claims that mismatch is an important consequence of affirmative action in law school admissions.31 We reject large mismatch effects on bar
passage rates for all but the least qualified law school students. For students in the bottom quintile of the entering credentials distribution, the data are consistent with sizable mismatch effects on black bar passage rates but also with differential selection into law school.
Perhaps more significantly, we find zero evidence of mismatch effects on
employment outcomes. Indeed, black students are much more likely to obtain good jobs than are similarly-qualified white students, and those outside of the bottom quintile of the credentials distribution obtain a 15% salary premium. This “reverse mismatch” (Alon and Tienda, 2005) need not mean that black students achieved more academic success, as it could equally well reflect affirmative action on the part of employers. On the other hand, if large law firms are competitive profit-maximizers, the positive black effect on salaries can only mean that black lawyers have higher marginal revenue products than do white lawyers with similar entering credentials. A school that hopes to maximize its graduates’ productivity should cater to firm preferences by itself practicing affirmative action. A crucial question, which we cannot answer, is how firms’ hiring patterns would change if law schools
eliminated affirmative action: If high-paying firms would hire from less selective schools, if necessary, to obtain black lawyers, the black salary premium might persist. Thus, our analysis does not provide unambiguous support for the claim that affirmative action in law school admissions helps black students. It does demonstrate, however, that there is no evidence of negative effects.
31 Sander (2004) makes such claims, using the BPS data and identifying assumptions similar to those
Appendix: Comparing our analysis with Sander (2004)
We find little evidence of negative mismatch effects on black students who rank above the 20th percentile of the entering credentials distribution. This contrasts sharply with
Sander (2004), whose analysis of the same data set leads him to the conclusion that mismatch effects are large. This appendix attempts to account for the differing results, which are attributable to two differences in the analyses. First, Sander adopts a structured specification in which affirmative action affects law school tier, tier affects law school GPA, and tier and GPA determine graduation, bar passage, and other outcomes. Sander finds, as do we, large mismatch effects on law school GPA; in his specification these somewhat mechanically carry through to other outcomes. Second, although Sander also presents reduced-form analyses akin to that in our Figure 6, his presentation obscures the degree to which black-white differences are concentrated at the bottom of the credentials distribution. In fact, his reduced-form results are consistent with ours, showing substantial mismatch effects on graduation and bar passage in the bottom quintile of the index distribution but none or tiny effects outside that range.
We focus here on Sander’s analysis of mismatch effects on dropout rates, and we follow Sander’s variable and sample construction here despite minor differences from the definitions used in the main text.32 We also follow Sander in treating tier (cluster) as a
cardinal variable, ranging in his paper from 1 (the least selective cluster of schools) to 6 (most selective), and we include only linear controls for undergraduate GPA and LSAT scores. The basic differences between the approaches come through even in these very simple specifications.
Appendix Table B demonstrates the differences between the “structured” and reduced-form approaches. Parts III and V of Sander’s paper demonstrate, respectively, that black students attend substantially more selective schools than do white students with the same entering credentials and that blacks obtain lower GPAs in law school. Columns 1 and 2 of Appendix Table B present estimates of specifications for law school tier and first year GPA that, while somewhat different than those that Sander presents, yield similar estimates. Holding constant LSAT and GPA, there is nearly a full cluster difference between the schools that black and white students attend. The between-race difference equals the effect of more than 9 LSAT points (on a 10-48 scale) or 1.2 undergraduate GPA points. Not surprisingly, this affects black students’ law school GPAs, particularly when they are standardized within schools as in the BPS: Black GPAs are 0.7 standard deviations below those of similarly-credentialed whites, an effect as large as that produced by 18.4 LSAT points or 2.5 undergraduate GPA points.
Sander assumes that the black effect in each of these models estimates the causal effect of affirmative action. When he turns to analyze graduation outcomes, he estimates a logistic regression for dropping out that excludes students’ entering credentials but includes
32 Sander counts students who transfer to other schools as non-dropouts, where in our analysis of
graduation rates we count them as non-graduates. His definition also varies somewhat across tables that appear to be considering the same outcomes. (There are students counted as non-graduates in his Table 5.6 who are counted as graduates in his Table 5.7, for example.) These minor differences in definitions do not affect the substantive results. By contrast, differences in our measures of bar passage—Sander excludes students who never took the exam and focuses on first-time passage, while we analyze ever-passing and count non-attempters as non-passers—have more of an impact on the results.