Waltz { An Exploratory Visualization tool for Volume Data,
using Multiform Abstract Displays
Jonathan C. Roberts
Computing Laboratory, University of Kent, Canterbury, Kent, England,UK
ABSTRACT
Although, visualization is now widely used, misinterpretations still occur. There are three primary solutions intended to aid a user interpret data correctly. These are: displaying the data in dierent forms (Multiform visualization); simplifying (or abstracting) the structure of the viewed information; and linking objects and views together (allowing corresponding objects to be jointly manipulated and interrogated).
These well-known visualization techniques, provide an emphasis towards the visualization display. We believe however that current visualization systems do not eectively utilise the display, for example, often placing it at the end of a long visualization process. Our visualization system, based on an adapted visualization model, allows a display method to be used throughout the visualization process, in which the user operates a `Display (correlate) and Rene' visualization cycle.
This display integration provides a useful exploration environment, where objects and views may be directly manipulated; a set of `portions of interest' can be selected to generate a specialized dataset. This may subsequently be further displayed, manipulated and ltered.
Keywords:
Visualization, Visualization system, Multiform, Manipulation, Abstraction1. INTRODUCTION
The adage \a picture is worth a thousand words" provides a powerful incentive for visualizing data. However, what if the picture is incorrect: by algorithmic errors, accumulated during transformations, or inherent in the algorithm at a certain resolution? Then, the user may misinterpret or misunderstand the underlying information.
Understanding phenomena from the underlying data is the main reason for doing visualization. Whether, it is a scientist wanting to discover facts, a user investigating and clarifying the scientists work or a researcher presenting results, the aims are the same: to perceive and gain insight of the underlying data by investigating relationships, dependencies and proportions in the information.
Scientic investigation and exploration is consequently important: as, by manipulating and experimenting with the visual representations the user gains a better, and hopefully more accurate understanding of the underlying information. We state: exploration techniques focusing on interaction methods and the visualization display are useful for `correct information dissemination'.
Our visualization system provides a `display, rene, display' cycle as a series of mini-dataow pipelines, which allow the user to quickly display a representation of the data, and then further rene the visualization.
2. THE CONCEPTS
In real-life, an explorer, wishing to navigate from City A to Town B, would use maps at dierent scales. First, they would look at a map showing an overview of the major road connections; then they would look at a detailed map representation showing the minor roads. The large scale map provides context information for the detailed map. Likewise, in scientic exploration, it is best to understand the information as a whole entity, then look at specic details. This two-level approach provides structured information to the user, who is then, in a better position to understand the detailed information.
From this example, we propose that visualization systems need to adopt this two-level policy, current systems do allow complex and diverse operations, but do not provide tools that encourage the user to use this concept. Moreover,
Other author information:
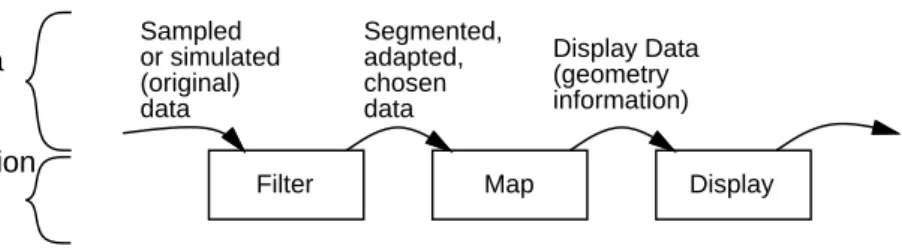
Filter Map Display Data Segmented, adapted, chosen data Display Data (geometry information) Sampled or simulated (original) data Visualization process
Figure 1.
The traditional visualization process: Filter, Map, Displayto achieve this style of exploration on scientic data, as Klinker mentioned,1 imaging tools need to provide interactive
mechanisms, allowing the user to interrogate and understand relationships and dependencies within the information. We believe that there are three primary (and powerful) visualization techniques that aid the user to explore and generate a correct interpretation of the underlying information. First, display the data in dierent forms { Multiform visualization. Second, display the information in simplied Abstract views. Third, provide a high degree of interaction and Direct Manipulation.
Multiform visualization
is the process of displaying the same information in multiple ways.2 This enables the userto understand the information from dierent perspectives, helping to overcome confusion and misinterpretation from believing the result from a singular visualization method. This has been successfully used to display multivariate data, as exemplied by the XmdvTool,3 and we, like Yagel et al,4 advocate techniques that
utilise dierent rendering schemes to uncover dierent aspects in the data.
Abstract views
represent simplied, augmented or structural realizations of the information.5 This techniquegenerates multiform views, as above. However, these views are generated by the same algorithm with dierent simplication criteria. For example, a surface algorithm may be generated at a high resolution with many surface-triangles or a low resolution with fewer triangle-elements, the latter would be rendered faster and provides a simplied version of the information. This simplication is useful for `fast interactive' navigation, as used by the VolVis system,6 for example.
In fact the abstraction may occur at either the data or the image level. At the data level, the information content may be reduced (simplied) by sampling or grouping like objects together; for example, Silver7 segments the
data into groups named Objects, that may be tracked as they evolve and move throughout the data.8 At
the image level, the variable or attributes being mapped onto the display may be altered. For example, the triangles making up the isosurface may be exchanged to lines or points; this would allow otherwise occluded objects to be seen. Alternatively, the position of the objects may be augmented to facilitate the understanding of the data. For example, Sheelagh et al9 use this technique to provide a `clear line of sight' to obscured an
concealed sections of the data.
The abstract views may allow objects that are normally occluded to be seen, or generate a structural view of the whole data. They provide the user with additional information about the structure of the data: useful for a `correct dissemination' of the information.
Direct Manipulation
allows objects within the display to be directly interrogated, scaled and positioned. This interrogation is also propagated to related views of the same data, to provide joint interactive data probing and object manipulation. This is similar to the brushing technique of Ward,3 that allows elements in one viewto be brushed by the mouse, coincidentally highlighting corresponding elements in related views; and similar to the manipulation linking technique used in telecollaboration1or by other systems.10{12
3. THE WALTZEXPLORATION METHOD
The Multiform, Abstract and Manipulation methods are well-known visualization techniques and their emphasis is towards the displayed image. Users wishing to explore the visualization need to concentrate on the visual output and not the visualization process. However, we believe that current visualization systems do not eectively integrate
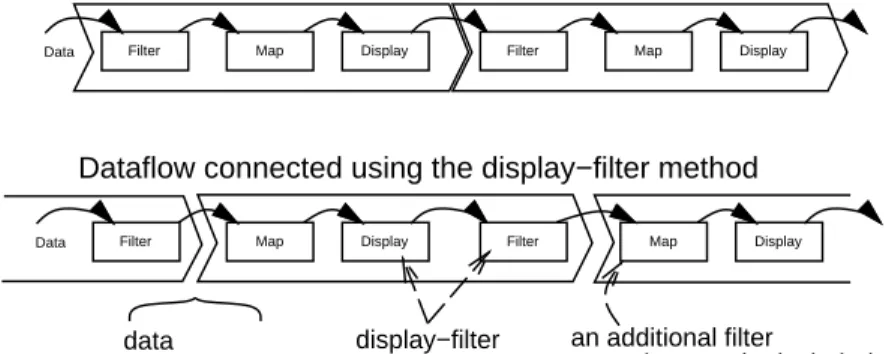
Data Filter Map Display Filter Map Display
Data Filter Map Display Filter Map Display
Traditional connected dataflow pipeline
Dataflow connected using the display−filter method
data specialization display−filter A B an additional filter operation may be included
Figure 2.
The display acting as a lter, that may be further displayed and lteredthe Display into the visualization process, often placing it at the end of a long sequence of commands. This long visualization process is very powerful, comprehensive and extensible, and is often described by the dataow model.
The dataow model describes the visualization process as a series of three processes: lter, map and display. Where, the data is ltered, to create a subset of the data, which is then mapped into a representation which can be displayed, Figure 1. This work is often accredited to Haber and McNabb13 and Upson et al14 and many existing
visualization systems are based on this model.14{18
We believe this lengthy visualization cycle may cause frustration and confusion, leading to information misinter-pretation. One solution is to shorten the visualization cycle. This may be achieved by automating some or all of the visualization tasks, by providing an intelligent user interface. For example, Wood et al19 mention the thesis of
Stead, and the VISTA system20 provides a series of rules that appropriately display the visualization. Such systems
do not emphasise exploration techniques. An alternative method may consequently be generated by integrating the display into the visualization pipeline, by allowing the display to act as the information lter. The ltered data may then be further ltered and displayed.
This lter operation, named a display lter,21 allows the output from one display to be input to another lter
operation, Figure 2B. Thus, the data has been rened through this display-lter, and a new dataset is formed by making a subset from a selection of the initial data elements. We name this new dataset a data specialization, as the information has been specialized. This new dataset may be further ltered and displayed. The diagram, Figure 2B, also shows that the order of the processes has been altered to map, display and lter. This allows some lter process to be omitted, enabling the selected objects to be displayed without being rened. Moreover, the specialized data may be additionally ltered by the receiving mini-pipeline. Obviously, multiple display-lter operations will generate a series of child data-specializations, which may form a data-hierarchy of sub datasets, Figure 3.
Filter Map Display
Filter Map Display
Filter Map Display Filter Map Display
Filter Map Display
The data within any of the data-specializations may be displayed in multiple forms, consequently generating a group of renderers.4 Another visualization method may be added to this display-group by simply requesting the
appropriate method.
The manipulation of elements is also scoped by the render-group. This allows the same objects, but in dierent views, to be jointly manipulated. For example, objects within a surface and a skeleton-display of the same information may be jointly manipulated: scaled, rotated or translated. Our manipulation operations jointly transform the viewing projection (in three dimensions) or highlight and transform individual elements. Additionally, we group together the mapping-attributes, so the hue, colour or transparency (of the mapped objects) may be coincidently altered.
This style of linked-manipulation is similarly implemented in systems, such as, Klinker1 in AVS, KBVision,10
LinkWinds11 and SciAn,12 but, rather than allow the user to join appropriate links, our display-group method
allows the linking to be automatically provided by the system. The links are automatically added to the relevant displays when a new display is added to the list, thus simplifying the user interaction.
The user interface is further simplied by coercing the processes of the mini-visualization-pipeline into one module. This one module allows, through menu selections, the lter, mapping and display operations to be performed. Thus, to create a new module the user selects the export menu, that automatically generates another module. This technique could be described as being a mixture of a Module Building environment and a Menu-based visualization system; because of the user-controllable network, with menu-based commands.
Further, we have developed a module-manager, that automatically positions the modules on the work area, taking the responsibility from the user. A new window is generated for each display, so the manager labels each window with a unique reference number, relating the separate windows to the work-area. The multiform displays persist throughout a visualization session, enabling the displays to provide a `history' of previous experimentations.
Our system incorporates the display as a rst-class-citizen, by including the display operation as an integral part of the visualization process. This encourages and supports the user to, rst, display the same data, and aspects of the data, using dierent rendering schemes. Second, provide direct manipulation of the views and objects within resultant visualizations, to allow the user to directly select objects within the data to enable the data to be ltered. Third, to automatically link corresponding features between visualizations, allowing objects and views to be jointly manipulated. The visualization process then becomes: a process of `Display (correlate) and Rene' operations.
4. EXAMPLES { A USER'S VIEW
The Waltz system has been developed for volume data. We believe the methodology could be easily extended to other data-types, along with the high-level user-interface implementation. However, the low-level data structure would need to be generalized to support other datatypes.
To describe the operation and control of the system, we will work through two example sessions. The rst example uses a test dataset containing concentric three-dimensional layers.
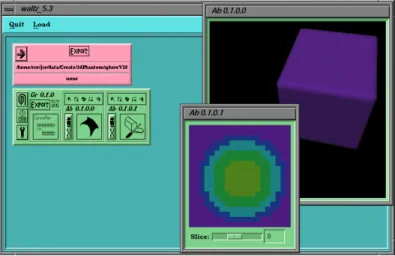
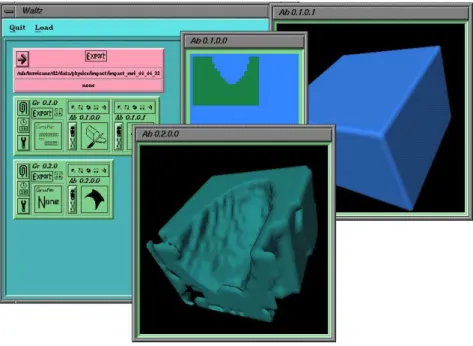
On startup, a clean canvas is presented to the user. A rst module is automatically placed on the canvas when the data is loaded. This rst module displays the le-name, holds the imported data and acts as the root node on the work area. Subsequent `children' modules are always of the display-group type. The lter operation on the rst display-group module is used to process the data elements into objects. Currently, only one algorithm is provided, that clusters the (individual) data elements into sets of similar value. The algorithm uses a ooding technique to threshold and connect the data. Initially, no images are displayed, but additional realizations are added (and deleted) by selecting the appropriate display-group menu. Initially we add a surface rendering; however, as the whole dataset is an object itself, a three-dimensional cube is rendered, and the internal structure remains unseen. Therefore, we add a slice-display, enabling the internal structure to be viewed, Figure 4.
Through our exploration we realize that there are multiple parts to the dataset; we can either re-evaluate the data-segmentation in this module or add another module: as a child of the data-le module. In fact, when the data-segmentation is re-evaluated, each display method (within a display-group) automatically displays the new information.
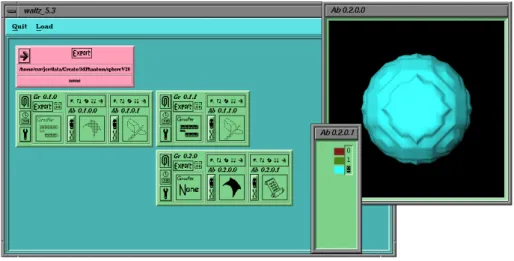
We add another module, Figure 5, this time we process the data into two groups: the interesting-feature and the surrounding air. The feature is selected, consequently highlighted by the system, and a further display-module is generated holding only this feature, to which we add a surface-display and a display, Figure 6. The list-module displays three groups: the object and two padding groups (all the elements outside this and the previous specialization).
Figure 4.
The Waltz work area, showing the data-le module, a grouped-display module (with a slice and surface-display window)Figure 5.
Two new grouped-display modules, evaluated into two interesting-feature, shown by the slice-display Finally, we re-evaluate the grouped-features on this third-module and include a bounding-box abstraction and a slice-display, Figure7. Then some of the elements, specically 3,4,5,6,7 as seen from the list-display, are exported into a fourth group-display module, and a surface-display is added to this module. By methods similar to this the user can explore and focus on specic parts of the information.The second session visualizes the data from a space dust impact simulation; where a stationary block of material is bombarded with a smaller piece of material. The data set describes the pressure in the block. From this data, we wish to both display the main surface and investigate the pressures within the data.
Initially, we divide the dataset into two interesting features: the block and air, Figure 8. Both the slice and surface-display are used to realize the features. The block is then selected and exported to generated the next grouped-display module. This second module is used to display the block surface.
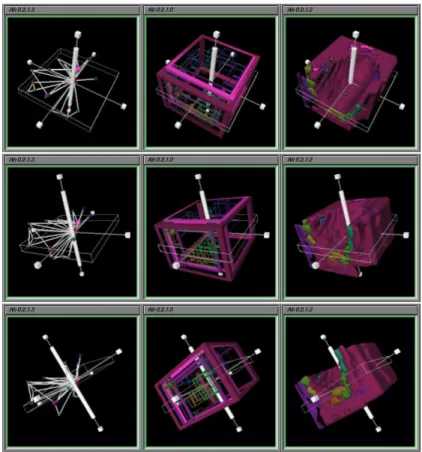
In similar operation to generating the second module, we create a third module. We re-segment the single-object specialization in the third module to generate multiple single-objects. To which, we add surface, bounding-box and network-displays, see Figure 9.
Figure 6.
The Waltz work area, showing the data-le module, a grouped-display module (with two abstractions: the slice-display and a surface-display)Figure 7.
The data in the third module is rened from the one-group into six groups, and realized using the Bounding-box, Surface, list and slice displays.transformed Figure 11. The interaction is automatically directed to the relevant objects of each renderer in a particular display-group.
5. IMPLEMENTATION
The name Waltz is coined from the music term of three parts in four, from the Multiform, Abstract and Manipulation processes within a graphical user-interface.
Waltz has been designed in C++ with classes representing the data, groupings of the data and abstractions, and is implemented over X and Xlib using the Motif widget set, Inventor22 and OpenGL23 libraries. For a detailed
Figure 8.
The rst module is used to segment the data into two features; the impact-block is then selected and exported. The second module displays the surface of the block.Figure 9.
The Waltz work area showing one data-le module with three group-display modules.The module-manager controls the positions of the modules and is controlled using the X callback mechanism. So when a new module is created the manager positions the widgets in the desired position. Likewise, as new display-abstractions are added to the display-group the module-manager is called to update work area.
The module-manager stores the module hierarchy information in a tree data-structure. For convenience the tree has control-structures allowing up and down tree-traversal.
The manipulation within the displays is controlled using both the X callback mechanism and the Inventor manip-ulators. Three dimensional manipulators (jacks) are applied to the objects in the Inventor scene-graph. To generate the linked manipulation within the grouped-display module, the code references one Inventor-manipulator, that is placed in each display-method's scene graph. In fact, individual manipulators can be switched into the graph, to allow specic manipulation. This switch is controlled by a radio-button selection on a Motif-based form.
The data is stored in a DataShadow class, that holds information about the groupings and specializations of the data. Relevant parts of the data are copied and exported from one module to the next. This export operation is controlled explicitly by the system user. Each DataShadow holds the groupings data as an array of slices (similar to24), with a list of the groups and their adjacency information.
Figure 10.
The whole view may be directly manipulated. The control is linked between views within the same display-group. The images show three views being rotated.Figure 11.
Individual data elements may be directly transformed. The control is linked between views within the same display-group. The images depict one group being translated.We have presented a system that provides exploration techniques, especially for the `correct dissemination' of infor-mation. We acknowledge that exploration is only one method to suppress misinterpretation. But we believe it to be an important one! Further work is required in this `correct dissemination' area.
Our system provides methods that encourages the user to perform multiple displays of the same information. It is true that the Module visualization environments (AVS, IRIS Explorer etc,25) allow multiple views, but in our
experience these tend to be expensive: using time, processing and memory resources. Thus, there are some advantages in having multiple lightweight rendering windows, such as provided by Waltz.
The multiform displays persist throughout a visualization session, enabling the displays to provide a `history' of previous experimentations. In fact we believe that abstract techniques are useful, because they provide simpler and diverse interpretations of the underlying information. Although some abstract techniques are meaningless in isolation (such as the list-display) they can act as control-abstractions, and when linked with other views they allow occluded elements, for example, to be selected and manipulated directly.
Other systems such as SciAn12and LinkWinds11provide multiple views of the data in a linked environment, but,
we believe that it is useful to allow the user to lter the data through the display, by segmenting the information into features, and to manage the control of the linked-interaction and the placement of the modules. Other systems, such as the telecollaborative environment described by Klinker1 or the Visualization Input Pipeline26 provide extensible
interactive visualization systems but do not manage either the linked-interaction or the module-layout.
We believe that, by managing the module-layout, the user receives additional information, simplies the network by reducing the need for additional pipes or links and stops the user from `wasting time' moving the modules into a neat layout! Problems with this layout would occur in a long session. Currently, modules may be deleted and the work area scrolled. But it would be benecial to apply a more complicated algorithm, that (say) groups the modules together, and reduces their size, to allow larger networks to be visualized on the work-area.
The intelligent visualization systems take the system and information-management technique to the extreme. For example, the VISTA system20,27 operates by generating an appropriate realization from a list of ordered, and user
preferenced variables. This technique, may be useful for naive and infrequent users but expert users may wish for more control over the generated visualization. Indeed, misinterpretations generated through the wrong-use of the visualization process would be signicantly reduced using an intelligent system approach.
However, an intelligent approach does not allow so much user-exploration; such as provided through a display-lter technique. The display-display-lter method provides an intuitive display-ltering method, albeit harder to implement and less diverse than traditional techniques. In fact, the current implementation only provides one data-segmentation technique, with six display methods. Other techniques have been proposed, but are left for future work. Moreover, the abstraction technique could be applied more vigorously to the current (and future) display methods. The code, was designed to be extensible especially the user interface, but in practice, for each new segmentation or display technique a new sub-class is required, and the system re-compiled.
The multiform linked displays provide a useful exploration environment, however, the user manually compares the displayed realizations. Comparative Visualization techniques28may provide additional information, aiding a correct
information interpretation.
Waltz currently implements selection and transformation styles of linking. Further brushing3and linking1
tech-niques could be implemented. Current research is taking place in this area. Some of the mechanisms could be made into compound operations, for example, an operation may be designed to `look and see', that moved a feature away from its original position and automatically replaced it when the user released control.
7. CONCLUSION
We have presented a visualization system incorporating Multiform, Abstract and Manipulation techniques, for the correct dissemination of scientic information. We have advocated the use of exploration techniques, and acknowledge that exploration is only one method to suppress this misinterpretation.
We propose to develop and extend the Waltz system, to incorporate and provide mechanisms for exploratory visualization and correct dissemination in a user extensible framework.
I acknowledge Steve Hill for his advice on this project, Tim Hopkins for his help, Duncan Langford for proof reading this paper and the University of Kent Physics Laboratory, U.K. for the Impact data.
REFERENCES
1. G. J. Klinker, \An environment for telecollaborative data exploration," in Proceedings Visualization '93 { sponsored by the IEEE Computer Society, pp. 110{117, 1993.
2. P. R. Keller and M. M. Keller, Visual Cues { Practical Data and Visualization, IEEE Computer Society Press, 1993.
3. M. O. Ward, \XmdvTool: Integrating multiple methods for visualizing multivariate data," in Proceedings Visu-alization '94 { sponsored by the IEEE Computer Society, pp. 326{333, 1994.
4. R. Yagel, D. S. Ebert, J. N. Scott, and Y. Kurzion, \Grouping volume renderers for enhanced visualization in computational uid dynamics," IEEE Transactions on Visualization and Computer Graphics
1
, pp. 117{132, June 1995.5. J. C. Roberts, Aspects of Abstraction in Scientic Visualization. Ph.D thesis, Kent University, Computing Laboratory, Canterbury, Kent, England, UK, CT2 7NF, October 1995.
6. R. S. Avila, L. M. Sobierajski, and A. E. Kaufman, \Towards a comprehensive volume visualization system," in Proceedings Visualization '92 { sponsored by the IEEE Computer Society, pp. 13{20, 1992.
7. D. Silver, \Object-oriented visualization," IEEE Computer Graphics and Applications
15
, pp. 54{62, May 1995. 8. R. Samtaney, D. Silver, N. Zabusky, and J. Cao, \Visualizing features and tracking their evolution," IEEEComputer
27
, pp. 20{27, July 1994.9. M. Sheelagh, R. Carpendale, D. J. Cowperthwaite, and F. D. Fracchia, \Distortion viewing techniques for 3-dimensional data," in Proceedings '96 Information Visualization { sponsored by the IEEE Computer Society, pp. 46{53, 1996.
10. Amerinex A.I., Inc, 409 Main Street, Amherst, MA 01002, General Support Tools for Image Understanding, 1992. (http://www.aai.com/AAI/KBV/KBV.html).
11. A. S. Jacobson, A. L. Berkin, and M. N. Orton, \LinkWinds: Interactive scientic data analysis and visualiza-tion," Communications of the ACM
37
, pp. 43{52, April 1994.12. E. Pepke and J. Lyons, SciAn: User's Manual. Supercomputer Computations Research Institute, Florida State University, Tallahassee, Florida, 1993. (http://www.scri.fsu.edu/lyons/scian).
13. R. B. Haber and D. A. McNabb, \Visualization idioms: A conceptual model for scientic visualization systems," in Visualization in Scientic Computing, B. Shriver, G. M. Nielson, and L. J. Rosenblum, eds., pp. 74{93, IEEE Computer Society Press, 1990.
14. C. Upson, T. Faulhaber, D. Kamins, D. Schlegel, D. Laidlaw, F. Vroom, R. Gurwitz, and A. van Dam, \The application visualization system: A computational environment for scientic visualization," IEEE Computer Graphics and Applications
9
(4), pp. 30{42, 1989.15. G. Abram and L. Treinish, \An extended data-ow architecture for data analysis and visualization," in Pro-ceedings Visualization '95 { sponsored by the IEEE Computer Society, pp. 263{270, 1995.
16. D. S. Dyer, \A dataow toolkit for visualization," IEEE Computer Graphics and Applications
10
(4), pp. 60{69, 1990.17. Silicon Graphics Computer Systems { Silicon Graphics Inc., IRIS Explorer Technical Overview, April 1992. (http:// www.nag.co.uk/visual/IE/iecbb/docs/Technical Report.ps).
18. M. Young, D. Argiro, and S. Kubica, \Cantata: Visual programming environment for the Khoros system," Computer Graphics
29
, pp. 22{24, May 1995.19. J. Wood, K. Brodlie, and H. Wright, \Visualisation over the world wide web and its application to environmental data," in Proceedings Visualization '96 { sponsored by the IEEE Computer Society, 1996.
20. H. Senay and E. Ignatius, \A knowledge-based system for visualization design," IEEE Computer Graphics and Applications
14
, pp. 36{47, November 1994.21. W. J. Schroeder, W. E. Lorensen, G. D. Montanaro, and C. R. Volpe, \VISAGE: an object-oriented scientic visualization system," in Proceedings Visualization '92 { sponsored by the IEEE Computer Society, pp. 219{226, 1992.
22. J. Wernecke, The Inventor Mentor: Programming Object-Oriented 3D Graphics with Open Inventor, Release 2, Addison-Wesley, 1994.
23. J. Neider, T. Davis, and M. Woo, OpenGL Programming Guide { The Ocial Guide to Learning OpenGL, Release 1, Addison-Wesley, 1994.
24. K. J. Zuiderveld and M. A. Viergever, \Multi-modal volume visualization using object-oriented methods," in 1994 Symposium on Volume Visualization { Washington, D.C., October 17{18, A. Kaufman and W. Krueger, eds., pp. 59{74, ACM SIGGRAPH and IEEE Computer Society Press, 1994. (VROOM).
25. C. Williams, J. Rasure, and C. Hansen, \The state of the art of visual languages for visualization," in Proceedings Visualization '92 { sponsored by the IEEE Computer Society, pp. 202{209, 1992.
26. W. Felger and F. Schroder, \The visualization input pipeline { enabling semantic interaction in scientic vi-sualization," in Eurographics '92 (Computer Graphics Forum Volume 11 No. 3) { Alistair Kilgour and Lars Kjelldahl Eds., pp. 139{151, Blackwell Publishers, 1992.
27. J. Mackinlay, \Automating the design of graphical presentations of relational information," ACM transactions on Graphics
5
(2), pp. 110{141, 1986.28. H.-G. Pagendarm and F. H. Post, \Comparative visualization - approaches and examples," in Fifth Eurographics Workshop on Visualization in Scientic Computing, May 1994.