ILLINOIS ECONOMIC
and
FISCAL COMMISSION
SENIOR CITIZENS TAX
RELIEF PROGRAMS
OCTOBER 2000 703 Stratton Office Building
ILLINOIS ECONOMIC
and
FISCAL COMMISSION
COMMISSION CO-CHAIRS
Senator Patrick D. Welch
Representative Terry R. Parke
SENATE
Miguel del Valle
Rickey R. Hendon
Chris Lauzen
John W. Maitland, Jr.
Steven Rauschenberger
HOUSE
William E. Brady
Judy Erwin
Frank J. Mautino
Richard Myers
Jeffrey M. Schoenberg
EXECUTIVE DIRECTOR
Dan R. Long
UNIT MANAGER
Jim Muschinske
AUTHOR OF REPORT
Kristi M. Conrad
EXECUTIVE SECRETARY
Donna Belknap
TABLE OF CONTENTS
PAGE
Executive Summary 1
Circuit Breaker Property Tax Relief and Pharmaceutical Assistance 3
Senior Citizen Homestead Exemption 14
Senior Citizens Assessment Freeze Homestead Exemption 16
Senior Citizens Real Estate Tax Deferral Program 17
Income Tax Deduction for Retirement Income 18
Additional Personal Exemption for Senior Citizens 19
Reduced Rate Driver’s License Fees for Senior Citizens 20
Reduced Conservation Fees for Senior Citizens 21
Other Programs 22
TABLES:
1 Illinois Population Statistics 1
2 Illinois Population Statistics Cost Projections (Property Tax Relief) 7
3 Illinois Population Statistics Cost Projections (Pharmaceutical Assistance) 11
4 Additional Costs to the Circuit Breaker Property Tax and Pharmaceutical
Assistance Programs 13
5 Senior Citizen Homestead Exemption 15
6 Senior Citizen Assessment Freeze Homestead Exemption 16
7 Senior Citizen Real Estate Tax Deferral Program 17
8 Income Tax Deduction for Retirement Income 18
9 Additional Personal Exemption for Senior Citizens for the Blind 19
10 Reduced Rate License Plate Fees 20
CHARTS:
1 Property Tax Grant Participants 5
2 Property Tax Grant Dollars 6
3 Cost Projections of Property Tax Relief 8
4 Pharmaceutical Assistance Participants 9
5 Pharmaceutical Assistance Total Cost 9
6 Prescription Cost Per Participant 10
7 Dollar Cost Per Participant 10
8 Pharmaceutical Assistance Cost Projection 12
APPENDIX:
I Circuit Breaker Property Tax Relief 24
II Pharmaceutical Assistance 25
III Cost Projections of Circuit Breaker Property Tax Relief 26
October, 2000
Enclosed is a report on Senior Citizens Tax Relief Programs. The report highlights State sponsored tax relief programs offered to Illinois seniors and the associated costs of the programs.
Recently, the Circuit Breaker Property Tax Grant and Pharmaceutical Assistance Programs have received much attention. Public Act 91-699 modified Program eligibility requirements by raising the income ceiling and covering additional prescription drugs, and thus increasing those who are able to participate. Models (provided in Appendix III and IV) that project conservative, moderate, and aggressive estimates for both programs have been developed to give a possible range of costs that may be attributable to each of the areas in future years.
It should be noted that the Pharmaceutical Assistance Program's costs have the greatest potential to increase dramatically and also have the most variability in costs. This is due to the fact that there are multiple unknown factors that can influence the Program’s costs. Therefore, even the aggressive estimate for the Pharmaceutical Assistance Program which is projected to be $133 million in FY 2001, may be conservative.
Factors that contribute to the Pharmaceutical Assistance Program’s cost variability include the following: it is unknown how many eligibles are afflicted with the particular diseases specified by the Program, the cost of each of the prescription medications that will be covered is uncertain, and it cannot be determined how often and how much each participant will utilize a particular prescription medication. In addition, it is not known how many of the eligibles have insurance that will cover prescription medication. Also, consideration should be given to the fact that new federal mandates related to the Medicare Program’s pharmaceutical coverage are anticipated and may significantly affect this Program.
Because of the previously mentioned reasons, it is almost impossible to accurately predict the number of prescription drugs for each participant and the cost associated with each prescription. However, it is possible to utilize the model provided in Appendix IV and plug in estimated prescription drug and cost figures in order to develop different Pharmaceutical Assistance Program expenditure scenarios. By doing so, it is apparent that the costs of the Pharmaceutical Assistance Program could escalate beyond even aggressively projected estimates. The Commission will provide periodic updates on the Pharmaceutical Assistance Program, as more realistic figures are known and available for review. If you would like any additional copies of this report please contact Donna Belknap at (217) 782-5322. DRL:dkb
enclosure L19 Interested Parties
EXECUTIVE SUMMARY
Currently, approximately 1.4 million or 11.5% of Illinois’ population is 65 or older. As shown in Table 1, it is projected that by 2005, the Illinois senior citizen population will decrease slightly, but still compromise nearly 11.0% of Illinois’ total population. Although the senior citizen to total population ratio is expected to remain relatively constant, the life expectancy of the aging population is increasing as is the cost of sustaining a longer and healthier lifestyle. Therefore, programs offered to seniors are becoming more significant in terms of State tax dollars. This paper provides an overview of tax relief programs offered to seniors. Included are brief descriptions of the programs, as well as data on historical costs and future cost estimates.
TABLE 1
ILLINOIS POPULATION STATISTICS
65 and % of
Year Older Total Population Total
1995 1,451,116 11,829,878 12.27% 2000 1,396,391 12,134,344 11.51% 2001 1,389,575 12,183,995 11.40% 2002 1,382,759 12,233,646 11.30% 2003 1,375,942 12,283,296 11.20% 2004 1,369,126 12,332,947 11.10% 2005 1,362,310 12,382,598 11.00%
SOURCE: Bureau of the Budget Illinois Population Statistics
The following is a list of programs offered by the State of Illinois to its senior citizens:
Senior Citizens and Disabled Persons Property Tax Relief and Pharmaceutical Assistance (The Circuit Breaker Program) - Provides property tax relief and pharmaceutical assistance to low income senior citizens. It is estimated that in 2000, the Program will provide $56.0 million in property tax relief and $45.3 million in pharmaceutical assistance to Illinois’ senior citizens.
Beginning January 1, 2001 legislation will take effect that may significantly increase the cost of the Circuit Breaker Program. Projections indicate that Property Tax Relief Program costs could increase between 12% and 60% and Pharmaceutical Assistance Program costs may rise between 48% and 178%. A substantial increase in funding will be needed in order to cover the forecasted increases in costs, as outlined on pages 8 through 13.
Senior Citizen Homestead Exemption - Provides senior citizen homeowners an exemption against their property taxes. In 2000, it is anticipated that Illinois seniors will save $109.3 million due to the exemption.
Senior Citizen Assessment Freeze Homestead Exemption – Allows qualified senior citizens to maintain the EAVs of their homes at the base year values and prevent any increase due to inflation. The exemption will save seniors an estimated $74.1 million in 2000.
Senior Citizen Real Estate Tax Deferral - Allows qualified low-income senior citizens to defer property taxes. In 2000, it is anticipated that Illinois seniors will defer over $3.4 million in property taxes and lien fees.
Income Tax Deduction for Retirement Income - Allows senior citizens to deduct all qualified retirement income from their base income when calculating State income taxes. Illinois seniors will save approximately $672.4 million in 2000 as a result of the deduction.
Additional Personal Exemption - Allows senior citizens and the blind to exempt an additional $1,000 of income from the Illinois Income Tax. The additional exemption will save Illinois seniors approximately $30.2 million in 2000.
Reduced Rate Drivers License Fees - Allows senior citizens to have discounts on license plate fees and drivers license renewal fees. In 2000, reduced rate license plates will save seniors an estimated $3.9 million.
Reduced Conservation Fees – Provides discounted conservation fees to senior citizens. The information provided is an overview of the tax relief programs offered to Illinois’ senior citizens. More detailed information can be obtained by contacting the Commission.
CIRCUIT BREAKER PROPERTY TAX RELIEF AND PHARMACEUTICAL ASSISTANCE
The Senior Citizens and Disabled Persons Property Tax Relief Act, enacted in 1972, was designed to provide property tax relief to low income senior citizens. According to Illinois Statute, the purpose of the Act is to “provide incentives to senior citizens and disabled persons of this State to acquire and retain private housing of their choice and at the same time to relieve those citizens from the burdens of extraordinary property taxes against their increasingly restricted earning power, and thereby to reduce the requirements for public housing in this State.”
In 1974, an “Additional Tax” Grant was created to offset the State sales tax that seniors incurred when purchasing qualifying food, drugs, and medical appliances. The methodology behind the Grant was that sales tax on necessary goods can “overload” the income of the elderly and disabled. Thus, tax relief may provide assistance, just as a circuit breaker prevents “overloads” in an electrical system. The Additional Tax Grant was phased out in 1992, but the “Circuit Breaker” name remained.
The Pharmaceutical Assistance Program was created in 1985. The Program provides low-income senior and disabled persons access and cost savings to prescription drug medication. Participants purchase coverage at nominal cost and receive approved prescription medication through participating pharmacies. Below is a historical progression of the Circuit Breaker and Pharmaceutical Assistance Programs.
History of Circuit Breaker Property Tax and Pharmaceutical Assistance Program
• 1972 – The Property Tax Relief Program is created.
• 1972 – 1998 - A progressive increase of the income ceiling is established from $10,000 (1972) to $16,000 (1998) per household.
• 1974 – The Additional Tax Grant is created.
• 1982 – The Additional Tax Grant amount is changed from a sliding scale (based on income) to a flat $80 grant.
• 1985 - The Pharmaceutical Assistance Program (only covering cardiovascular medications) is created.
• 1987 – Pharmaceutical assistance is expanded to cover medications for arthritis and diabetes.
• 1991 - The Additional Tax grant is phased out (over two years).
• 1992 - The percentage used in figuring the rent credit is reduced from 30 percent to 25 percent.
• 1992 - A two-tiered structure for Pharmaceutical Assistance coverage is created. The annual coverage cost is $40 if the claimant is single and has a yearly income of $8,050 or less, or if the claimant is married and has a yearly income of $10,850 or less. The annual cost of coverage is $80 if the participant is single and has an income between $8,050 and $16,000, or is married and has an income between
• 1992 - An $800 annual cap on drug benefits and a $5 or $10 co-payment is implemented.
• 1993 - The Pharmaceutical Assistance Program is modified to eliminate the $800 cap and the $5 or $10 co-payment. Instead, claimants pay a $15 (for participants in the $40 tier) or $25 (for participants in the $80 tier) monthly deductible on prescription drugs and 20% of drug costs after the accumulated annual total paid by the program reaches $800.
• 1995 – A list of preferred drugs to control drug costs is implemented; and AlertCare, a drug utilization review is implemented to guard against incorrect dosages and drug interaction.
• 2001 - Income eligibility for the Circuit Breaker Program is increased to $21,218 for a household containing one person, $28,480 for a household containing 2 persons, or $35,740 for a household containing 3 more persons for the 2000 grant year and thereafter.
• 2001 - Prescription drug coverage is expanded to include drugs used to treat cancer, Alzheimer’s disease, Parkinson’s disease, glaucoma, lung disease (and smoking-related illnesses).
• 2001 - The annual coverage cost is changed from $40 to $5 and $80 to $25, depending upon the participant’s income; and the monthly deductible amounts are changed from $15 to a $0 prescription co-payment (for participants in the $5 tier) and from $25 to a $3 prescription co-payment (for participants in the $25 tier).
• 2001 – The yearly accumulated cap is changed from $800 to $2,000 for the 20% beneficiary responsibility.
Eligibility Requirements
To receive assistance, the claimant must:
• be 65 years of age or older before January 1, 2001 or have become 65 years of age during 2001 (for 2000 grant year)
• be 16 years of age or older before January 1, 2001, and totally disabled, or be a widow or widower who turned 63 before the deceased claimant’s death (for 2000 grant year)
• live in an Illinois residence during 2000; that residence must have been subject to property or mobile home taxes during that year (for the 2000 grant year)
• live in Illinois at the time he or she filed the claim
• have a combined household income of less than $16,000 (for the 1999 grant year)
• have income equal to or less than $21,218 for a household containing one person, $28,480 for a household containing 2 persons, or $35,740 for a household containing 3 or more persons (for the 2000 grant year)
• file Form IL-1363, Circuit Breaker and Pharmaceutical Assistance Claim, postmarked on or before December 31, 2001 (for the 2000 grant year)
Analysis of Circuit Breaker Property Tax Relief
The Circuit Breaker Property Tax Relief Program serviced 206,540 participants and provided over $51.7 million of relief to Illinois senior citizens in 1999. As expected,
Program participation and costs have risen since its inception; however, beginning in 1992, both participation and grant dollars awarded have decreased. Possible explanations for the decline may be a decrease of those who meet the income requirements, a lack of knowledge of the program, or simply the lack of desire to participate in the Program. As will be explained later, new legislation that will take effect January 1, 2001 may negate some of these factors. Charts 1 and 2 provide a historical perspective of the Program’s participation and grant dollars awarded (Appendix I provides complete coinciding tables).
As Chart 1 indicates, participation in the Property Tax Grant Program increased significantly during the first five years of the Program. Since 1979, participation in the Program has fluctuated and now has over 206,000 claimants. It is anticipated that participation will increase in future fiscal years due to recent legislation that will increase the income requirement and thus the number of seniors that are eligible for the Program.
CHART 1
Property Tax Grant Participants
0 50,000 100,000 150,000 200,000 250,000 300,000 350,000 1972 1974 1976 1978 1980 1982 1984 1986 1988 1990 1992 1994 1996 1998
Chart 2 indicates that total property grant dollars awarded increased until 1991 and then began to decline steadily. This coincides with the participation trend. It is anticipated that the trend will reverse in future years, and total costs of the program will again increase as the amount of seniors participating in the Program grows.
CHART 2
Amount of the Basic Grant
Once eligibility has been determined, the calculation of the basic grant is quite simple. For claimants having an annual combined household income of less than $14,000, the amount of the grant is the lesser of either:
• Claimant’s Property Tax Bill minus 3.5% of Annual Household Income or
• $700 (the maximum grant allowable) minus 4.5% of Annual Household Income Beginning January 1, 2001, claimants having an annual combined household income between $14,000 and $21,218 for a household containing one person, $28,480 for a household containing two persons, and $35,740 for a household containing three or more persons, the amount of the grant will be $70.
Example:
If an applicant has $12,000 in income and a property tax bill of $800 (or gross rent of approximately $3,200), then the amount of the basic grant would be equal to the lessor of either:
• ($800- ($12,000x.035)) or (800-420) or $380 or
• ($700 – ($12,000x.045)) or ($700 - $540)) or $160.
Property Tax Grant Dollars
0 10,000,000 20,000,000 30,000,000 40,000,000 50,000,000 60,000,000 70,000,000 80,000,000 1972 1974 1976 1978 1980 1982 1984 1986 1988 1990 1992 1994 1996 1998
If the applicant has a household income between $14,000 and $21,218, $28,480, or $35,740 (depending on the number of people in the household), the basic grant will be $70.
Impact of Public Act 91-699 as it Applies to Property Tax Relief
On January 1, 2001, Public Act 91-699 will take effect and increase eligibility and benefits received from the Circuit Breaker Program. As previously stated, the income requirement for those eligible for the Circuit Breaker Program will increase from the current $16,000 per household to $21,218 for one person, $28,480 for two persons, and $35,740 for three persons or more. New eligibles will receive a $70 property tax grant per household.
According to data extrapolated from the United States Census Bureau and the Illinois Department of Revenue, approximately one-third of Illinois’ senior citizen population participates in the Circuit Breaker Program. Three estimates have been developed (and are depicted in Table 2) to reflect the total cost of the property tax grant. The conservative estimate assumes that the percentage of participants will remain at 33% throughout the next five years, the moderate estimate assumes that the percentage of participation will grow to 40%, and the aggressive estimate increases participation to 50%. Depending on whether participation remains the same, or increases significantly, the estimated cost of the Property Tax Grant Program may increase between an estimated $6.2 million (11.7%) to $33.3 million (59.6%) by 2005. Chart 3, on the following page, compares the estimates to one another and Appendix III provides complete tables that support the estimates.
TABLE 2
ILLINOIS POPULATION STATISTICS COST PROJECTIONS Property Tax Relief
Year Conservative Moderate Aggressive
2000 $52,710,793 $55,979,182 $55,979,182 2001 56,259,656 61,449,703 63,156,639 2002 59,771,179 67,093,420 70,720,092 2003 59,476,541 70,371,482 77,589,070 2004 59,181,904 71,818,332 82,591,081 2005 58,887,267 71,460,784 89,325,980
CHART 3
Analysis of Pharmaceutical Assistance
According to Families USA, a healthcare consumer advocate group, prescription drugs are the fastest growing component of health care spending. Nationally, seniors constitute only 13% of the population (Illinois follows closely at 11.5%), but account for 34% of all prescriptions dispensed. It is also estimated that on a national basis, within the next five years the number of prescriptions per senior citizen will increase by 21% and the cost per prescription will rise by 79%.
Increasing demand of prescription drugs, the rising costs of these drugs, and the lack of Medicare coverage of prescription drugs has sparked state and national interest. It is clear that if current trends continue, low-income senior citizens will find it harder to afford needed prescription drugs. Families USA indicates that Illinois is one of 21 states that foresees prescription drug costs being a burden on its low-income senior citizens and therefore offers pharmaceutical assistance to its residents.
Many changes have occurred since the inception of the Pharmaceutical Assistance Program in 1985. Some of the changes include increasing the drugs covered by the program, instituting monthly deductibles and annual fees for claimants, and creating a prescription drug review to prevent overdoses and control drug costs. Charts 4, 5, 6, and 7 depict historical trends of the Pharmaceutical Assistance Program’s participation, total costs, dollar cost per prescription, and dollar cost per participant. Appendix II provides a complete historical table that coincides with the charts.
Pharmaceutical Assistance Program participants gradually increased from 1986 to 1991. In 1992 and 1993 the Program began charging participants for annual coverage, monthly deductibles, and 20% of drug costs once the claimant has exceeded $800 in annual expenditures. These additional costs may have attributed to the large decrease in participation since 1992. It is anticipated that the downward trend will not continue in future years. In fact, participation may increase significantly within the next two
Cost Projections of Property Tax Relief
0 10,000,000 20,000,000 30,000,000 40,000,000 50,000,000 60,000,000 70,000,000 80,000,000 90,000,000 $100,000,000 2000 2001 2002 2003 2004 2005 conservative moderate aggressive
years, due to new eligibility requirements, the increase in drugs that will be covered by the Program, and a decrease in annual and monthly payments that will be charged by the Program.
CHART 4
As shown in Chart 5, the Pharmaceutical Assistance Programs’ total costs followed the participation trend by increasing until 1991, then decreasing thereafter. The decrease in costs can be attributed to the decrease in participation as well as charging participants for a portion of their drug expenditures. Although, the preceding factors cut expenditures, prescription drug prices continued to increase. It is estimated that future costs of the Program will increase significantly, as participation, prescription drug prices, and the amount of drugs covered by the Program are all anticipated to increase. CHART 5
Pharmaceutical Assistance Total Cost
$ 0 $ 1 0 , 0 0 0 , 0 0 0 $ 2 0 , 0 0 0 , 0 0 0 $ 3 0 , 0 0 0 , 0 0 0 $ 4 0 , 0 0 0 , 0 0 0 $ 5 0 , 0 0 0 , 0 0 0 $ 6 0 , 0 0 0 , 0 0 0 $ 7 0 , 0 0 0 , 0 0 0 1986 1987 1988 1989 1990 1991 1992 1993 1994 1995 1996 1997 1998 1999
Pharmaceutical Assistance Participants
0 20,000 40,000 60,000 80,000 100,000 120,000 1986 1987 1988 1989 1990 1991 1992 1993 1994 1995 1996 1997 1998 1999
The prescription cost per participant, for the most part, has increased steadily. This is due to the ever-increasing costs of prescription drugs. It is anticipated that this trend will continue, and may be even more dramatic in the future (See Chart 6).
CHART 6
The dollar cost per participant has risen substantially since 1992. This is due to decreasing participation and increasing prescription costs. This trend is expected to continue, as more prescription drugs are added to the Program, and the drug prices continue to escalate (See Chart 7).
CHART 7 P r e s c r i p t i o n C o s t p e r P a r t i c i p a n t $ 0 . 0 0 $ 5 . 0 0 $ 1 0 . 0 0 $ 1 5 . 0 0 $ 2 0 . 0 0 $ 2 5 . 0 0 $ 3 0 . 0 0 $ 3 5 . 0 0 1986 1987 1988 1989 1990 1991 1992 1993 1994 1995 1996 1997 1998 1999
Dollar Cost per Participant
$0.00 $100.00 $200.00 $300.00 $400.00 $500.00 $600.00 $700.00 $800.00 1986 1987 1988 1989 1990 1991 1992 1993 1994 1995 1996 1997 1998 1999
Impact of Public Act 91-699 on the Pharmaceutical Assistance Program
On January 1, 2001, recently enacted legislation will increase those who are eligible for the Program, the diseases and drugs covered, and the accumulated total that the Program will pay for expenditures before participants pay 20% of medication charges. In addition, it will decrease the annual coverage charges that seniors will be required to pay and change monthly deductible fees to prescription co-payments. All of these factors serve to increase the State’s cost to fund the Pharmaceutical Assistance Program.
Only 8% of low-income Illinois’ seniors currently participate in the Pharmaceutical Assistance Program. Contributing factors may be lack of knowledge of the Program, no need for particular medication that the Program covers, current insurance coverage of prescription drugs, or it is cheaper to purchase the drug out-right rather than to pay annual fees and monthly deductibles. P.A. 91-699 may negate many of these factors. Three estimates have been developed (and are depicted in Table 3) to reflect the future costs of the Pharmaceutical Assistance Program. The conservative estimate assumes that the percentage of participants to total Illinois seniors will remain at 8%, the number of prescriptions per senior will remain at 24.5, and the cost per prescription will increase to $30.24. The moderate estimate assumes that the percentage of participants will increase to 12%, the amount of prescriptions per senior will rise to 28, and the cost per prescription will increase to $31.68. The aggressive estimate assumes that the percentage of participants will increase to 15%, the amount of prescriptions per senior will increase to 32 and the cost per prescription will rise to $33.12. Based on the three estimates, the cost of the Pharmaceutical Assistance Program may rise by $18.3 million (or 48.1%) to $96.3 million (or 177.7 %) within the next five years. Chart 8 compares the three estimates to one another and Appendix IV provides complete tables that support the estimates.
TABLE 3
ILLINOIS POPULATION STATISTICS COST PROJECTIONS
Pharmaceutical Assistance
Year Conservative Moderate Aggressive
2000 $38,023,534 $45,339,716 $54,172,128 2001 57,449,481 94,192,238 133,003,444 2002 57,167,677 102,251,130 152,712,727 2003 56,885,874 101,747,091 151,959,942 2004 56,604,070 101,243,052 151,207,156 2005 56,322,267 100,739,014 150,454,371
CHART 8
Total Additional Cost to the Circuit Breaker and Pharmaceutical Assistance Program
The Circuit Breaker and Pharmaceutical Assistance Program inevitably will incur additional costs due to recent legislation changes. In FY 2001, the cost of expanding the Circuit Breaker Program will be funded, at least partially, from the State’s portion of the tobacco settlement proceeds. The Department of Revenue will receive $35 million in additional funding for anticipated costs related to increasing those who are eligible for the Program, and the Department of Aging will receive $1 million to educate the public about the new rules for circuit breaker pharmaceutical assistance. Table 4, on the following page, provides estimates of the additional funding that may be needed to support both the Circuit Breaker and Pharmaceutical Assistance Programs in future years. Cost estimates for both programs are totaled and compared to 1999’s known program costs. The difference between the figures are provided in the Table 4 (Appendix V provides supporting data). According to the estimates, it appears that a substantial increase in funding may be needed in order to cover the additional costs realized in the moderate and aggressive models. Only if the percentage of participation and program costs remain the same for the next five years will a large increase in funding not be needed.
Pharmaceutical Assistance Cost Projections
0 20,000,000 40,000,000 60,000,000 80,000,000 100,000,000 120,000,000 140,000,000 160,000,000 $180,000,000 2000 2001 2002 2003 2004 2005 conservative moderate aggressive
TABLE 4
ADDITIONAL COSTS TO THE CIRCUIT BREAKER PROPERTY TAX AND PHARMACEUTICAL ASSISTANCE PROGRAMS
Year Conservative Moderate Aggressive
2000* $4,171,883 $14,756,453 $23,588,865 2001 27,146,692 69,079,497 109,597,639 2002 30,376,411 82,782,106 136,870,374 2003 29,799,971 85,556,129 142,986,568 2004 29,223,530 86,498,940 147,235,793 2005 28,647,089 85,637,353 153,217,906
*Public Act 91-699 is not considered in year 2000 figures. Year 2001 includes the full effect of new requirements provided from Public Act 91-699.
EXAMPLE:
Compared to 1999, a moderate estimate for additional funds needed for the Circuit Breaker Programs in 2004 is $86,498,940. A moderate estimate of the incremental cost between years 2003 and 2004 is $942,811.
SENIOR CITIZEN HOMESTEAD EXEMPTION
The Senior Citizen Homestead Exemption Program gives property tax relief to seniors. It allows qualifying senior citizens a $2,000 ($2,500 for seniors in Cook County) maximum reduction from the equalized assessed value of their real property. Eligibility for the Homestead Exemption is based only on age; hence it is not a needs-based program.
Prior to the current Illinois Constitution, homestead exemptions were considered unconstitutional. However, upon adoption of this Constitution they were specifically allowed. Homestead exemptions were later challenged in the Illinois Supreme Court under the Equal Protection Clause of the United States Constitution, but were unanimously upheld.
Eligibility
To be eligible for the Senior Citizen Homestead Exemption the applicant must:
• be an Illinois resident
• be 65 years of age or older
• reside in the house for which property taxes are due or the exemption may be maintained if the owner is admitted to a life care facility and the house remains unoccupied
• be the owner of record or a lessee which is liable for the payment of real estate taxes or a cooperative where a homestead exemption has been granted or the spouse of a qualifying owner, if that owner has subsequently been admitted to a life care facility
Amount of the Exemption
The exemption does not affect State revenue; however, it does lower local government revenues since property taxes are levied and collected locally.
In 2000, an estimated 628,376 homeowners will take the senior citizen homestead exemption. Because this exemption is a reduction in the equalized assessed value or a reduction in the tax base, the amount of savings due to the exemption will vary depending on the local tax rates. However, the average savings due to the exemption can be calculated using an estimated Statewide average property tax rate of 8% in 2000. Using this number, the total cost of the exemption is estimated to be $109.3 million in 2000 (see Table 5 on the following page).
TABLE 5
SENIOR CITIZEN HOMESTEAD EXEMPTION
Year Exemptions# of ReductionEAV RateTax ExemptionTotal of 1993 648,598 $1,424,123,510 7.97% $113,502,644 1994 672,254 1,461,883,359 8.10% 118,412,552 1995 675,452 1,467,634,504 8.05% 118,144,578 1996 674,403 1,468,154,580 8.00% 117,452,366 1997 681,613 1,483,054,621 7.97% 118,199,453 1998* 663,866 1,443,908,550 8.00% 115,512,684 1999* 646,121 1,405,313,175 8.00% 112,425,054 2000* 628,376 1,366,717,691 8.00% 109,337,415 2001* 625,309 1,360,046,336 8.00% 108,803,707 2002* 622,241 1,353,374,980 8.00% 108,269,998 2003* 619,174 1,346,703,624 8.00% 107,736,290 2004* 616,107 1,340,032,268 8.00% 107,202,581 2005* 613,040 1,226,079,000 8.00% 98,086,320
SOURCE: Illinois Property Tax Statistics
SENIOR CITIZENS ASSESSMENT FREEZE HOMESTEAD EXEMPTION
The Senior Citizens Assessment Freeze Homestead Exemption first became available for the 1994 tax year. It allows qualified senior citizens who are 65 years of age or older and have a household income of $40,000 or less ($35,000 prior to January 1, 1999) to elect to maintain the EAVs of their homes at the base year values and prevent any increase due to inflation. This exemption must be applied for annually.
TABLE 6
SENIOR CITIZEN ASSESSMENT FREEZE HOMESTEAD EXEMPTION
# of EAV Tax Total
Year Exemptions Reduction Rate Exemption
1994 170,152 $156,427,458 8.10% $12,670,624 1995 176,906 315,111,814 8.05% 25,366,501 1996 278,271 684,007,372 8.00% 54,720,590 1997 277,292 912,764,484 7.97% 72,747,329 1998* 277,676 916,331,112 8.00% 73,306,489 1999* 278,060 917,598,624 8.00% 73,407,890 2000* 278,444 925,827,243 8.00% 74,066,179 2001* 277,085 921,308,004 8.00% 73,704,640 2002* 275,726 919,546,026 8.00% 73,563,682 2003* 274,367 915,013,196 8.00% 73,201,056 2004* 273,008 911,845,404 8.00% 72,947,632 2005* 271,648 907,305,778 8.00% 72,584,462
SOURCE: Illinois Property Tax Statistics
SENIOR CITIZENS REAL ESTATE TAX DEFERRAL PROGRAM The Senior Citizens Tax Deferral Program allows persons 65 years of age and older who have a total household income of less than $25,000 and meet certain other qualifications to defer all or part of the real estate taxes and special assessments on their principal residences. The deferral is similar to a loan against the property’s market value. A lien is filed on the property in order to ensure repayment of the deferral. The State pays the property taxes and then recovers the money plus 6 percent annual interest when the property is sold. The deferral does not have to be repaid until the taxpayer’s death or when the property is sold, transferred, or ceases to qualify for the program. The deferral must be repaid within one year of the taxpayer’s death or 90 days after the property ceases to qualify for this program. The maximum amount that can be deferred including interest and lien fees is 80 percent of the taxpayer’s equity interest in the property.
TABLE 7
SENIOR CITIZENS REAL ESTATE TAX DEFERRAL PROGRAM
Taxes & Lien
Year Participants Fees Deferred
1993 913 $1,838,472 1994 1,296 2,701,508 1995 1,575 3,253,077 1996 1,624 3,439,766 1997 1,784 3,716,708 1998* 1,731 3,599,787 1999* 1,692 3,520,335 2000* 1,624 3,377,920 2001* 1,616 3,361,431 2002* 1,608 3,344,943 2003* 1,600 3,328,454 2004* 1,592 3,311,965 2004* 1,584 3,295,477
SOURCE: IL Department of Revenue’s Annual Report * Estimated
INCOME TAX DEDUCTION FOR RETIREMENT INCOME
The Income Tax Deduction for Retirement Income allows senior citizens to deduct all qualified retirement income from their base income when calculating State income taxes. The deduction is not needs-based, therefore, it greatly reduces the tax burden for all senior citizens regardless of income level.
When the Illinois income tax began in 1969, no type of retirement income was deductible. Now, it is estimated that Illinois seniors will save over $672.4 million in taxes as a result of the deduction.
The Illinois Income Tax Act allows individuals to deduct the following types of retirement income:
• Individual Retirement Accounts (IRAs), self-employed retirement, H.R. /Keogh plan, or a traditional IRA that has been converted to a Roth IRA
• Redemption of U.S. retirement bonds
• State and local government deferred compensation plans
• Government retirement or government disability plans, including military plans
• Railroad retirement income
• Retirement payments to retired partners
• Lump sum distributions of appreciated employer securities
• Federally taxed portions of Social Security benefits TABLE 8
INCOME TAX DEDUCTION FOR RETIREMENT INCOME
Year w/SubtractionsReturns w/Subtractions% of Returns SubtractedAmount LiabilitiesReduced Avg. TaxSavings
1993 930,595 18.40% $10,268,538,653 $308,056,160 $331 1994 950,110 18.60% 11,763,662,319 352,909,870 371 1995 977,272 18.70% 13,020,947,109 390,628,413 400 1996 1,023,528 19.30% 15,297,380,786 458,921,424 448 1997 1,060,778 19.70% 16,781,979,823 503,459,395 475 1998 1,175,487 21.30% 19,216,820,581 576,504,617 490 1999* 1,210,752 21.62% 20,754,166,227 622,624,987 514 2000* 1,247,074 21.94% 22,414,499,526 672,434,986 539 2001* 1,284,486 22.27% 24,207,659,488 726,229,785 565 2002* 1,323,021 22.61% 26,144,272,247 784,328,167 593 2003* 1,362,712 22.95% 28,235,814,026 847,074,421 622 2004* 1,403,593 23.29% 30,494,679,149 914,840,374 652 2005* 1,445,701 23.64% 32,934,253,480 988,027,604 683
SOURCE: Illinois Dept. of Revenue * Estimated
ADDITIONAL PERSONAL EXEMPTION FOR SENIOR CITIZENS The Additional Personal Exemption for senior citizens and the blind was established in 1969 when the Illinois Income Tax Act was enacted. This allows senior citizens to exempt an additional $1,000 of income from Illinois income taxes.
All taxpayers in the State are now entitled to a $2,000 personal exemption as well as an additional $2,000 exemption for each dependent. However, senior citizens and the blind are also eligible for another $1,000 personal exemption. During the period of 1987-1989, the senior exemption was eliminated, but in 1990, it was restored. The cost of the exemption has remained relatively constant in recent fiscal years.
TABLE 9
ADDITIONAL PERSONAL EXEMPTION FOR SENIOR CITIZENS AND THE BLIND
Year Revenue Lost
1993 $31,000,000 1994 31,000,000 1995 29,800,000 1996 29,800,000 1997 30,000,000 1998 30,282,000 1999 30,200,000 2000* 30,200,000 2001* 30,200,000 2002* 30,200,000 2003* 30,200,000 2004* 30,200,000 2005* 30,100,000
SOURCE: State of IL Tax Expenditures Report * Estimated
REDUCED RATE DRIVER’S LICENSE FEES FOR SENIOR CITIZENS Illinois senior citizens also receive discounts on license plate fees and driver’s license renewal fees. These reduced fees aid senior citizens at a minimal cost to the State. Following is a list of the fee reduction programs for seniors offered by the Secretary of State.
• A $54 discount on license plate fees for senior citizens who qualify for the Circuit Breaker Program (see above for the Circuit Breaker eligibility).
• A 50% discount on the driver’s license renewal fee for all senior citizens over the age of 75.
• An 80% discount on the driver’s license renewal fee for all senior citizens between the ages of 81 and 86.
• A 100% discount on the driver’s license renewal fee for all senior citizens over the age of 87.
• A 100% discount on Illinois photo identification cards for all non-driving senior citizens over the age of 65.
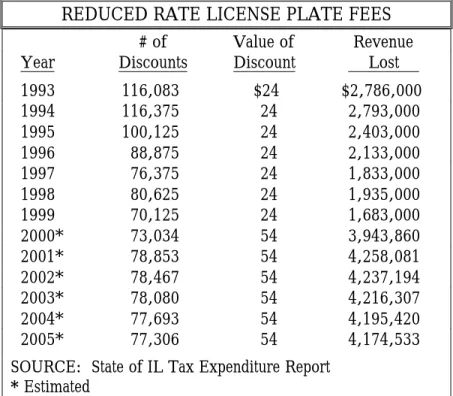
Table 10 indicates the revenue lost due to providing reduce rate drivers license plate fees will more than double between 1999 and 2001. The increase in revenue lost is due to increasing the seniors who are eligible for the Circuit Breaker Program as well as increasing Illinois’ plate fees (from $48 to $78) while keeping the senior rate the same ($24).
TABLE 10
REDUCED RATE LICENSE PLATE FEES
# of Value of Revenue
Year Discounts Discount Lost
1993 116,083 $24 $2,786,000 1994 116,375 24 2,793,000 1995 100,125 24 2,403,000 1996 88,875 24 2,133,000 1997 76,375 24 1,833,000 1998 80,625 24 1,935,000 1999 70,125 24 1,683,000 2000* 73,034 54 3,943,860 2001* 78,853 54 4,258,081 2002* 78,467 54 4,237,194 2003* 78,080 54 4,216,307 2004* 77,693 54 4,195,420 2005* 77,306 54 4,174,533
SOURCE: State of IL Tax Expenditure Report
REDUCED CONSERVATION FEES FOR SENIOR CITIZENS
The Illinois Department of Conservation offers reduced conservation fees to senior citizens. Following is a list of fee reduction programs for seniors.
Camping
Senior citizens between the ages of 62 and 64 can camp at State-managed campgrounds at half the normal rate. Seniors who are 65 or older can camp at these grounds for free. The reduced rate only applies Monday through Thursday.
National Park Visitations
Senior citizens, age 62 or older, are eligible for a free Golden Age Passport. This allows the holder, and anyone accompanying him or her, to visit any Illinois national park for free.
Reduced Rate Hunting and Fishing Licenses
Senior Citizens that are age 65 or older are not required to purchase a hunting or fishing license. They must, however, carry proof of age when hunting or fishing. If they do not have proof of age, then they must obtain a free Golden Years Hunting and Fishing License.
OTHER PROGRAMS
The following is a list of other programs that are available to senior citizens. This list includes programs other than senior tax and fee breaks, and may not be all inclusive of all programs offered to seniors.
Illinois Department on Aging Senior Help Line: 1-800-252-8966
• Community Care – Helps frail older persons stay at home rather than in a nursing home
• Elder Abuse and Neglect Program – Assists seniors who are victims of abuse, neglect, and exploitation
• Employment – Gives information regarding the employment of seniors
• Foster Grandparent Program – Foster grandparents provide attention to children with special problems
• Health Awareness Program – Broadcasts Senior Health Watch (a five minute radio show) and Older and Healthier (a TV show) to sites across the State; also provides free health screenings at community health fairs and the State Fair
• Housing – Provides information on housing options
• Legal Assistance – Provides assistance to older clients in civil cases (elderly abuse, financial exploitation, fraud, etc) and helps prepare living wills and powers of attorney
• Long Term Care Ombudsman Program – Investigates and resolves complaints made about long term care facilities
• Meals Programs – Provides weekday meals at sites throughout the State including senior centers, churches, senior housing facilities, and community buildings
• Publications/Audio –Visual Resources – Provides publications and other materials on senior citizen programs Speakers Bureau –Provides free speakers for senior citizen events
• Transportation Services – Offers transportation services to seniors for congregate meals sites, medical, and dental offices
• Volunteer Programs – Coordinates volunteer programs for seniors Illinois Department of Insurance
• Senior Health Insurance Program - (217) 782-0004 Assists seniors who have problems with health insurance Illinois Department of Public Aid
• Supportive Living Program - Provides an assisted-living option for low-income seniors
Illinois Department of Public Health
• Alzheimer’s Program (217) 782-3300
• Nursing Home Hotline 1-800-252-4343
Investigates complaints regarding nursing homes Illinois Department of Revenue
• Provides low-income senior citizens property tax relief and prescription medication assistance
Illinois Department of Transportation (contact local transportation
authority)
• Provides information on reduced fares for public transportation Illinois Office of the Attorney General
• Consumer Fraud Assistance 1-800-243-0618 or (217) 782-1090 Illinois Office of the Secretary of State
• Reduced rate driver’s license plates 1-800-252-5904 or (217) 785-9364 Illinois Resource Information System Citizens Resource Center
• Internet Site - Provides information about services offered by state, federal, and local governments, nonprofit organizations, and specialized private providers to Illinois citizens
APPENDIX I
CIRCUIT BREAKER PROPERTY TAX RELIEF
Property Tax Relief Grant Additional Grants
Year Participants Grants $ Participants Grants
1972 0 $26,479,202 0 $ 0 1973 110,027 17,199,913 0 0 1974 131,610 20,618,606 0 0 1975 208,713 33,520,417 266,831 21,081,694 1976 281,436 52,421,522 385,875 30,370,949 1977 297,953 52,408,914 431,219 34,145,722 1978 298,173 64,450,840 441,953 35,007,265 1979 260,917 57,381,619 386,331 30,848,139 1980 237,952 55,242,417 373,741 29,914,589 1981 262,962 65,451,096 380,696 30,610,693 1982 231,297 57,260,790 343,263 27,421,165 1983 210,722 52,604,905 317,067 25,343,551 1984 213,013 54,488,089 315,920 25,245,963 1985 215,880 55,134,535 322,369 25,674,424 1986 230,924 60,767,473 352,059 28,047,368 1987 245,076 64,924,252 371,268 29,652,982 1988 258,330 69,368,708 387,090 30,941,257 1989 258,021 69,479,735 382,785 30,561,176 1990 259,447 70,559,303 387,666 30,895,616 1991 263,392 73,725,426 384,216 30,629,423 1992 262,833 72,256,973 337,929 26,992,447 1993 257,847 70,013,283 6,944 553,833 1994 251,687 70,189,814 29 2,319 1995 246,916 69,603,859 14 1,053 1996 232,094 65,216,370 0 0 1997 219,847 62,085,962 0 0 1998 199,298 53,830,413 0 0 1999 206,540 51,746,654 0 0
APPENDIX II
PHARMACEUTICAL ASSISTANCE
Year Participants Prescriptions Amount Paidby Program Participant$ Per Prescription$ Per
Prescriptions Per Participant 1986 24,864 $ 438,400 $ 7,346,400 $295.46 $16.76 17.6 1987 60,157 1,265,936 22,478,704 373.67 17.76 21.0 1988 79,073 2,009,340 38,169,441 482.71 19.00 25.4 1989 87,633 2,402,381 49,776,563 568.01 20.72 27.4 1990 105,144 2,696,965 62,520,551 594.62 23.18 25.7 1991 109,066 2,680,916 62,780,744 575.62 23.42 24.6 1992 102,138 1,752,800 36,971,492 361.98 21.09 17.2 1993 84,362 1,632,580 36,694,629 434.97 22.48 19.4 1994 70,989 1,510,241 34,798,474 490.20 23.04 21.3 1995 67,104 1,438,025 34,063,135 507.62 23.69 21.4 1996 60,847 1,352,383 32,344,681 531.57 23.92 22.2 1997 53,555 1,260,586 31,669,582 591.35 25.12 23.5 1998 50,022 1,171,547 31,098,811 621.70 26.55 23.4 1999 49,186 1,208,815 34,815,790 707.84 28.80 24.6
APPENDIX III
COST PROJECTIONS OF CIRCUIT BREAKER PROPERTY TAX RELIEF
CONSERVATIVE Year 65+ with Income < $15,000 % of Part. Estimated Participants Cost Addt’l Eligible Seniors % of Part. Addt’l Participants Addt’l Cost Total Cost 2000 638,919 33% 210,843 $52,710,793 0 33% 0 $ 0 $52,710,793 2001 635,800 33% 209,814 52,453,496 164,769 33% 54,374 3,806,160 56,259,656 2002 632,681 33% 208,785 52,196,199 327,921 33% 108,214 7,574,980 59,771,179 2003 629,562 33% 207,756 51,938,902 326,305 33% 107,681 7,537,639 59,476,541 2004 626,444 33% 206,726 51,681,605 324,688 33% 107,147 7,500,299 59,181,904 2005 623,325 33% 205,697 51,424,308 323,072 33% 106,614 7,462,959 58,887,267 MODERATE Year 65+ with Income <
$15,000 % ofPart. ParticipantsEstimated Cost
Addt’l Eligible
Seniors % ofPart. ParticipantsAddt’l Addt’lCost TotalCost 2000 638,919 35% 223,622 $55,979,182 0 35% 0 $ 0 $55,979,182 2001 635,800 36% 228,888 57,297,529 164,769 36% 59,317 4,152,175 61,449,703 2002 632,681 37% 234,092 58,600,261 327,921 37% 121,331 8,493,159 67,093,420 2003 629,562 39% 245,529 61,463,363 326,305 39% 127,259 8,908,119 70,371,482 2004 626,444 40% 250,577 62,727,060 324,688 40% 129,875 9,091,272 71,818,332 2005 623,325 40% 249,330 62,414,773 323,072 40% 129,229 9,046,011 71,460,784 AGGRESSIVE Year 65+ with Income <
$15,000 % ofPart. ParticipantsEstimated Cost
Addt’l Eligible
Seniors % ofPart. ParticipantsAddt’l Addt’lCost TotalCost 2000 638,919 35% 223,622 $55,979,182 0 35% 0 $ 0 $55,979,182 2001 635,800 37% 235,246 58,889,127 164,769 37% 60,964 4,267,513 63,156,639 2002 632,681 39% 246,746 61,767,843 327,921 39% 127,889 8,952,249 70,720,092 2003 629,562 43% 270,712 67,767,298 326,305 43% 140,311 9,821,773 77,589,070 2004 626,444 46% 288,164 72,136,119 324,688 46% 149,357 10,454,963 82,591,081 2005 623,325 50% 311,662 78,018,466 323,072 50% 161,536 11,307,514 89,325,980
APPENDIX IV
COST PROJECTIONS FOR CIRCUIT BREAKER PHARMACEUTICAL ASSISTANCE
CONSERVATIVE
Year
65+ with Income <
$15,000 % ofPart. ParticipantsEstimated Cost
Addt’l Eligible
Seniors % ofPart. ParticipantsAddt’l Addt’lCost TotalCost
2000 638,919 8% 51,113 $38,023,534 0 8% 0 $ 0 $38,023,534 2001 635,800 8% 50,864 37,837,930 329,538 8% 26,363 19,611,551 57,449,481 2002 632,681 8% 50,614 37,652,326 327,921 8% 26,234 19,515,352 57,167,677 2003 629,562 8% 50,365 37,466,722 326,305 8% 26,104 19,419,152 56,885,874 2004 626,444 8% 50,115 37,281,118 324,688 8% 25,975 10.322,953 56,604,070 2005 623,325 8% 49,866 37,095,513 323,072 8% 25,846 19,226,753 56,322,267 MODERATE Year 65+ with Income <
$15,000 % ofPart. ParticipantsEstimated Cost
Addt’l Eligible
Seniors % ofPart. ParticipantsAddt’l Addt’lCost TotalCost
2000 638,919 8% 51,113 $45,339,716 0 8% 0 $ 0 $45,339,716 2001 635,800 11% 69,938 62,037,799 329,538 11% 36,249 32,154,440 94,192,238 2002 632,681 12% 75,922 67,345,624 327,921 12% 39,351 34,905,507 102,251,130 2003 629,562 12% 75,547 67,013,649 326,305 12% 39,157 34,733,443 101,747,091 2004 626,444 12% 75,173 66,681,674 324,688 12% 38,963 34,561,379 101,243,052 2005 623,325 12% 74,799 66,349,699 323,072 12% 38,769 34,389,315 100,739,014 AGGRESSIVE Year 65+ with Income < $15,000 % of Part. Estimated Participants Cost Addt’l Eligible Seniors % of Part. Addt’l Participants Addt’l Cost Total Cost 2000 638,919 8% 51,113 $54,172,128 0 8% 0 $ 0 $54,172,128 2001 635,800 13% 82,654 87,600,008 329,538 13% 42,840 45,403,436 133,003,444 2002 632,681 15% 94,902 100,581,126 327,921 15% 49,188 52,131,601 152,712,727 2003 629,562 15% 94,434 100,085,319 326,305 15% 48,946 51,874,622 151,959,942 2004 626,444 15% 93,967 99,589,513 324,688 15% 48,703 51,617,644 151,207,156 2005 623,325 15% 93,499 99,093,706 323,072 15% 48,461 51,360,665 150,454,371
APPENDIX V
TOTAL ADDITIONAL COSTS FOR CIRCUIT BREAKER AND PHARMACEUTICAL ASSITANCE PROGRAMS
FY 2000 1999 Base Year Conservative Moderate Aggressive Property Tax $51,746,654 $52,710,793 $55,979,182 $55,979,182 Pharmaceutical Assistance 34,815,790 38,023,534 45,339,716 54,172,128 Total 86,562,444 90,734,327 101,318,897 110,151,309 Additional Cost to Program 4,171,883 14,756,453 23,588,865
FY 2001 1999 Base Year Conservative Moderate Aggressive Property Tax $51,746,654 $56,259,656 $61,449,703 $63,156,639 Pharmaceutical Assistance 34,815,790 57,449,481 94,192,238 133,003,444 Total 86,562,444 113,709,137 155,641,942 196,160,083 Additional Cost to Program 27,146,692 69,079,497 109,597,639
FY 2002 1999 Base Year Conservative Moderate Aggressive Property Tax $51,746,654 $59,771,179 $67,093,420 $70,720,092 Pharmaceutical Assistance 34,815,790 57,167,677 102,251,130 152,712,727 Total 86,562,444 116,938,856 169,344,551 223,432,819 Additional Cost to Program 30,376,411 82,782,106 136,870,374
FY 2003 1999 Base Year Conservative Moderate Aggressive Property Tax $51,746,654 $59,476,541 $70,371,482 $77,589,070 Pharmaceutical Assistance 34,815,790 56,885,874 101,747,091 151,959,942 Total 86,562,444 116,362,415 172,118,574 229,549,012 Additional Cost to Program 29,799,971 85,556,129 142,986,568
FY 2004 1999 Base Year Conservative Moderate Aggressive Property Tax $51,746,654 $59,181,904 $71,818,332 $82,591,081 Pharmaceutical Assistance 34,815,790 56,604,070 101,243,052 151,207,156 Total 86,562,444 115,785,974 173,061,384 233,798,238 Additional Cost to Program 29,223,530 86,498,940 147,235,793
FY 2005 1999 Base Year Conservative Moderate Aggressive Property Tax $51,746,654 $58,887,267 $71,460,784 $89,325,980 Pharmaceutical Assistance 34,815,790 56,322,267 100,739,014 150,454,371 Total 86,562,444 115,209,533 172,199,797 239,780,351 Additional Cost to Program 28,647,089 85,637,353 153,217,906
BACKGROUND
The Illinois Economic and Fiscal Commission, a bipartisan, joint legislative commission, provides the General Assembly with information relevant to the Illinois economy, taxes and other sources of revenue and debt obligations of the State. The Commission's specific responsibilities include:
1) Preparation of annual revenue estimates with periodic updates; 2) Analysis of the fiscal impact of revenue bills;
3) Preparation of "State Debt Impact Notes" on legislation which would appropriate bond funds or increase bond authorization;
4) Periodic assessment of capital facility plans; and
5) Annual estimates of the liabilities of the State's group health insurance program and approval of contract renewals promulgated by the Department of Central Management Services.
The Commission also has a mandate to report to the General Assembly ". . . on economic trends in relation to long-range planning and budgeting; and to study and make such recommendations as it deems appropriate on local and regional economic and fiscal policies and on federal fiscal policy as it may affect Illinois. . . ." This results in several reports on various economic issues throughout the year.
The Commission publishes two primary reports. The "Revenue Estimate and Economic Outlook" describes and projects economic conditions and their impact on State revenues. "The Illinois Bond Watcher" examines the State's debt position as well as other issues directly related to conditions in the financial markets. The Commission also periodically publishes special topic reports that have or could have an impact on the economic well being of Illinois.
These reports are available from:
Illinois Economic and Fiscal Commission 703 Stratton Office Building
Springfield, Illinois 62706 (217) 782-5320
(217) 782-3513 (FAX)
Reports can also be accessed from our Webpage:
![[ Enterprise Service Bus ]](data:image/gif;base64,R0lGODlhAQABAIAAAP///wAAACH5BAEAAAAALAAAAAABAAEAAAICRAEAOw==)