1
A division of the Colorado Office of Economic Development &
International Trade 1625 Broadway, Suite 2700 | Denver, Colorado 80202 303.892.3840
Research credit: Jane Hansberry, PhD
Connect with us online for more information on our programs /ColoradoCreatives @CO_Creatives
2
May 2015 Dear Colleagues:
I am delighted to share the results of our study of arts education in Colorado. Colorado Creative Industries, a Division of the Office of Economic Development and International Trade, worked with the Colorado
Department of Education to assess the current level of arts education in our schools. The first such study was completed in 2008. With this baseline established, we conducted the 2014 Colorado Visual and Performing Arts Education Survey, which identifies progress, trends, and areas of need.
Understanding that schools have varied approaches to arts education, we endeavored to capture outcomes of different arts education strategies used in Colorado. The survey was designed to identify the level and type of arts education offered in Colorado public schools and was reviewed and approved for distribution by the Colorado Department of Education Educational Data Advisory Committee (EDAC).
There have been significant achievements in arts education since 2008 largely due to two pieces of Colorado state legislation, Senate Bill 212/CAP 4K (2008) and House Bill 1273 (2010). These laws mandated the creation of academic standards in visual and performing arts and have led to district/teacher-created arts assessments, curricular templates, and educator effectiveness resources. Further, these laws ensured the ongoing tracking of arts programming in Individual Career and Academic Plans (ICAPS) for every student, grades 9-12, and creation of a “definition of arts disciplines”, which help districts in understanding that arts are defined, specialized disciplines.
As you will read in the following pages, Colorado has “held the line” on provision of arts education in our public schools. This is no small feat given the tumult of recent years as the nation has struggled to recover from the recession of 2008. In fact, many of the broad trends identified in the 2008 study held firm in the 2014 study. That said, just over 28,000 Colorado students attend schools that do not offer formal arts education. Only half of our high school students are enrolled in arts classes, and educators report that both arts education and community arts partnerships struggle for funds and time in the school day.
The question we pose now: What are the priorities for the future of Colorado arts education? Even as we see the emergence of Colorado’s creative industries, we have not grown arts education commensurately. Colorado is fast becoming known for arts participation, cultural institutions, and creative industries. We can quantify the number of jobs in the creative industries and can look at real growth trend lines for these jobs. Now we challenge ourselves to ensure Colorado students are ready and able to thrive in these jobs.
Additionally, we know arts education affords a myriad of life and learning skills that provide the 21st Century skills ALL employers look for: creative, divergent, critical thinkers who are able to work collaboratively. The study’s preface includes calls to action for educators, parents, and representatives of cultural
institutions. I urge you, as you read the 2014 Arts Ed study, to envision how you will be part of Colorado arts education’s bright future.
Sincerely, Margaret Hunt Director
Colorado Creative Industries 1625 Broadway, Suite 2700 Denver, CO 80202
3
Table of Contents
Margaret Hunt welcome 2
Table of Contents 3
List of figures/tables/graphs 4
Introduction 5
Executive Summary 7
Additional analysis of high-poverty school responses, rural school responses, and comparison of Colorado arts education access and participation with national data 10
Conclusions and Call to Action 13
Methodology 14
Description of Participating Schools and School District 15
Grade levels of schools
Availability of Arts Education in Colorado Public Schools
Percentage of schools with at least some formal arts education 16
Percentage of elementary schools with at least some formal arts education, by arts
discipline and grade level 17
Percentage of middle schools with at least some formal arts education, by arts discipline and grade level 18
Percentage of high schools with at least some formal arts education, by arts discipline and grade level 19
Level of Arts Education in Colorado Public Schools – Volume of Courses & Students Who Receive Instruction
Percentage of students, by grade level clusters, who received arts instruction in 2013-2014 by arts discipline 20
Percentage of students receiving arts education, by grade cluster (unduplicated student count) 22
Percentage of teachers who are certified, “highly qualified,” or alternatively licensed in
art instruction, by arts discipline 23
Minutes of art instruction per week 23
Specific arts courses offered – Elementary schools 24
Specific arts courses offered – Middle schools 26
Specific arts courses offered – High schools 28
Policies, Practices & Perceptions Which Impact Arts Education Levels
Percentage of schools with properly equipped classrooms for arts instruction 30
Highest supervisory level of person responsible for curriculum development, supervision
of arts program, and /or development of student assessment 31
Student performance in art used in GPA/class rank 32
Local arts education graduation requirement 32
Percentage of schools which receive outside funding 32
Change in funding levels in past six years 32
Use of external arts education enhancement activities 33
Percentage of schools which partner with arts organizations/institutions 34
Types of teachers which are incented to develop arts instruction expertise 35
4
List of Figures/Tables/Graphs
Figure 0. Availability of arts education contrasting 2007-2008 and 20132-2014 Figure 1. Grades in responding schools, page 15
Figure 2. % of elementary schools in 2007-2008 and 2013-2014 with at least some formal arts education available to students (by arts discipline and grade), page 17 Figure 3. % of middle schools in 2007-2008 and 2013-2014 with at least some formal arts
education available to students (by arts disciplines and grade), page 18
Figure 4. % of high schools in 2007-2008 and 2013-2014 with at least some formal arts education available to students (by arts disciplines and grade), page 19
Figure 5. % of students by grade clusters who received arts instruction in 2007-2008 and 2013-2014 school year by arts discipline, page 20
Figure 6. % of students receiving formal arts education, page 22 Figure 7. Arts teacher training, page 23
Figure 8. Minutes of arts instruction in elementary schools, page 23 Figure 9. Specific arts classes in elementary schools, page 24 Figure 10. Specific arts classes in middle schools, page 26 Figure 11. Specific arts classes in high schools, page 28 Figure 12. Dedicated classrooms for arts instruction, page 30 Figure 13. Curriculum, supervision, and assessment, page 31
Figure 14. Changes in arts education funding levels over past 6 years, page 32 Figure 15. Use of external source of arts education enhancement activities, page 33 Figure 16. School partnerships with external providers, page 34
Figure 17. How school/external provider partnerships are initiated, page 34 Figure 18. Barriers to school/external provider partnerships, page 34 Figure 19. Teacher development, page 35
Figure 20. Attitudes on factors which impact levels of arts education in schools, page 36
Appendix I Page 37
Introductory and instructional letter sent to school principals Colorado Visual and Performing Arts Education Survey
Appendix II Page 45
List of # of respondent schools by district
Map of respondent schools by Colorado school district Appendix III
Page 47 Resources Bibliography
5
Introduction
The objective of the study was to quantify the level, type and scope of arts education offered and delivered to Colorado public school students, building on the 2008 survey of Colorado visual and performing arts education. The conclusions reached in summarizing and describing the 2014 study’s results refer to the 2008 study.
Results of the 2014 study are presented within the context of the national and state economies and the changing landscape of K-12 education. Since the first study the country has weathered the “great recession”. Since the first study the arts have been defined as a core subject in the No Child Left Behind Act (NCLB) and locally defined as core subjects through Colorado Legislation –SB-212 (CAP4K) and HB-1273 (Arts Education and Workforce
Development). Implementation of these Colorado laws resulted in the 2009 launch of revised Colorado Academic Standards in the Arts (http://www.cde.state.co.us/coarts/statestandards) and development of resources for arts curriculum, instruction
(http://www.cde.state.co.us/coarts/curriculumsupport) and assessment (http://www.coloradoplc.org/assessment).
In the years since the 2008 study the atmosphere in K-12 education around data and testing has intensified for many reasons locally and nationally. Where, then, do the arts sit in this environment? Counter to the increase in data collection in other core subject areas, there does not appear to be a commensurate increase in arts education data collection. The
experience of the researchers and advisory committee to this study was that overall state aggregate data collection was a difficult endeavor in this current climate given widespread concern around data collection and student privacy.
Despite challenges of gathering comprehensive arts education demographic information there has been no shortage of significant research documenting the positive impact of arts education. One recent publication, Dwyer, Reinvesting in Arts Education: Winning America’s Future Through Creative Schools, President’s Committee on the Arts and Humanities, 2011, provides a meta summary of recent research. Doing Well and Doing Good by Doing Art, 2009, Catterall et al and The Arts and Achievement in At-Rick youth: Findings from Four Longitudinal
The United State is competing in a dynamic global economy in which two assets – a skilled, versatile, and highly adaptable workforce, and the capacity for creativity, innovation, and entrepreneurship – provide a decisive edge.
Improving our education system to ignite students’ imagination, foster their creative drive, stimulate innovative thinking, and generate implementable new ideas is vital to the long term economic interests of our nation.
6
Studies, 2012, are longitudinal studies on the impacts of arts education on student
engagement, academic achievement, and social development. See Appendix III for additional arts education research resources.
This study provides descriptive data of: the availability and student enrollment in arts education classes and arts enrichment opportunities; teacher certification; professional certifications of arts teachers; trends in arts education budgets; equipment in classrooms for arts instruction; and, attitudes about arts education. As such, this is a study of “inputs”, not “outcomes”, of arts education. The hope is that as methodology for collection of Colorado arts education data is honed, and with multiple years of data with which to work, future year studies will include inferential analysis that can examine outcomes and correlations of arts education. A call to action proposed by all involved in the 2014 study is a coming together of educators, administrators, and arts education advocates to create a user-friendly, efficient and effective process by which Colorado’s arts education data will be gathered consistently, with 100% participation, in the future.
Many individuals contributed to the completion of the Colorado Performing and Visual Arts Education study. Thank you to: Bruce Caughey, Colorado Association of School Executives; Brian Sevier, PhD and Karol Gates, Colorado Department of Education; Gully Stanford; Mark Hudson PhD, Integrated Arts; Charlotte D’Armond PhD, Scientific and Cultural Collaborative; Jay Seller, PhD, Colorado Thespians and Think 360 Arts for Learning; Mary McCarthy, PhD, Hudson Massachusetts Public Schools; Anne Milliken, RMC Health; Nancy Thoennes, PhD, Center for Policy Research; Liz Buhr, Jefferson County Public Schools; Bryce Merrill, PhD, Biennial of the Americas; Shannon May, Jefferson County Public Schools; Roy Holladay, Boulder Valley Public Schools; J Franklin Horn, Aurora Public Schools and Colorado Music Educators Association; Connie Stewart, PhD, Center for the Integration of Arts Education, University of Northern
Colorado; Tim Gianulis, DPS and Colorado Arts Education Association; Vanessa Hayes-Quintana, Cherry Creek Schools and Colorado Arts Education Association; Judi Hofmeister and Sandra Minton, Colorado Dance Education Association; Carla Aguilar, PhD, Metropolitan State University and Colorado Music Educators Association; Capucine Chapman and John Epps, Denver Public Schools; Tam Frye, Denver Center for the Performing Arts; Jan Rose, Colorado Department of Education; Peter Huidekoper; and Sari Levy, A+Denver Schools.
Finally, we wish to express our deep appreciation and thanks to the principals and arts educators who participated in the survey for this research.
7
Executive Summary
Approximately 20% of Colorado Public Schools provided a detailed description of the size and scope of their formal and informal (extra-curricular) arts education programs via a voluntary survey(see appendix I) in two rounds of data collection: April- May 2014 and then again October-December 2014. The second round of data collection was necessary in order to gain satisfactory sample size. Further, in order to assure a critical mass of data on several quantitative questions researchers worked with arts coordinators in the following Colorado school districts: Boulder Valley; Denver Public Schools; Jefferson County Public Schools; and Thompson Valley Public Schools. The input from these district coordinators and data harvested from their district websites provided a response rate of 33% on several key survey questions including: quantity of arts education offered by grade level; physical plant resources; number of arts faculty and overall faculty; training of teachers; % of grade levels receiving arts
education, and breadth of arts classes offered.
The CO arts education study contained questions in seven key areas:
Demographics
Student learning
Teachers
Teacher Professional development
Space and resources (including funding)
Partnerships with external providers
Attitudes towards arts education Major findings of the study:
Critical Leadership: As a group, 95% of respondents showed very strong support for arts education as an integral and impactful component to a quality education; only a small percentage of respondents (5%) indicated that arts education is not critical to student success on the whole. There are many potential barriers to providing arts education including time and resources. Respondents indicated that support and belief in the importance of arts education by school and district leadership is a critical element to ensure arts program offerings are available to students.
Stable Trends: Persistent local decisions to offer arts programming in the majority of schools and districts in Colorado ensured that Colorado “held the line” on arts education program offerings since the last study in 2008. In the 2014 study 96.7% (versus 93% in 2008) of Colorado public schools offer formal arts education to their students. From this statistic we can conclude there are more than 28,000 students (compared with 29,000 in the 2008 study) who are attending Colorado schools with no formal arts education offerings.
Consistent Program Offerings: When comparing grade level trends since the 2008 study, each grade level remained substantively consistent. 98% of elementary grade schools (K-5) offer some formal arts education to students (93% in 2008). 89% of middle
8
schools (grades 6-8) have formal arts education (86% in 2008), as do 86% of high schools (9-12) (83% in 2008).
Comparative Student Enrollment: When combining all four arts disciplines of Dance, Drama and Theatre Arts, Music and Visual Arts, 98% of elementary school students received some type of arts instruction in the 2014 school year (94% in 2008) 71% of middle school students received some form of arts instruction (66% in 2008) as did 54% of high school students (47% in 2008). It is worth noting that high school students typically have some degree of self-selection in classes taken, and a decreased level of arts education in high schools is not necessarily a reflection of a reduction in high school program offerings.
Quality Instructors: A strength of Colorado arts education program offerings is the prominence and commitment to the use of highly-qualified, licensed arts teachers. 100% of respondents indicated arts programs offered within the school day are taught by licensed arts teacher.
Average Time: The average time students received arts instruction resulted in similar data to the previous study. In 2014, students in Elementary schools received an average of 118 minutes per week of arts instruction compared with 120 minutes per week in the 2008 study. In 2013-2014, 24%of elementary (versus 20% in 2008) schools offered an hour or less of arts education.
Reductions to Budget: The 2014 study indicates that 35% of respondents reported budget reductions. This contrasts with 40% of respondents in the 2008 study reporting budget reduction. The 2014 study indicates that 21% of respondent schools reported an increase of their arts education budget, and 28% reported the same level of funding as in 2008. 22% of respondents in the 2014 study reported they didn’t know this
information.
Dance: Of the four broad arts disciplines examined, Dance was, by far, the least commonly offered. Approximately 16% of elementary schools offer Dance to their students (the figure was 15% in 2008) and slightly more, 23% of middle and high schools, offer Dance to their students (an increase over the 20% of middle and high schools offering dance in 2008).
Breadth and Quality: Colorado schools offer a wide variety of different types of classes/courses in the arts and on the whole, schools show good breadth and progression towards higher level coursework. Additionally, nine out of ten schools report being properly equipped for arts education (as opposed to relying solely on general classroom space). Most Colorado arts education is delivered by certified
teachers. Use of non-certified teachers is uncommon to non-existent, depending on the grade level and arts discipline.
9
GPA and High School Arts Education Requirement: 78% of high schools use student performance in art for GPA/class rank calculations. 64%of high schools have an arts education graduation requirement, (versus 53%) in 2008. Both of these measures fall short of the 100% Colorado set as a standard for itself in HB 1313 in 1993.
Outside Resources: Some schools are being resourceful by reaching out to the community for assistance in providing arts education. Approximately 35% (similar to the approximately 1/3 of schools in the 2008 study) of schools obtain outside funding, and almost as many partner with outside arts organizations/institutions. Leveraging outside resources for arts education is fairly common: 44% of schools received arts instruction from a Visiting Artist in the past school year; more than 60% of all schools reported students participating in arts-related field trips; and, two-thirds of elementary or middle schools had arts-related assemblies. Similar to the 2008 study results,
approximately one in five schools did not avail themselves of any outside resources for arts education enrichment within the past year according to the 2014 study results.
High-poverty schools (defined as the majority of students qualifying for free and reduced lunch, eligible for Title I A funds) Analysis was performed on survey results to determine possible differences in arts education access and participation between responding high-poverty and low-poverty schools. The following significant differences between high and low-poverty schools emerged: High-poverty elementary schools were 30% less likely to offer all 4 arts disciplines. High-poverty elementary schools provide approximately 110 minutes of art instruction per week contrasting with survey average of 118 minutes per week for all Colorado elementary schools. High-poverty middle schools were 20% less likely to offer all 4 arts disciplines. A fuller discussion of high-poverty schools as relates to this study immediately follows this executive summary.
Rural Schools: 93 of schools responding to the study are rural schools (rural areas as defined by the U.S. Census). Comparing the survey answers of rural schools to all other schools in the study brought forward only three areas in which rural schools differed from urban and suburban schools beyond the study’s margin of error. Those three areas are: availability of all 4 arts disciplines in rural elementary and rural middle schools; average arts instruction minutes per week; rural middle schools use of field trips as a teaching tool. A fuller discussion of rural schools as relates to this study immediately follows this executive summary.
There are many potential barriers to providing arts education. School and district leadership must believe in arts education’s value in order for it to be robust, consistent, and high quality. As a group, respondents showed very strong support for the notion that arts education is an integral and impactful component to a quality education; few respondents appear to need convincing that arts education is critical to student success on the whole.
10
Also as a group, respondents in our survey felt that “the amount of time needed for core academic disciplines” (cited by 54%), “budget constraints” (cited by 54%) and “lack of information about arts external providers” (cited by 53%) were nearly equal as barriers to forming external provider partnerships (respondents were asked to check all applicable factors). In other words, time, budget constraints, and lack of information were all cited as barriers, whereas in the 2008 study, time constraints were the predominant reason given for not pursuing external provider relationships.
However, similar to the 2008 study (albeit with smaller budget reductions),
respondents, as a group, were more likely to report reductions in budget allocation for arts instruction than either increases or status quo. Clearly funding plays a role in the ability of schools to provide a full arts education to their students.
Additional Analysis
Analysis of high-poverty school responses
An analysis of high-poverty schools (defined as the majority of students qualifying for free and reduced lunch, eligible for Title I A funds) was performed on survey results to determine possible differences in arts education access and participation between high-poverty and low-poverty schools. The
determination of which respondent school is high-poverty was made by a comparison of survey
respondent schools with Colorado Department of Education data that indicates which schools do and do not receive school-wide Federal Title I A funds. The data sets that represent a 33% response rate relate to broad questions of arts education access and student enrollment. Of those 625 schools represented, 388 are high-poverty schools, approximately 62%. The following significant differences between high and low-poverty schools emerged:
1. High-poverty elementary schools were 30% less likely to offer all 4 arts disciplines than the study average.
2. High-poverty elementary schools provide approximately 110 minutes of art instruction per week contrasting with survey average of 118 minutes per week for all Colorado elementary schools. 3. High-poverty middle schools were 20% less likely to offer all 4 arts disciplines.
The data sets that represent a 20% survey response relate to more nuanced questions of the spectrum of arts classes offered, relationships and services with external providers. Of those 354 schools
represented, 198 are high-poverty schools, approximately 57% of that population sample. The following significant difference between high and low-poverty schools that emerged in analysis of this data:
1. High-poverty elementary and middle schools were slightly less affirmative in answering the question of whether they had received funding from a source outside of the school district to support arts education (approximately 29% of high-poverty elementary and middle schools responded in the affirmative, contrasting with survey average response of 35%).
11
This analysis does not represent an exhaustive analysis of differences between high and low-poverty schools with reference to arts education, only the differences seen in this study. Far more data is needed to undertake a comprehensive analysis of possible differences in arts education based upon poverty levels including and not limited to: teacher and principal attitudes; access to resources from parents and families; parental involvement; community support, and perceived and actual school district support.
Analysis of rural school responses
93 of the 625 respondent schools are rural schools, as defined by the US Census definition of rural area population density. 71 of those schools are elementary, 18 are middle and 4 are high schools (the small sample size of rural high schools does not allow for reliable analysis).
Comparison of rural schools and all other schools resulted in the following significant differences: 1. Rural elementary schools are approximately 50% less likely to have all 4 arts disciplines than
non-rural schools.
2. Rural elementary schools (including high-poverty rural schools) provide on average 125 minutes of arts instruction per week, contrasting with the study average of 118 minutes per week for elementary schools.
3. Rural middle schools are 20% less likely to have all 4 arts disciplines.
4. 40% of respondent rural middle schools report using field trips as a teaching tool contrasting with the overall survey average of 47%.
Analysis of Colorado arts education access rates as contrasted with
national averages
The National Center for Education Statistics of the federal Department of Education, conducted three studies of arts education over the past 20 years. The first study in 1995 was to develop baseline data on public schools’ approaches to arts education. The second study, in 2000, included three new surveys on the educational backgrounds, professional activities, teaching load, and instructional practices of elementary school teachers. The third study, in 2010, built on the previous studies and also included two new surveys for secondary music and visual arts specialists. 1
1 Parsad, Basmat et al Arts Education in Public Elementary and Secondary Schools, 1999-2000 and 2009-2010,
National Center for Education Statistics, Institute of Education Sciences, U.S. Department of Education, Washington DC, 2012
12
Comparison of Colorado art education availability from this study with the data from the 2010 NCES study
Art form % of Colorado elementary
schools providing this art form in 2013-4
% of elementary schools across the nation providing this art form from the 2010 NCES report
Music 94% 94%
Visual Arts 91% 83%
Dance 20% 3%
Theater 13% 4%
Art form % of Colorado secondary
schools providing this art form in 2013-2014*
% of secondary schools across the nation providing this art form from the 2010 NCES report
Music 81% 91%
Visual Arts 76% 89%
Dance 24% 12%
Theater 64% 45%
*this % is an averaging of Colorado middle and high school data
At both the elementary and secondary levels, schools nationally are far more likely to provide music and visual arts than dance and theater.
13
Conclusions and Call to Action
For School administrators: This study shows two important things about Colorado schools. First, on the whole, Colorado school administrators and educators “believe in” the value of arts education. Second, arts education offerings throughout Colorado indicate Colorado has “held the line” on K-12 arts education since 2008. Administrators can use this study to compare and contrast their programming information with state trends and access guidance and support for: development of a strong arts programming strategic plan; development of strong arts standards-based curriculum and assessment planning, and guidance on evaluating arts educators.
For K-12 Arts Educators: This study provides state level reference data in determining the overall state averages around: percentage of course offerings by school level (K-5, 6-8, 9-12); offerings available to students during the school day versus out of school time; level of licensed arts teachers responsible for arts programming; time allotted for arts education instruction; and commitment to dedicated arts education space/resources. Arts educators can use the information in this study to advocate for maintenance or increase of support and resources for arts programming needs at their school or district level. The resources included with this summary can assist in providing guidance and support for strengthening current art programs and/or developing new programs through standards-based planning, curriculum and assessment development, and guidance for educator evaluation.
ForParents: Parents can use the data in this survey and the resources below to ask questions like: Do students receive more than one type of arts education (e.g. music, visual arts, dance and theatre)? Are teachers licensed in the arts? How many hours per week are students instructed? Is there an arts curriculum based on state arts
standards? Answers to these questions can indicate the status of arts education in the school. Another important take-away from this study for parents is simply the fact that many schools and districts in Colorado, a local control state, are committed to inclusion of arts education opportunities for their students.
For Arts Institutions/Organizations: Many schools rely on outside resources to buttress their arts education programs. There is a clear role for cultural organizations to act as specialized partners within the K-12 school system. This study indicates there is great opportunity and strong commitment to continue to forge relationships with principals and teachers in order to bring enriching and innovative real-world arts experiences to students. Arts institutions and organizations can use this study and the resources included in the appendices for support and guidance in determining the best
approaches to supporting and enriching public school arts programs through committed partnerships.
14
Methodology
In April, 2014, The Colorado Association of School Executives contacted 1720 schools electronically, inviting them to participate in the study. An additional 119 schools were contacted from lists gleaned from commercial sources. Survey invitations were sent to school principals at each of these Colorado Public schools. Potential participants were sent a letter of introduction from the Colorado Department of Education (included in Appendix I), which described the nature and purpose of the study. Participants received their survey packets the week of April 20 2014. A reminder email was sent May 15, 2014. First round of data collection ended on May 31, 2014. In order to increase response rate, data collection was resumed in September 2014 and ended December 15, 2014. Similarly to the spring data collection, two reminder emails were sent, one on October 15, 2014, and one on December 1, 2014.
A total of 382 surveys were returned through these two rounds of data collection. 22 surveys were deemed unusable because they were duplicates. 6 surveys were unusable because of a lack of identifying information (no school name) as well as a high number of unanswered questionnaire items. In several instances researchers contacted schools directly in order to obtain missing questionnaire data. Both the unusable and duplicate questionnaires were removed from analysis. The resultant 354 completed surveys entered into analysis represent a response rate of 20%, with a margin-of-error of +/- 5.0 %. This means that the proportional results obtained by the survey are within +/-5.0 % of what we would have found had we surveyed all 1839 Colorado public schools.
The overall survey response rate was increased to 625 schools through data collection facilitated by district staff at the following Colorado school districts: Boulder Valley School District; Denver Public Schools; Aurora Public Schools; Thompson Valley School District and Jefferson County School District. For several questions the response rate is 33%, with a margin-of-error of +/-3.0%. For the questions with a response rate of 33%, the answers directly
15
Participating Schools & School Districts School Districts Represented
(n=625)
Of the 184 public school districts in Colorado, 94 had at least one school participate in the study.
Of the 36 relatively large districts (containing at least 10 schools), all but one had at least one school participate in the study.
A listing of the percentage of schools participating from each school district is included in Appendix II.
Grade Levels
Grades in Participating Schools (n=625)
Q 1. Please indicate the grade levels of your school? (Check all that apply) Figure 1
c
Elementary grade schools tend to be smaller in terms of number of students; therefore, there are more elementary school buildings than middle school or high school buildings. In the 2013-2014 school year the Colorado school count was:
935 elementary schools; 152 elementary-middle schools; 79 elementary-high schools; 263 middle schools; 208 middle-high schools 299 high schools
Approximately 60% of the schools surveyed had at least one K-5 grade. Schools with higher grades (6-12) comprised about 3 in 10 of the surveyed schools. Survey results are approximately
proportional with actual school counts in terms of grades represented.
59 60 60 60 60 59 35 30 33 31 33 33 33 0 10 20 30 40 50 60 70 K 1 2 3 4 5 6 7 8 9 10 11 12 % o f Scho o ls School Grades
16
=232
0)Availability of Arts Education in Colorado Schools
Formal Arts Education
(n=625)
Q 2. Does your school provide any formal arts education to students? By this we mean instructional time set aside specifically for arts education (either visual arts, music, dance, or theater arts), not the use of any art form to assist in other instructional disciplines.
Response 2014 2008
Yes: 97% 93%
No: 2% 4%
Not sure: 1% 3%
Most schools (especially elementary schools) have at least some formal arts education for students depending on school type. Based on these findings, we can estimate that
approximately 28,150 Colorado public school children (the 2008 study indicated 29,000 Colorado public school children) attend schools that do not offer any formal arts education. The chart below depicts availability of arts education, not student participation.
Figure 0 93% 86% 83% 98% 88% 86% 75% 80% 85% 90% 95% 100% K-5 Middle High % o f sc h o o ls blue-2008 orange-2014
% of schools with at least some formal arts
education available to students
17
Grade Levels Receiving Formal Arts Disciplines
Elementary Schools Only (n=295)
Q 3a. Which grade levels in your school will receive at least some formal arts education in each of the four main arts disciplines during the 2013-2014 school year? (Check all the grades that apply for each arts discipline)
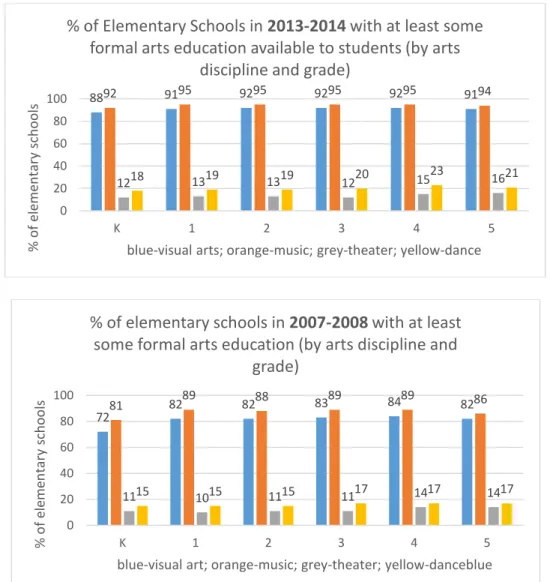
Note: This chart shows the availability of arts education, not actual student participation. At every grade level, the majority of elementary schools offer Visual Arts and/or Music. Theater and Dance are offered far less commonly.
Figure 2 8892 9195 9295 9295 9295 9194 1218 1319 1319 1220 1523 1621 0 20 40 60 80 100 K 1 2 3 4 5 % o f ele m en ta ry s ch o o ls
blue-visual arts; orange-music; grey-theater; yellow-dance % of Elementary Schools in 2013-2014with at least some
formal arts education available to students (by arts discipline and grade)
72 82 82 83 84 82 81 89 88 89 89 86 1115 1015 1115 1117 1417 1417 0 20 40 60 80 100 K 1 2 3 4 5 % o f ele m en ta ry s ch o o ls
blue-visual art; orange-music; grey-theater; yellow-danceblue % of elementary schools in 2007-2008with at least
some formal arts education (by arts discipline and grade)
18
Availability of Arts Education in Colorado Schools Grade Levels Receiving Formal Arts Disciplines
Middle Schools Only (n=192)
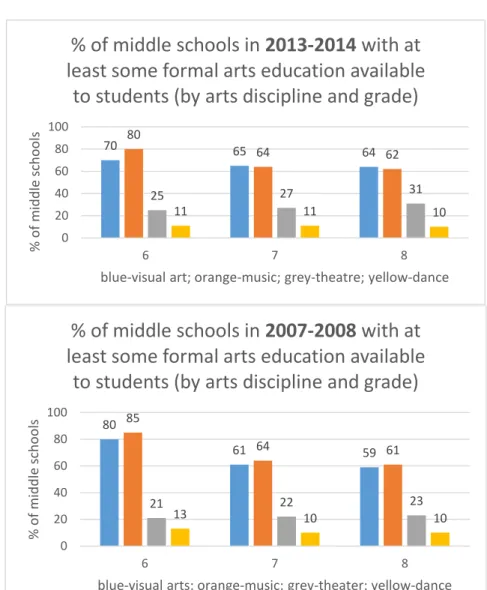
Q 3b. Which grade levels in your school will receive at least some formal arts education in each of the four main arts disciplines during the 2013-2014 school year? (Check all grades that apply for each arts discipline)
Note: This chart shows the availability of arts education, not actual student participation. Figure 3 70 80 65 64 64 62 25 27 31 11 11 10 0 20 40 60 80 100 6 7 8 % o f m id d le sc h o o ls
blue-visual art; orange-music; grey-theatre; yellow-dance
% of middle schools in
2013-2014
with at
least some formal arts education available
to students (by arts discipline and grade)
80 61 59 85 64 61 21 22 23 13 10 10 0 20 40 60 80 100 6 7 8 % o f m id d le sc h o o ls
blue-visual arts; orange-music; grey-theater; yellow-dance
% of middle schools in
2007-2008
with at
least some formal arts education available
19
Level of Arts Education in Colorado Public Schools Volume of Courses and Students who Receive Instruction
Grade Levels Receiving Formal Arts Disciplines
High Schools Only (n=138)
Q 3c. Which grade levels in your school will receive at least some formal arts education in each of the four main arts disciplines during the 2013-2014 school year? (Check all grades that apply for each arts discipline)
Note: This chart shows the availability of arts education, not actual student participation. Figure 4
At the high school level we see more inclusion of Theater in the arts education mix. Dance as an offering was also more common at the high school grades than the lower grades, but not nearly as common as the other three art disciplines in high school.
78% 76% 78%77% 79%76% 77% 74% 63% 65% 65% 64% 24% 24% 23% 23% 0% 10% 20% 30% 40% 50% 60% 70% 80% 90%
Grade 9 Grade 10 Grade 11 Grade 12
Axis
T
itle
Grade levels and arts disciplines
blue-visual arts; orange-music; grey-theater; yellow-dance
% of high schools in
2013-2014
with at least some formal arts
education available to students by arts discipline and grade level%
80% 79% 83%80% 81%79% 80%79% 51% 55% 56% 56% 20% 23% 22% 21% 0% 10% 20% 30% 40% 50% 60% 70% 80% 90%
Grade 9 Grade 10 Grade 11 Grade 12
% o f h igh sch o o ls
Grade levels and arts disciplines
blue-visual arts; orange-music; grey-theater; yellow-dance
% of high schools in
2007-2008
with at least some formal arts
education available to students by arts discipline and grade level
20
Level of Arts Education in Colorado Schools Number of Students receiving formal arts education
(n=625)
Q 4. Please tell us below the number of students you have in each grade cluster, and of those students, how many will receive arts instruction within that arts discipline during the 2013-2014 school year? Note that students may be duplicated in these counts if they receive instruction in more than one arts discipline.
Figure 5
*Summed scores for all responding schools which provided discipline detail]
At the student level, we see that a great majority of elementary school students received Visual Arts and/or Music in the 2013-2014 school year. About two-thirds of middle school students received instruction in those disciplines as well. For all grade levels, a minority of students received instruction in Theater Arts and/or Dance. Comparing and contrasting the 2008 and
91% 94% 13% 20% 66% 68% 27% 10% 32% 24% 11% 5% 0% 20% 40% 60% 80% 100%
Visual Arts Music Theater Dance
% o f stu d en ts
Grade levels and arts disciplines
blue-grades K-5; orange -grades 6-8; grey - grades 9-12
% of students by grade level clusters who received arts
instruction in
2013-2014
school year by arts discipline*
88% 94% 11% 20% 62% 61% 22% 11% 30% 26% 9% 3% 0% 20% 40% 60% 80% 100%
Visual arts Music Theater Dance
% o f stu d en ts
Grade levels and arts disciplines
blue-grades K-5; orange-grades 6-8; grey-grades 9-12
% of students by grade level clusters who received arts
instruction in
2007-2008
school year by arts discipline*
21
2014 study results, it’s clear that basic trend lines are consistent. That is, in the 2008 and 2014 studies a majority of elementary school students received Visual Arts and/or Music, and approximately two-thirds of middle school students received instruction in those disciplines as well. Similarly a minority of students received instruction in Theater Arts and/or Dance.
22
Level of Arts Education in Colorado Schools Number of Students receiving formal arts education
(n=625)
Q 5. Disregarding the art form (visual arts, music, etc.) what number (or percentage) of your total student body will receive some formal art instruction during the 2013-2014 school year? For this count, a student should only be included once, regardless of number of arts classes taken.
Figure 6
Examining unduplicated counts of students obtaining at least some formal arts education, we see that, proportionately, elementary school students are more commonly receiving arts education (98%) than both middle school students (71%) and high school students (54%). This is not surprising, as students at higher grade levels often have discretion in which courses they take.
These percentages compare and contrast with the 2008 study, when 94% of elementary school
students, 66% of middle school students, and 47% of high school students received at least some formal arts education, showing an increase at all grade levels in the 2014 study.
94% 66% 47% 98% 71% 54% 0% 20% 40% 60% 80% 100% 120%
Elementary Middle High
% o f st u d en ts blue-2008 orange-2014
23
Level of Arts Education in Colorado Schools
Teachers at School Who Provide Instruction in Arts Discipline
(n=344)
Q 6 & 7. Of the teachers in your school providing formal instruction in an arts discipline, please check the best descriptor for their training. (Please only list full time equivalencies ((FTE))). Figure 7 (average)# of teachers who provide formal arts education Are certified or have a Colorado Endorsement in arts discipline? “Highly Qualified”* in arts discipline? Have an alternative licensure in arts discipline? Visual Arts 1 1 1 0 Music 2 1 1 0 Theater Arts 1 1 1 0 Dance** 0 0 0 0
* In accordance with the No Child Left Behind Act, Colorado defines “Highly Qualified” Teachers as teachers who are fully licensed, hold at least a Bachelor’s degree, and are able to
demonstrate subject matter competency in their assigned academic area.
**Respondents were asked to list full time equivalencies only; many dance educators work at several schools, dividing their time, thus may not have been listed by their respective schools.
Instruction Time per Week: Minutes of art instruction
(n=279)
Q 8. How many minutes per day do your students receive instruction (all academic disciplines, not just art)? On average, Colorado K-12 schools provide 359 minutes of instruction per day. Q 9. For students who receive art instruction (any arts discipline), how many minutes of instruction do they receive each week? (Schools with Elementary Grades, K-6 only) Figure 8
Minutes of instruction Percentage of students
60 minutes or less 25% (up from 20% in 2008)
61-120 minutes 39% (up from 30% in 2008)
121-180 minutes 21% (down from 30% in 2008)
181+minutes 15% (down from 20% in 2008)
On average, Colorado elementary school students are receiving 118 minutes of formal arts education per week (down from 120 minutes in 2008). In 2014 more students are receiving either 60 minutes or less or from 61-120 minutes per week; similarly, fewer students are on the higher end of the minutes of instruction per week (121-180 minutes per week or more than 181 minutes).
24
Level of Arts Education in Colorado Schools: Specific Arts Courses – Elementary Schools
(n=278)
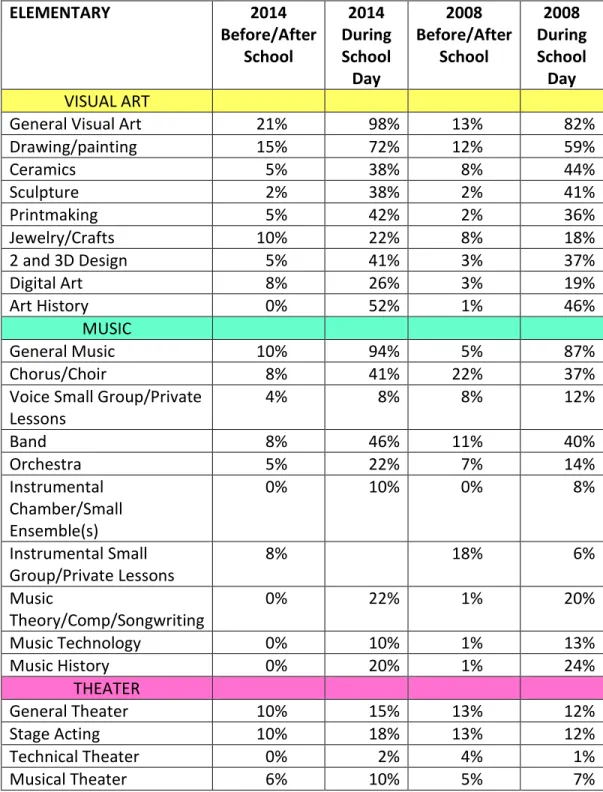
Q 10a. Some schools provide a variety of arts courses or classes within some or all of the four arts disciplines. Please tell us if your school provides any of the following to students, either as part of the normal school day, or before/after school hours.
Figure 9 ELEMENTARY 2014 Before/After School 2014 During School Day 2008 Before/After School 2008 During School Day VISUAL ART
General Visual Art 21% 98% 13% 82%
Drawing/painting 15% 72% 12% 59% Ceramics 5% 38% 8% 44% Sculpture 2% 38% 2% 41% Printmaking 5% 42% 2% 36% Jewelry/Crafts 10% 22% 8% 18% 2 and 3D Design 5% 41% 3% 37% Digital Art 8% 26% 3% 19% Art History 0% 52% 1% 46% MUSIC General Music 10% 94% 5% 87% Chorus/Choir 8% 41% 22% 37%
Voice Small Group/Private Lessons 4% 8% 8% 12% Band 8% 46% 11% 40% Orchestra 5% 22% 7% 14% Instrumental Chamber/Small Ensemble(s) 0% 10% 0% 8% Instrumental Small Group/Private Lessons 8% 18% 6% Music Theory/Comp/Songwriting 0% 22% 1% 20% Music Technology 0% 10% 1% 13% Music History 0% 20% 1% 24% THEATER General Theater 10% 15% 13% 12% Stage Acting 10% 18% 13% 12% Technical Theater 0% 2% 4% 1% Musical Theater 6% 10% 5% 7%
25 Film Study 5% 8% 1% 0% Video Production 5% 10% 3% 4% DANCE General Dance 8% 15% 5% 13% Ballet 0% 2% 4% 0% Modern 0% 2% 1% 3% Jazz 0% 2% 0% 1% Social 0% 5% 2% 4% World/Multicultural 0% 10% 2% 7%
26
Level of Arts Education in Colorado Schools
Specific Arts Courses – Middle Schools
(n=145)
Q 10b. Some schools provide a variety of arts courses or classes within some or all of the four arts disciplines. Please tell us if your school provides any of the following to students, either as part of the normal school day, or before/after school hours:
Figure 10 MIDDLE SCHOOLS 2014 Before/After School 2014 During School Day 2008 Before/After School 2008 During School Day VISUAL ART
General Visual Art 4% 94% 14% 87%
Drawing/painting 4% 80% 11% 73% Ceramics 2% 58% 8% 51% Sculpture 0% 30% 3% 36% Printmaking 4% 32% 3% 30% Jewelry/Crafts 5% 30% 9% 22% 2 and 3D Design 0% 50% 3% 42% Digital Art 10% 45% 5% 28% Art History 0% 30% 2% 45% MUSIC General Music 0% 80% 4% 70% Chorus/Choir 20% 45% 25% 54%
Voice Small Group/Private Lessons 25% 10% 20% 10% Band 20% 62% 13% 72% Orchestra 20% 18% 28% 20% Instrumental Chamber/Small Ensemble(s) 5% 5% 11% 9% Instrumental Small Group/Private Lessons 20% 5% 22% 8% Music Theory/Comp/Songwriting 5% 25% 1% 21% Music Technology 0% 10% 2% 11% Music History 0% 28% 1% 31% THEATER General Theater 10% 30% 18% 24% Stage Acting 20% 20% 16% 15% Technical Theater 0% 10% 5% 4% Musical Theater 10% 15% 8% 9%
27 Film Study 5% 15% 2% 3% Video Production 10% 20% 6% 11% DANCE General Dance 5% 10% 9% 8% Ballet 0% 0% 1% 0% Modern 0% 5% 2% 3% Jazz 0% 4% 0% 1% Social 0% 5% 2% 2% World/Multicultural 4% 6% 2% 5%
Here we show the specific arts courses or activities offered to students in middle schools within the major arts disciplines. We show both which courses/activities are offered and when they are offered (during the school day or before/after school day).
As with elementary schools (previous page), offerings are made most commonly during the school day. However, most middle schools provide at least one of their specific offerings before/after school.
28
Level of Arts Education in Colorado Schools Specific Arts Courses – High Schools
(n=128)
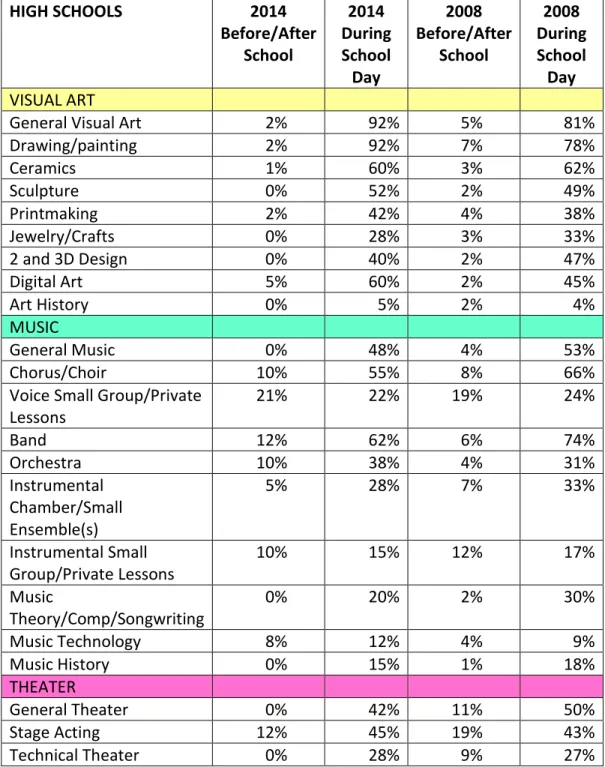
Q 10c. Some schools provide a variety of arts courses or classes within some or all of the four arts disciplines. Please tell us if your school provides any of the following to students, either as part of the normal school day, or before/after school hours:
Figure 11 HIGH SCHOOLS 2014 Before/After School 2014 During School Day 2008 Before/After School 2008 During School Day VISUAL ART
General Visual Art 2% 92% 5% 81%
Drawing/painting 2% 92% 7% 78% Ceramics 1% 60% 3% 62% Sculpture 0% 52% 2% 49% Printmaking 2% 42% 4% 38% Jewelry/Crafts 0% 28% 3% 33% 2 and 3D Design 0% 40% 2% 47% Digital Art 5% 60% 2% 45% Art History 0% 5% 2% 4% MUSIC General Music 0% 48% 4% 53% Chorus/Choir 10% 55% 8% 66%
Voice Small Group/Private Lessons 21% 22% 19% 24% Band 12% 62% 6% 74% Orchestra 10% 38% 4% 31% Instrumental Chamber/Small Ensemble(s) 5% 28% 7% 33% Instrumental Small Group/Private Lessons 10% 15% 12% 17% Music Theory/Comp/Songwriting 0% 20% 2% 30% Music Technology 8% 12% 4% 9% Music History 0% 15% 1% 18% THEATER General Theater 0% 42% 11% 50% Stage Acting 12% 45% 19% 43% Technical Theater 0% 28% 9% 27%
29 Musical Theater 10% 15% 18% 18% Film Study 8% 17% 4% 20% Video Production 10% 28% 5% 32% DANCE General Dance 10% 10% 9% 14% Ballet 0% 4% 3% 5% Modern 0% 3% 4% 6% Jazz 0% 3% 1% 5% Social 0% 2% 2% 3% World/Multicultural 3% 2% 3% 5%
Here we show the specific arts courses or activities offered to students in high schools within the major arts disciplines. We show both which courses/activities are offered and when they are offered (during the school day or before/after school day).
As with the lower grade schools (previous 2 pages), offerings are made most commonly during the school day. However, most high schools (57%) provide at least one of their specific
30
Policies, Practices & Perceptions Which Impact Arts Education Levels Dedicated Classrooms for Arts Instruction
(n=344)
Q 11. Does your school have properly-equipped dedicated or multi-purpose classrooms for arts instruction in…? (Please check all that apply)
Figure 12
Answer Choices Responses in 2014 Responses in 2008
Visual arts 89% 79%
Music 95% 78%
Theatre 33% 10%
Dance 12% 49%
Instruction for arts disciplines is taught in typical classroom space which has not been specifically equipped or modified
9% 8%
The lack of properly equipped instructional space does not seem to be a widespread problem within Colorado schools with the exception of space for teaching dance. There appears to be a reduction in the allocation of properly equipped dance space when one compares the 2008 and 2014 study results. That said, about nine in ten schools have some space modified to meet the needs of art instruction (mostly Visual Arts and Music).
31
Policies, Practices & Perceptions Which Impact Arts Education Levels
Curriculum, Supervision, & Assessment(n=344)
Q 12. Who is responsible for a) arts curriculum development, b) supervision of arts program, and c) development of student assessment in the arts at your school? *
Figure 13 Teachers who provide instruction School-Based Supervisor District-Based Supervisor Curriculum Development 90% 22% 29% Supervision of arts program 62% 56% 19% Development of student assessment 93% 25% 30%
The 2014 and 2008 responses to Question 12 are virtually the same.
* Highest Supervisory Level of Person Responsible for Curriculum Development, Supervision of Arts Program, and /or Development of Student Assessment (Mutually exclusive groups)
32
Policies, Practices & Perceptions Which Impact Arts Education Levels Grade Point Average and Local Graduation Requirements for the Arts
High Schools Only (n=129)
Q 13. Is student performance in arts classes used in the calculation of grade point average or class rank?
Yes: 77%
No: 17% Don’t know: 6%
Q 14. What are the local graduation requirements for the arts? 1-2 credits: 67%
0: 30%
Don’t know 3%
Budget Allocation
(n=321)
Q 15. How would you describe the total budget allocation for arts education in your school compared to 6 years ago? Would you say it has increased, decreased, or stayed about the same? Figure 14
Outside Funding
(n=344)
Q16. In the previous school year, did your school receive funding from a source outside of the school district to support arts education?
Yes 35% No 65% Increased (Please specify % increase) Decreased (Please specify % decrease) Same level of funding as six years ago Unknown Series1 20.8% 34.9% 27.6% 21.4% 20.8% 34.9% 27.6% 21.4% 0.0% 5.0% 10.0% 15.0% 20.0% 25.0% 30.0% 35.0% 40.0% % o f ch an ge in fu n d in g lev els
33
Policies, Practices & Perceptions Which Impact Arts Education Levels
Use of External Sources of Arts Education Enhancement Activities: Student Participation
(n=349)
Q 17. In the previous school year, which of the following did any or all of your students participate in through your school? (Multiple responses accepted).
Figure 15
2014 2008
Received instruction from a visiting artist – elementary
42% 37%
Received instruction from a visiting artist – middle
40% 40%
Received instruction from a visiting artist – high
46% 42%
Elementary field trips to arts organizations or institutions
60% 64%
Middle school field trips to arts organizations or institutions
47% 55%
High school field trips to arts organizations or institutions
47% 43%
Elementary participated in arts-related assemblies
58% 67%
Middle schools participated in arts-related assemblies
53% 67%
High schools participated in arts-related assemblies
51% 81%
None of the above – elementary
10% 17%
None of the above – middle 18% 20%
34
Q 18. Does your school have a formal partnership with one or more area arts organizations or institutions to enhance art instruction for students?
Figure 16
Yes in 2014 Yes in 2008
Elementary Schools 34% 26%
Middle Schools 30% 24%
High Schools 28% 24%
More schools report formal partnerships with one or more area organizations or institutions to enhance students’ art instruction in 2014 than in 2008.
Q 19. If yes, how was that partnership initiated (please check all that apply)? Figure 17
2014 study (not asked in 2008 study)
Teachers 72% n/a
Principals 45% n/a
Parents and parent associations
45% n/a
Outreach from cultural organization
40% n/a
Q 20. If no, what are the barriers? (Check all that apply)
Figure 18
2014 study (not asked in 2008 study)
Budget constraints 54% n/a
Time constraints 54% n/a
Lack of information about external providers
53% n/a
**Other
Most common “other” barrier cited: remote location of school and difficulty of
travelling to arts organizations and institutions
35
Policies, Practices & Perceptions Which Impact Arts Education Levels Teacher Development
(n=321)
Q 21. Which teachers are encouraged through incentives (time off to participate, professional development credits, etc.) to develop their arts instruction expertise? (Please check all that apply)
Figure 19
2014 study 2008 study Elementary school arts
teachers
64% 66%
Middle school arts teachers
59% 69%
High school arts teachers
72% 74%
Other elementary teachers
24% 28%
Other middle school teachers
22% 28%
Other high school teachers
22% 32%
No elementary teachers receive incentives to develop art instruction expertise
30% 31%
No middle school teachers receive incentives to develop art instruction expertise
26% 28%
No high school teachers receive incentives to develop art instruction expertise
32% 28%
We see in the chart above some reduction of incentives for arts teachers and generalist teachers to develop their arts instruction expertise. The largest decline of incentives noted when contrasting the 2008 and 2014 data to participate in arts instruction professional development is middle school arts teachers.
36
Policies, Practices & Perceptions Which Impact Arts Education Levels
Attitudes on factors which impact levels of arts education in schools
(n=307)
Q 22. Based on your experience, please tell us your level of agreement or disagreement with the following, using the scale 1=Completely Disagree and 5=Complete Agree
Figure 20
Question Weighted
average
Students-at-risk are less likely to drop out of school if arts instruction is available at their school
4.33
Art instruction helps to better prepare students for future education and/or the work world
4.44
Art instruction helps students do better in academic disciplines
4.50 The content taught in an art class is an
important part of a quality public education experience
4.66
Arts programming enhances parental involvement in our school
4.06 Access to knowledge about careers in
*creative industries could provide increased motivation to provide arts instruction
4.16
*creative industries include, but are not limited to: advertising, architecture, art, crafts, design, fashion, film, software development, toys, TV and radio, video games.
37
Appendix I
pendix I
April 2, 2014 Dear Principal:As you read in Brian Sevier and Karol Gates’ letter earlier this week, Colorado Creative Industries (CCI), is working with the Colorado Department of Education to assess the current level of arts education in Colorado schools. The baseline for this survey was established in 2008 and we are following up to identify progress, trends, and areas of need.
To do this, we need your help. We understand that many schools approach arts education differently, and we want to capture the variety of strategies used in Colorado. The survey asks you to identify the level and type of arts education offered in your school, and has been reviewed and approved for distribution by the CDE Educational Data Advisory Committee (EDAC).
Please note the following:
We understand not all public schools offer arts education, and instead have other priorities. If that is true for your school, please indicate that on the survey (question 2) and complete the few remaining questions.
Some of the information asked for in the survey may not be readily available; in that case, please provide your best guess estimates.
All information will be held completely confidential. Only you and the research analyst, a third party separate from the State, will have access to your responses. All results will be analyzed and reported in the aggregate.
As a thank-you to all schools who participate, you will receive a customized benchmarking report comparing your school to all other respondents.
As an additional thank you to schools who participate, several of our cultural partners have donated gifts that will be part of a lottery at the end of the survey!
Please do not hesitate to contact Jane Hansberry Ph.D. (the project’s team leader) if there are any questions, concerns or problems related to the survey. Jane can be reached at [email protected]
The survey will be in the field all of April, due April 30th. Specific directions for questionnaire
completion are showed in the introductory paragraph of the survey. Sincerely, Margaret Hunt Executive Director
Colorado Creative Industries 1625 Broadway, Suite 2700 Denver, CO 80202
38
Thank you for your assistance with this important research. Our goal is a simple one – to quantify the level and type of arts education being provided to Colorado public school children. Your responses to this survey will remain completely confidential – no one besides you and the research analyst will see your information. And, you will receive a customized report based on your responses which will provide comparisons to the aggregate responses from all Colorado public schools. That report will also remain confidential and will be given only to you.
Instructions: You may provide the information collected via this survey in one of two ways. The first is to complete the questions via an on-line survey. You may return to complete the survey as many times as necessary. The URL to complete this survey is: (URL to be determined). The second option is to complete the questions using a survey document and self-addressed and stamped envelope you can request from Jane Hansberry at [email protected]. Using either method, please complete and/or return your survey by May 31, 2014. (Subsequent data collection continued through December 2014)
All questions regarding the survey can be directed to Jane Hansberry, Ph.D. at 303.521 3571 or [email protected]
SCHOOL and RESPONDENT INFORMATION
School Name: School District Name:
Total School Enrollment (as of November, 2013):
Respondent Name: Title or area of responsibility:
Telephone: Email Address:
39
1. Please indicate the grade levels of your school (Check all that apply)
K 1 2 3 4 5 6 7 8 9 10 11 12
2. Does your school provide any formal arts education to students? By this we mean instructional time set aside specifically for arts education (either visual arts, music, dance, or theater arts), not the use of any art form to assist in other instructional disciplines.
Yes No [Please skip to Question 15] Not sure [Please skip to Q 15]
3. Which grade levels in your school received at least some formal arts education one or more of the four main arts disciplines during the 2013-2014 school year? If a grade level is not part of your school, just leave it blank. (Check all grades that apply for each arts discipline)
K 1 2 3 4 5 6 7 8 9 10 11 12 Visual Arts Music Theater Dance
4. Please tell us below the number of students you have in each grade cluster, and of those students, how many received arts instruction within that arts discipline during the 2013-2014 school year? Note that students may be duplicated in these counts if they received instruction in more than one arts discipline. Total Number of Students in Grade Cluster Number of Students Receiving Instruction in Visual Arts Number of Students Receiving Instruction in Music Number of Students Receiving Instruction in Theater Arts Number of Students Receiving Instruction in Dance Grades K-5 6-8 9-12
40
Other grade clusters
5. What number (or percentage) of your total student body received some formal arts instruction during the 2013-2014 school year? For this count, a student should only be included once, regardless of number of arts classes taken. Number of students: or % of all students:
6. What is the total number of teachers at your school (please use Full-Time Equivalent if necessary):
7. Of those teachers (FTE), please tell us how many of them provide formal instruction in an arts discipline:
Of the teachers providing formal arts instruction, how many of them…
Number of Teachers (FTE) Who Provide Formal Arts Instruction
Are Certified or have a Colorado Endorsement in arts discipline? “Highly Qualified”* in arts discipline? Have an alternative licensure in arts discipline? Visual Arts Music Theater Arts Dance
*In accordance with the No Child Left Behind Act, Colorado defines “Highly Qualified” Teachers as teachers who are fully licensed, hold at least a Bachelor’s degree, and are able to demonstrate subject matter competency in their assigned academic area.
8. How many minutes per day do your students receive instruction (all academic disciplines, not just art)?
9. This question is for Schools with Elementary Grades, K-6, only. (Schools with Secondary Grades please go to question 10). For students who receive art instruction (any arts discipline), how many minutes of instruction do they receive each week?
____ Minutes Per Day
____ Minutes Per Week