National Centre for Epidemiology and Population Health The Australian National University
Modelling Australia’s Private Health Insurance Industry
Philip Manners
NCEPH Working Paper Number 48 July 2003
This paper outlines a model of the Australian private health insurance industry embedded within Australia’s broader health services structure. The model is used to examine issues such as adverse selection and risk differentiation, and policies such as Lifetime Health Cover, the Medicare Levy Surcharge and the 30% rebate. This analysis gives rise to conclusions regarding future policy development. First, private health insurance cannot be considered outside the broader health framework. Second, Medicare quality may best be improved through changes in private health insurance regulation. Third, a convergence of private health insurance coverage is not necessarily an indication of stability. Finally, risk-differentiation by insurers is unlikely to be successful in Australia’s regulatory environment. The strength of the model revolves around the interaction of differing risk attitude and differing risk type.
ADDRESS FOR CORRESPONDENCE:
NATIONAL CENTRE FOR EPIDEMIOLOGY AND POPULATION HEALTH
THE AUSTRALIAN NATIONAL UNIVERSITY
CANBERRA AUSTRALIA ACT 0200
PHONE: 61 2 6125 2378 FOR COPY OF PAPER FAX: 61 2 6125 0740
Modelling Australia’s Private Health Insurance Industry Philip Manners Phone: 02 6125-2378 Fax: 02 6125-0740 E-mail: Jim.Butler@anu.edu.au ISBN ISSN 1033-1557
© National Centre for Epidemiology and Population Health
Published by the National Centre for Epidemiology and Population Health The Australian National University
Contents
LIST OF TABLES ii
LIST OF FIGURES ii
1. INTRODUCTION 1
2. THE MODEL 4
2.1 The Consumer Choice Curve 5
2.2 The Budget Curve 14
2.3 Conclusions from the Equilibrium Model 15
2.4 Dynamics 16
3. APPLICATIONS OF THE MODEL 19
3.1 Rising costs and subsidies 20
3.2 The Medicare Levy Surcharge 21
3.3 Lifetime Health Cover 25
3.3.1 Risk discrimination 25
3.3.2 Inter-temporal decision making 30
3.4 Part-insurance policies 31
4. CONCLUSIONS 35
APPENDIX 1: Uniqueness of Basic Model 38
List of Tables
Table 1 Key contributors to real increases in hospital insurance 2 premiums, 1989-90 to 1995-96
List of Figures
Figure 1 Percentage of Australian population covered by private 1 insurance
Figure 2 Private health insurance equilibrium 4 Figure 3 The probability weighting function (w(x)) 8
Figure 4 Interior solution in (ρ, α) space (for parameters: Ph=0.8, 13
Pl=0.82, m=0.4, h=l, y=10, S=5)
Figure 5 The equilibrium in (αl,αh) space - reaction functions of 13 consumers
Figure 6 Medicare quality against coverage 14 Figure 7 Adverse selection at its least potent 17 Figure 8 Adverse selection at its most potent 18 Figure 9 The quality of Medicare vs coverage and premiums for 24
the basic and two-income models (m axis distorted)
Figure 10 Degree of risk-discrimination vs coverage for second 29
simulation parameters
1. Introduction
The Australian private health insurance industry has experienced significant changes in both regulation and the number of people insuring in the last decade. Chief among the industry’s worries have been increasing costs and declining coverage, exacerbated by adverse selection problems (Figure 1).
Figure 1: Percentage of Australian population covered by private insurance 0% 10% 20% 30% 40% 50% 60% 70% 80%
Dec-76 Dec-78 Dec-80 Dec-82 Dec-84 Dec-86 Dec-88 Dec-90 Dec-92 Dec-94 Dec-96 Dec-98 Dec-00
Coverage Introduction of
Medicare from 1 February 1984
Introduction of Lifetime Health Cover from 1 July 2000
Source: Private Health Insurance Administration Council
In response, the Government requested an Industry Commission inquiry into Private Health Insurance, the final report of which was released in April 1997. The Industry Commission’s breakdown of the reasons behind increasing premiums is set out in Table 1.
Table 1: Key contributors to real increases in hospital insurance premiums, 1989-90 to 1995-96
Component Contribution to increase in hospital insurance premiums (percent) Changes in admissions per SEU 39.9
Changes in average length of stay -30.3
Shift from public to private 27.4
Private hospital bed day benefits 39.7
Management costs 5.7
Underlying Factors
Ageing (1990-1995) 7.6
Adverse selection (1990-1995) 17.4
Note: 1 The number of SEUs equals the number of single policies plus twice the number of family policies.
Source: Industry Commission (1997), Private Health Insurance, p252
The report heralded some significant changes in Government regulation of the industry. The Government has tried to reverse the decline in coverage through subsidies, Lifetime Health Cover and other changes to the regulatory
environment, in order to lessen pressure on the Government health budget.
Perhaps the most significant feature of Australia’s private health insurance system is community rating. This means that insurers are not allowed to risk discriminate and leads to adverse selection concerns. Lifetime Health Cover has targeted this aspect of the regulatory environment.
On 31 December 1998, the 30% rebate came into effect. As its name suggests, it was a 30% subsidy towards private health insurance and replaced the subsidy provided under the Private Health Insurance Incentives Scheme (PHIIS). It is estimated that the 30% rebate led to a 7% increase in coverage (Butler 2002, p30). The Medicare Levy Surcharge replaced the other part of PHIIS by charging an additional 1% of taxable income for high-income people not privately insured.
In July 2000 Lifetime Health Cover (LHC) was introduced. It penalised late entry into private insurance by imposing a 2% loading on top of a base premium for every year a new entrant is older than 30, up to a maximum 70% loading. LHC has been successful in increasing coverage with the proportion of the population covered by a private hospital table increasing from 31.0% to 43.0% from the announcement of the policy to its implementation (Butler 2002, p31).
Another change in regulation was allowing insurers to cover more of the out-of-pocket expenses of consumers in what is known as no-gap insurance.
This paper develops a general model of the Australian industry and health system and uses this to analyse recent Government policies and industry trends outlined above. Section 2 develops the basic model and introduces some comparative static analysis methods. Section 3 considers shocks to the model, which in many
cases require extension of the basic model developed in the previous section. Section 4 concludes.
2. The Model
Australia’s private health insurance industry can be modelled as a simple relationship between insurance choices and Medicare’s budget allocation - represented in Medicare quality/coverage space. As Medicare quality improves fewer people will be attracted to private health insurance and coverage will fall (the consumer choice curve in Figure 2). On the other hand, a decrease in coverage means that the Government can provide a lower quality of Medicare with a fixed budget (the budget curve in Figure 2). The intersection of these curves gives an equilibrium for private health insurance coverage and Medicare quality.
Figure 2: Private health insurance equilibrium
Coverage (%) 100
Consumer choice curve
Budget curve
Equilibrium 0
To investigate some of the possible properties of the consumer choice curve, a simulation exercise was conducted incorporating adverse selection and
community rating. It is outlined in some detail next.
2.1 The Consumer Choice Curve
Consumers are the main element of the model, as insurers have a generally reactionary role. Consumers are assumed to have an instantaneous utility function of the following form:
[ ]
( ) , 0,1 u c cα α = ∈(1)
c is consumption of a bundle of goods and services. is the level of risk aversion of each consumer. Consumers do not have the same risk attitude ( ). It is instead distributed between zero and one, with one being risk neutral and zero being consumption indifferent. No consumers are risk seeking in terms of their instantaneous utility function.
α
α
Health state utility is assumed to be additively separate to consumption utility and can thus be ignored. This implies that the marginal utility of consumption is unchanging with health state. The empirical literature justifies this separation as there is no clear evidence of changing marginal utility of consumption with health state. Viscusi and Evans (1990) find marginal utility of income increases with health, while Evans and Viscusi (1991) find that the health impact “does not
alter the structure of the utility function in a fundamental way” (p94) and could be modelled as a loss in income. Lillard and Weiss (1997) find that marginal utility of consumption decreases with better health1. There is thus no consensus.
Consumers aggregate utility over health states using rank dependent expected utility (RDEU) as this is empirically favoured over expected utility (Camerer and Ho 1994, Tversky and Fox 1995, Wu and Gonzalez 1996, Prelec 1998). RDEU can change adverse selection results (Ryan and Vaithianathan 2000). Briefly, RDEU in its usual form implies that consumers over-rate extreme events and is formulated as follows: 1 1 1 1 ( ) n i i i i i i j j j U u c h where h w p w p = − = = = = −
∑
∑
∑
j(2)
There are n states of the world. The states are ranked with the state with highest utility given i and the worst state given i n. is the probability weighting of state of the world i. Note that
∑
. That is, the revised probability weights add to one.1 = = hi 1 1 n i i h = = i
p is the probability of state i occurring. w(x) is a function which can be estimated empirically.
1 This has the interesting but questionable implication that utility in different health states must
Assuming only two states occur (well and sick) means the RDEU formulation reduces to:
( ) ( ) (1w ( )) ( )s
U =w p u c + −w p u c
(3)
where p is the probability of being well and the subscripts w and s refer to well and sick states respectively. u c( )w is ranked above u c( )s as health utility is greater when well and, assuming consumers cannot over-insure, consumption utility is also greater when well.
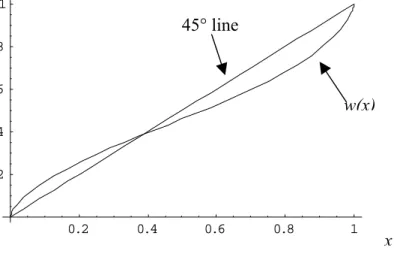
For the function w(x), I adopt an inverse S-shaped empirical estimation of Wu and Gonzalez (1996), which is consistent with other estimations. Wu and Gonzalez estimated the following functional form for w(x) along with a utility function, uα. 1 ( ) ( (1 ) ) x w x x x γ γ γ γ = + −
(4)
Their estimation was γ =0.71, . The used in the model in this paper is not a single number but I will assume identical utility aggregation over
consumers and adopt the Wu and Gonzalez estimation. There is no correlation between risk-type and risk attitude. This gives the graph of w(x) shown in Figure 3.
Figure 3: The probability weighting function (w(x)) 0.2 0.4 0.6 0.8 1 0.2 0.4 0.6 0.8 1 w(x) 45° line x
Note that w(x) = x when x = 0.37. This means for our two state model, if p>0.37 then the consumer is pessimistic as they understate the probability of being well, whilst if p<0.37 the consumer is optimistic.
The consumer’s budget constraint in the well state is:
w
c + =ρ y
(5)
The consumer’s budget constraint in the sick state is:
s
c + + = +ρ S y B
(6)
ρ is the premium paid for insurance (if insurance is not purchased ρ=0), S is the cost of illness and B is the amount by which the insurance company (or
Medicare) reduces the cost of being sick, which is dependent on the premium. Since consumers cannot over-insure B S≤ . S includes both direct and indirect
income costs (e.g. paying the surgeon and the consumer’s waiting and lost income costs).
Consumers are either high risk (h) or low risk (l) in terms of their probability of getting sick. (h and l are also used as the number of high-risk and low-risk people.) The consumer knows his own type whilst the insurance company
doesn’t (or can’t use the information if it is known). This situation of asymmetric information drives the dynamic adverse selection processes that will occur in the model.
All consumers have the same income in the basic model. This assumption will be relaxed later in order to model the Medicare Levy Surcharge.
The consumers described above choose one of the available insurance contracts offered to maximise their RDEU. The available insurance contracts are initially assumed to be full insurance or Medicare, with the insurer not being able to risk discriminate. Insurers make expected profits of zero. Assuming no cross-subsidisation between policies, this gives the premium as:
(
ˆ(1 ) ˆ(1 ))
ˆ ˆ h S h P l P h lρ
= − + − + l(7)
Here S l Pis the dollar amount the insurer incurs if an insured person gets sick, and are the probabilities of being well for high-risk people and low-risk people
h P
respectively and hand l are the numbers of high-risk and low-risk people insured under that policy.
ˆ ˆ
S
I will generally assume that the dollar amount incurred by the insurance company if an insured person gets sick exactly equals the reduction in consumption costs of the individual of being sick.2 That is, S=S. Later in the paper, the effect of changes in costs ( ) are analysed.
Medicare is modelled as free insurance cover provided by the Government which reduces the costs of a consumer’s sickness by mS, where m is in [0,1].
Intuitively, m represents the quality of Medicare. If m equals one, then Medicare provides the same cover as full insurance but at no charge, while if m equals zero, Medicare is equivalent to no insurance.
Modelling Medicare in this way is appropriate as having private insurance does not preclude a person from using Medicare and thus private insurance must be at least as valuable. In terms of direct costs Medicare covers nearly everything, and often more than private insurance. In terms of indirect costs, Medicare often has long waiting times. The quality of treatment in private hospitals might also be considered to be marginally higher than that of public hospitals. How m maps to quality measures such as waiting lists is left for further investigation.
2 The model allows a separation of the dollar benefit to the consumer from the dollar amount
incurred by the insurer. There is reason to suppose they could be different given moral hazard and indirect costs.
To get the consumer choice line the consumer insurance decision is combined with the zero expected profit condition.
A consumer will choose full insurance if the premium is smaller than their risk premium.3 Since the risk premium decreases with decreased risk aversion (increased ), we can solve for threshold values of for high and low risk consumers. Those with a higher will have a lower risk premium and therefore choose Medicare. Those with a lower will have a higher risk premium and thus choose full insurance. The threshold values of are found by the following equations: α α α α α ( ) ( ) (1 ( ))( (1 ) ) ( ) ( ) (1 ( ))( (1 ) ) h h h l l l F M h h h F M l l l U y w P y w P y m S U and U y w P y w P y m S U α α α α α α
ρ
ρ
= − = + − − − = = − = + − − − = h l)
)
(8)
hα
is the threshold value for high-risk consumers and is the threshold value for low risk consumers. The superscripts F and M refer to full insurance and Medicare respectively. The number of people insured is thus high-risk people and lG low-risk people, where G is the distribution function of consumers over risk attitude.l
α
(
hhG α
(
αlUsing the above expressions, letting risk attitude be uniformly distributed4 and remembering that S = =B S gives the modified version of (7):
(
h(1 h) l(1 l))
h l S h P l P h lα
α
ρ
α
α
− + − = +(9)
Equations (8) and (9) fully characterise the equilibrium. If a solution exists with then it is unique (Appendix 1). The system is not solvable explicitly, but is solvable numerically due to the uniqueness of the solution. In addition, a number of comparative static analyses can be conducted on the system.
0
h
α
≠There are two useful diagrammatic representations of this model shown in Figures 4 and 5. Figure 4 shows the equilibrium in (premium, α) space. Each premium line is dependent on the equilibrium amount of the other type of people insuring. The risk premium lines are not dependent on the decision of the other type of people. The equilibrium is where the risk premium and premium line for each type cut at the same premium, where the premium lines are dependent on the other type’s solution.
Figure 5 shows the equilibrium in terms of response functions of high and low risk consumers. These diagrams are useful in analysing the shocks that will be explored in later sections.
4 This assumption is not at all crucial. A peaked distribution function with the same average
Figure 4: Interior solution in (
ρ
,α
) space (for parameters: Ph=0.8, Pl=0.82, m=0.4, h=l, y=10, S=5). 0.2 0.4 0.6 0.8 1 0.9 0.925 0.95 0.975 1.025 1.05 , h l α α * , ) h l ρ α α( ( ) l l rp α ( ) h h rp α * ( ,l h ) ρ α α * h α * l α * ρ PremiumFigure 5: The equilibrium in (
α
l,α
h) space – reaction functions of consumers α(l) Equilibrium position Low-risk reaction function High-risk reaction function 1 α(h) 1 0 Low-risk threshold High-risk thresholdConducting numerical simulations for this model of the consumer choice curve gives some surprising results. Firstly, the slope of the consumer choice curve is extremely steep – that is, small changes in Medicare quality lead to large changes in coverage Figure 6). This is because an increase in Medicare quality
simultaneously makes Medicare more attractive and, through adverse selection, makes full insurance less attractive. In terms of the reaction functions, both shift down.
Figure 6: Medicare quality against coverage
0 20 40 60 80 100 120 0 0.1 0.2 0.3 0.4 0.5 0.6 0.7 0.8 Medicare quality P er cen t co ver ed
2.2 The Budget Curve
Turning now to the other side of model – the Medicare budget allocation. A government can allocate money to Medicare in a variety of different ways. At one extreme is a fixed allocation regardless of how much Medicare is used while at the other is open-ended funding. Australia’s system lies somewhere in
consultation) but fixed budgets for public hospitals. Therefore the budget curve is not at either extreme of steepness or flatness.
2.3 Conclusions from the Equilibrium Model
A significant implication arising from this endogenous Medicare quality model is that the Government may be relatively powerless to change Medicare quality through increased funding. An increase in the Government budget will shift the budget line right so that for a given level of coverage the quality of Medicare will increase. However, as consumers adjust their choices due to the new budget they will move out of private insurance. This process will continue until we arrive at the point where the consumer choice line cuts the new budget constraint. Due to the extreme sensitivity of the consumer choice line, the resulting quality of Medicare will not be much higher than it was originally, while the number of people covered by private health insurance will have fallen substantially. The increased funding has just substituted private funding of medical services for Government funding without significantly improving the quality of the Government services in the long term. In the short term Government funding may increase quality substantially as information on Medicare quality will be slow to emerge.
Instead, Government policy aimed at improving Medicare quality should focus on changing the consumer choice curve through private insurance schemes.
Lifetime Health Cover (LHC) is a good example of such a policy and Hopkins and Frech III (2001) find evidence that the increase in private insurance coverage associated with LHC has led to an increase in Medicare quality.
Similarly, changes to Medicare could be used to increase private health insurance coverage very effectively due to the sensitivity of the consumer choice line.
2.4 Dynamics
The model outlined so far is an equilibrium model, but can also offer insights into the dynamics of the private health insurance industry, using dynamics based on the consumer choice curve. Elements of this dynamic process would be present in the likely scenario that information on Medicare quality is slower to
disseminate than information on premiums.
The insurer is assumed to be very backward looking. It begins by setting a premium based on the expected costs of the entire community. Then the adverse selection process begins as consumers choose whether to insure or not. There will always be a higher (or equal) proportion of the high-risk group choosing to insure at any premium level. This means that the risk profile of the people insured is actually riskier than the insurer has accounted for. In the next period, the insurer increases the premium so that it would make zero expected profits if all those people currently insured maintained their insurance. Again, it is likely
that the risk profile of the insured group will become riskier as low-risk people choose not to insure and the spiral of falling coverage and rising premiums dubbed the ‘adverse selection death spiral’ continues.
In our world, the magnitude of the effects of adverse selection can be very variable. For example, in Figure 7, adverse selection reduces the proportion of people covered by only 3%, whilst in Figure 8 adverse selection leads to market failure.
Figure 7: Adverse selection at its least potent
(Ph=0.5, Pl=0.9, Y=10, S=5, m=0.53, h=1, l=300) 0.5 0.505 0.51 0.515 0.52 1 3 5 7 9 11 13 15 17 19 21 23 25 27 29 Time Prem iu m 70 72 74 76 78 80 82 84 Percen t in su red Premium Coverage
Figure 8: Adverse selection at its most potent (Ph=0.5, Pl=0.9, Y=10, S=5, m=0.5412, h=1, l=300) 0.5 0.51 0.52 0.53 0.54 0.55 0.56 0.57 0.58 0.59 0.6 1 3 5 7 9 11 13 15 17 19 21 23 25 27 29 Time Prem iu m 0 10 20 30 40 50 60 70 Percen t in su red Premium Coverage
An important point to note in Figure 8 is the slowing down of the adverse selection spiral so it appears that equilibrium will be established and then the quick failure of the market. This suggests that there might be some threshold level of coverage in the dynamic process at which the adverse selection effects move into overdrive. A slow decline of Australian coverage might thus be followed quickly by market collapse.
The dynamics of this model are unrealistically simple. For example, the insurers always make losses (without any shocks). If insurers were more forward looking then the adverse selection process would be expected to move faster. At the
extreme case, if both insurers and consumers have perfect foresight then the market would move to its equilibrium position immediately. On the other hand, consumer inertia would cause the process to slow. If randomness were added to the insurance company payouts then the process would also slow as an expected loss could be a signal of inadequate premiums or just a random negative shock.
The dynamic process outlined above must have some bounds due to the Medicare budget curve. This makes the dynamics much more complicated and means that no equilibrium might necessarily be reached. Instead as information on Medicare quality is revealed, consumers might move in herds and coverage and Medicare quality could oscillate.
3. Applications of the Model
The model can be used to explain recent changes in health insurance policy, and to develop future policy. I will analyse cost changes, subsidies, Lifetime Health Cover, the Medicare Levy Surcharge and part-insurance contracts using the model with various extensions. Generally, I will consider how the shocks affect the consumer choice curve, with obvious extension to the entire market using Figure 2.
3.1 Rising costs and subsidies
Treatment costs have been rising in Australia due, amongst other things, to privately insured patients moving from public hospitals to private hospitals. It is likely that the utility benefits from being treated in a private hospital are
insignificant in comparison to the extra costs faced by insurers of private treatment. This means that the consumer choice curve would shift left resulting in both lower private health insurance coverage and lower Medicare quality.
In the long run, health costs have tended to increase faster than inflation. This has been attributed to slow relative productivity growth as healthcare is a labour intensive industry and cost increasing technological change. With costs rising in both public treatment and private treatment there are two effects to consider. If the Government provides money for new treatments through public hospital and Medicare funding then private health insurance becomes more and more
expensive for the consumer in comparison to the unchanged price of Medicare. Coverage therefore decreases. If the Government does not alter its funding of Medicare then there is a relative decrease in funding and both the consumer choice curve and the budget curve shift left resulting in an ambiguous change in coverage but a decrease in (relative) Medicare quality.
Subsidies have the opposite effect to rising costs although there is no utility effect whatsoever. Subsidies thus push the consumer choice curve right – and the model predicts a significant effect on coverage. However, PHIIS and the 30%
rebate did not have much effect. A major reason for this was the lack of no-gap insurance and the subsequent lack of financial attractiveness of private insurance for lower-income earners (supported by Hall et al 1999). A lagged effect from the 30% rebate, effective because of the introduction of no-gap insurance, might therefore be responsible for some of the increase in coverage attributed to LHC.
3.2 The Medicare Levy Surcharge
In order to model the effects of the Medicare Levy Surcharge (discussed in Section 2.4) it is necessary to introduce some sort of heterogeneity of income. I introduce this in the simplest way possible – as two income classes, high and low. There are thus four types of people: high-risk/high-income,
high-risk/low-income, low-risk/high-income and low-risk/low-income. Each type has heterogeneity of risk attitude as well. It is assumed there is no correlation between risk attitude and income, but there may be a correlation between risk type and income.
The Medicare Levy Surcharge is modelled exactly as it is: 1% of income is payed to the Government if the high-income person does not have private insurance.
This gives the following equilibrium equations:
(
)
(
)
(
(1 ) (1 ))
( ) ( )( ) (1 ( ))( (1 ) ) ( ) ( )( ) (1 ( ))( (1 ) ) ( ) ( )( ) (1 ( ))( (1 ) L L h h hL H H H h h L L l l H H L L H H L L L h h h l l l H H L L H H L L h h l l L h L h L L H h H h H L l L l L S h h P l l P h h l l y w P y w P y m S y w P Ay w P Ay m S y w P y w P y m S α α α α α α αα
α
α
α
ρ
α
α
α
α
ρ
ρ
ρ
+ − + + − = + + + − = + − − − − = + − − − − = + − − − ) ( ) ( )( ) (1 ( ))( (1 ) ) L l H H l l L H l H l H y w P Ay w P Ay m S α α αρ
− = + − − − h H α H l H α(10)
The H and L superscripts represent high and low income while h and l remain as high and low risk. A is the proportion of income left after paying the surcharge. So for the numerical calculations it will be 0.99. I have assumed that the
surcharge does not reduce in the sick state of the world, with no private health insurance. This could be questioned, as S could include reducing taxable income and thus reducing the surcharge, but in any case some sort of assumption would have to be made.
The other new assumption that has been made also concerns the fact that the cost of the illness to the consumer is likely to be dependent on income. The high-income people will have a higher cost (SH >SL). Since the cost of treatment to the insurer is independent of whether they are treating a high-income or
low-income person, I have assumed that the cost to the insurer is the cost of sickness of the low-income people.
Medicare is assumed to reduce each income/risk type’s cost by the same proportion.
A non-zero equilibrium of equation (10) is unique in the same way as the original system, although with five unknowns to determine.
Numerical simulations of this model were performed, as once again there is no explicit solution. The heterogeneity of income changes none of the general comparative statics.
Result for the simulation using the following parameter values is reported below: .
0.9, 0.5, 6 , 10, 20, 5, 8, 0.99
l h L H L H
P = P = L= H Y = Y = S = S = A=
L is the number of low-income people and H is the number of high-income. These parameter values reflect Australian Tax Office statistics of 1,444,521 people earning over the $50,000 threshold and 8,691,313 earning less than this amount (ATO 1999). Note that although high-income cost is greater than low-income cost, it is smaller as a proportion of low-income. This captures the fact that sickness involves both a direct cost and an indirect cost. I have assumed no correlation between income and risk-type for the simulation.
Comparing the consumer choice curve under heterogeneous income with that under uniform income, we see that the surcharge has altered the shape of the consumer choice curve, although it is still very steep (Figure 9). (The Medicare quality axis is distorted to make for easier viewing). Figure 9 shows how the surcharge lowers premiums by forcing high-income/low-risk people into the market, which encourages low-income/low-risk people to purchase private insurance.
Figure 9: The quality of Medicare vs coverage and premiums for the basic and two-income models (m axis distorted)
0 20 40 60 80 100 120 0 0.5 0.525 0.53 0.535 0.54 0.545 0.77 Medicare quality (m) Co verag e ( % ) 0.48 0.49 0.5 0.51 0.52 0.53 0.54 0.55 Prem iu m Coverage (basic) Coverage (income) Premium (basic) Premium (income)
The surcharge will have the effect of increasing private health insurance coverage both directly and indirectly. It will increase coverage by those paying the
surcharge being more likely to privately insure. It will also increase coverage indirectly, as the previous effect will put downward pressure on premiums by forcing low-risk/high-income people to insure and this will make insurance more attractive to other groups.
Is lowering the threshold a policy option? In terms of private insurance coverage it certainly is. Even without any action taken to lower the threshold, the real threshold will fall in the future. It is not linked to inflation and therefore bracket creep will gradually move a higher proportion of Australians over the threshold and increase the incentives to privately insure.
3.3 Lifetime Health Cover
Lifetime Health Cover involves elements of both imperfect risk-discrimination and inter-temporal decision-making. The main model developed in this paper is useful only in terms of the former but I will attempt to consider the latter through other models.
3.3.1 Risk discrimination
To model the risk-discrimination aspect of LHC, several adjustments must be made to the basic model. Firstly, two new types of individuals are introduced:
old (O) and young (G).5 The insurers maintain their ambition to make expected profits equal to zero but may charge differing premiums to the two groups.
(1 )
O x G
ρ
= +ρ
(11)
where ρOis the premium charged to old people, ρG is the premium charged to young people and x is a constant decided by the insurers, which I will assume is greater than zero. Cross-subsidisation between old and young is allowed.
There are still only two types of risk, high and low, so that the results will be comparable to those of the basic model. 6 The insurers observe old and young rather than high-risk or low-risk. The proportion of old people who are high-risk is higher than the proportion of young people. There are four groups of people in the model: old/high; old/low; young/high; and young/low. I will assume that income, risk attitude and the costs of being sick are independent of age group.
The system can be characterised by five equations:7
5 I am using G as y is already being used for income.
6 Another way to model this would be to make different probabilities of being sick and high-risk
for old and young people. This would lessen the comparability of the results to the basic model and thus allow less interpretation of the effect of introducing LHC.
(
)
(
)
(
(1 ) (1 ))
(1 )( ) ( (1 )) ( )( ) (1 ( ))( (1 ) ) ( ) ( )( ) (1 ( ))( (1 ) ) ( (1 )) ( )( ) (1 ( ))( (1 O O h h G G G h h h O O l l O O G G O O G G h h h l l l O O O O G G G G h l h l h h h h l l S h h P l l P x h l h l y x w P y w P y m S y w P y w P y m S y x w P y w P y α α α α α α αα
α
α
α
ρ
α
α
α
α
ρ
ρ
ρ
+ − + + − = + + + + − + = + − − − − = + − − − − + = + − − − ) ) ( ) ( )( ) (1 ( ))( (1 ) ) O l G G G l l l l l m S y w P y w P y m S α α α αρ
− = + − − − O h α(12)
The superscripts O and G refer to old and young while h and l refer to high and low-risk types respectively.
For the first numerical simulation, ‘young’ is those aged below 50 while ‘old’ is aged 50 and above. Australian Bureau of Statistics figures (ABS 2001) give this young population as approximately 14 million and the old population as 5.5 million. I will also assume that the ratio of high-risks to low-risks is exactly the same as the ratio of old to young.8 For the second numerical simulation, the latter
assumption is retained but the threshold age is lower, so there is a more even balance between high and low-risk types.
Numerical Simulation Results
Numerous simulations were conducted using the LHC model. The results were similar across simulations: if LHC introduced enough risk discrimination then coverage would jump significantly, otherwise it would converge to the same solution as with no LHC, but much more slowly.
For example, using the following parameters:
0.8, 0.9, 10, 5, 0.39, 50, 50
h l
P = P = y= S = m= Old = Young=
In the basic model equilibrium, no low-risk people insure and not all high-risk people insure. The coverage comes to equilibrium quickly at 37.1% of the population.
Running this simulation and picking the premium loading to give maximum coverage gives the results shown in Figure 10. When knowing a person’s age provides no additional information of their risk-type (Pr(h|O)=0.5), for maximum coverage the premium loading is zero and the basic model equilibrium is
achieved. The same is true up to Pr(h|O)=0.7. Then the degree of
risk-discrimination becomes high enough that, with an appropriate premium loading, a significant proportion of low-risk/young people can be attracted to private insurance at the expense of a small number of high-risk/old people. For Pr(h|O)=0.8 and above, all high-risk people and low-risk young people insure.
Coverage still increases from this point as the amount of low-risk/old people decreases with improving risk-discrimination.
Figure 10: Degree of risk-discrimination vs coverage for second simulation parameters 0 20 40 60 80 100 120 0.5 0.6 0.7 0.8 0.9 1 Pr(h|O) Coverage
This simulation suggested two things, both of which are positive for the private health insurance industry: the risk-discrimination part of LHC will either stabilise the industry at a much greater level of coverage or it will lead to a much slower adverse selection spiral, depending on how closely risk and age are correlated.
For health insurance, age discrimination seems to be a good proxy for risk as shown by Figure 11.9 The level of discrimination available through LHC is
therefore likely to be high enough to impact on the consumer choice curve and hence coverage – which is what we have seen to date.
Figure 11: Age vs benefits per person for private health insurance
0 100 200 300 400 500 600 700 800 900 0 to 45 to 9 10 to 14 15 to 19 20 to 24 25 to 29 30 to 34 35 to 39 40 to 44 45 to 49 50 to 54 55 to 59 60 to 64 65 to 69 70 to 74 75 to 79 80 to 84 85 to 89 90 to 94 95+ Totals Age
Benefits per person ($)
Source: PHIAC, http://www.phiac.gov.au/statistics/trends/index.htm
3.3.2 Inter-temporal decision making
Another important aspect of LHC is the inter-temporal dimension it brings to insurance decisions. LHC increases the period a person must consider in making their insurance decision, as future premiums are related to the decision. Since the future is, by its very nature, uncertain, and uncertainty increases the farther we look into the future, LHC increases consumer uncertainty. The increase in uncertainty means that people are more likely to insure when they are young so they get the benefits of lower premiums in the future if they find they have a high risk of illness. Young people insuring means that premiums fall and encourages
more people to insure, and the young people are more likely to insure in the future due to the lower premiums they have to pay.
The increased time frame forced by LHC also makes expectations of future premiums and industry structure important. For example, if a young person believes that the industry will not exist in the future then they will not insure, as they believe the future net benefits of insuring now will not materialise. On the other hand, if the belief is that Medicare will not exist, then expectations might work in the opposite direction. Multiple equilibria ideas developed in
international macroeconomics can be applied to this sort of situation.
3.4 Part-insurance policies
A question that arises in the framework previously developed, is whether insurers can modify their policies so consumers risk-differentiate themselves. This is a classic argument against insurers claims that they will suffer from asymmetric information problems (first developed by Rothschild and Stiglitz 1976). By specifying both price and quantity in the available insurance contracts, consumer self-selection can lead to a separation of high and low-risk types. High-risks will buy full insurance at a high price, while low risks will buy part insurance at a lower price. However, in the presence of differing risk attitudes as well as risk types, risk differentiation may not be successful. Policies aimed at attracting low-risk people might actually attract less risk-averse people. In the model
developed in this paper, there exist both differing risk-types and risk attitudes so it would seem uncertain whether risk differentiation is a viable option for
insurers.
The Australian industry has been developing policies targeted at low-risk people such as younger people. Insurers are doing a better job than this model can do as they attempt to remove insurance of costly procedures that only affect high-risk groups such as the widely publicised NIB Bodyguard policy, which does not insure for some services such as hip replacements. Targeted policies like this, using correlations between diseases and risk-type, would be effective in improving the risk-profile of the people with private insurance. However, the Government is unlikely to allow insurers to begin a program of widespread elimination of diseases from insurance policies, as it undermines the community rating principle.
The policies I will consider will not be targeted, but merely part-insurance policies. Instead of relieving the consumer of all the costs associated with sickness a part-insurance policy will only remove a proportion of these costs (r). I will also assume initially that there is no cross-subsidisation between policies. This is altered in the simulations and makes no difference to the conclusions.
(
)
(
)
max( ,0)(1 ) max( ,0)(1 ) max( ,0) max( ,0) min( , )(1 ) min( , )(1 ) min( , ) min( , ) ( ) ( ) (1 ( ))( (1 ) ) ( ) m m m h h h m l r f r f h h h l l l r f r f r h h l l f m f m h h h l l l f f m f m h h l l f h h f S h P l P h l S h P l P h l y w P y w P y m S y α α α αα
α
α
α
ρ
α
α
α
α
α α
α α
ρ
α α
α α
ρ
ρ
− − + − − = − + − − + − = + − = + − − − − = ( ) (1 ( ))( (1 ) ) ( )( ) (1 ( ))( (1 ) ) ( ) (1 ( ))( (1 ) ) ( )( ) (1 ( ))( (1 ) )(13)
m m l l r r h h r r h h r r l l l l r r h h h h r r l l w P y w P y m S w P y w P y r S w P y w P y m S w P y w P y r S α α α α α α α αρ
ρ
ρ
ρ
+ − − − − + − − − − = + − − − − + − − − − = ( ) (1 ( ))( (1 ) ) ( ) ( )( ) (1 ( ))( (1 ) ) ( ) ( )( ) (1 ( ))( (1 ) ) r r l l f f f h h h f f f l l l l l f r r h h f r r l l w P y w P y m S y w P y w P y m S y w P y w P y r S α α α α α α α αρ
ρ
ρ
ρ
ρ
ρ
+ − − − − = − + − − − − − = − + − − − − rρ is the part-insurance premium, ρfis the full insurance premium. The six
utility equalisation equations find the risk averseness such that the following give the same utility: full insurance and Medicare ( ); full insurance and part insurance ( , m h l α αm , f f h l
α α ); and part insurance and Medicare ( ). The [0,1] risk attitude interval can then be divided up as the more risk averse a person is (the lower is α), the more insurance they will want. Maximum and minimum
,
r h l
functions must be used so that negative values of the number of people insured in one of the policies cannot occur.
If cross-subsidisation occurs the two zero expected profit equations merge to become one and an exogenous loading factor must be specified to distinguish the premiums of full and part insurance.
Numerical Simulation Results
Numerical simulations found that there was no scope for risk-differentiation. If the premium for the part-insurance policy was initially low enough, then low-risk types took up part-insurance and high-risk took up full insurance. Once the insurer adjusted premiums to reflect the risk-profile, all consumers found part-insurance more attractive. The presence of high-risk people in part-part-insurance drove out the low-risk people and the high-risk moved back to full insurance. The next period the insurer could again offer part-insurance and continue the cycle. The attempted risk-differentiation just extended the period over which insurers made losses. Cross-subsidisation made no difference to the simulation results.
These results coincide with those of Newhouse (1982, p113):
Those who are below average in demand for services (or below their group’s average) always have an incentive to form a separate group; the remaining bad risks then will attempt to remerge with the good risks and the process keeps repeating itself.
The model predicts that non-targeted risk differentiation through part-insurance policies is not an effective policy for insurers in the long-run.
The other problem insurers must contend with in risk-differentiation is that a part-insurance policy may just move existing members to a lower policy rather than reaching new members.
4. Conclusions
The model set out in this paper has wide ranging implications for Government private health insurance policy. It supports the view expressed by the Industry Commission (1997, p.384) that:
Private health insurance is a cog in a machine. One can burnish the gears of that cog, but ultimately its performance and functioning depend on the rest of the machine.
Private health insurance must be considered in conjunction with the rest of the health system as the quality of Medicare is a key determinant of coverage. The Government should consider both private insurance and Medicare outcomes when formulating policies for either of these sectors.
The model finds that the best methods of increasing Medicare quality will depend on changes in private health insurance. Simply increasing expenditure on
Medicare will replace private expenditure with public expenditure in the long run. A policy such as Lifetime Health Cover will increase the quality of
Medicare much more effectively. The remarkable success of this policy, in turn, was shown to revolve around risk-discrimination and bringing an inter-temporal dimension to private insurance decisions, rather than financial outlays by the Government.
The shape of an adverse selection death spiral is explicitly modelled. The results indicate that slowly falling coverage does not necessarily imply that the industry is converging to an equilibrium. At some level of coverage the death spiral moves into overdrive and the industry vanishes very quickly. The relationship between Medicare quality and private health insurance coverage is likely to mitigate this effect.
The model finds limited scope for risk-differentiation by insurers through part-insurance policies. For these policies to be both significant and effective, targeting of particular medical conditions would have to occur, which would contradict the community rating regulations.
So where will Australia’s private health insurance industry end up in twenty years? The answer will be determined entirely by the broader framework of Australia’s health system and regulation. In the shorter term, will the financial losses of the private insurers and increases in premiums after the recent spate of regulatory changes continue? I would suggest that the insurance system post-LHC is likely to be much more stable than before. If a new downward spiral
occurs, it will be slower and policy makers will have time to reconsider private health insurance objectives and policies. The downward spiral is also likely to be due more to the problem of healthcare costs rising faster than inflation than adverse selection. If the industry stabilises completely then policy-makers can claim total success, but at this stage that looks unlikely.
Appendix 1: Uniqueness of Basic Model
Claim: If a non-zero coverage solution of the basic model exists, then it is
unique.
Proof: The proof amounts to a proof that the reaction functions will intersect at
most once within the boundaries of the Figure 4. Or if they intersect on the boundary there is only one optimal point of intersection.
The first part is proved by showing that the high-risk reaction function slopes upward and the low-risk reaction function slopes downwards within the boundaries.
First, by partial differentiation of the zero expected profit curve the following equations are obtained:
2 ( ) 0 as ( ) l l h l h h l Sh l P P P P h l
α
hρ
α
α
α
− ∂ = ≥ ∂ + >(A.1)
2 ( ) 0 as ( ) h l h l l h l Sh l P P P P h lα
hρ
α
α
α
− ∂ = − ≤ > ∂ +(A.2)
Now consider the high-risk reaction function. If the number of low-risk people increases the premium falls (by (A.2) and as within boundary). This means that the marginal high-risk person now decides to insure and the
proportion of high-risk people insured increases. Therefore the high-risk reaction function is upward sloping. There are secondary effects of the increase in the number of high-risk people insured – this puts upward pressure on the premium.
0
h
α >
For the low-risk reaction function: If the number of high-risk people insuring increases then the premium increases (by (A.1) and as within boundary). This means that the marginal low-risk person now chooses not to insure and the proportion of low-risk people insuring falls. Therefore the low-risk reaction function is downward sloping. The secondary effects are that the increase in the number of low-risk people puts downward pressure on the premium.
0
l
α >
Therefore, within the boundaries there is a unique solution.
References
Australian Bureau of Statistics (ABS) (2001), Catalogue No. 3201.0, “Population by Age and Sex, Australian States and Territories”, Table 9.
Australian Tax Office (ATO) (2000), Taxation Statistics 1999-2000,
www.ato.gov.au/content/businesses/downloads/PERTable5A.pdf.
Butler, James RG (2002), “Policy change and private health insurance: Did the cheapest policy do the trick?”, Australian Health Review, 25(6), pp.26-34.
Camerer, Colin F. and Ho, Teck-Hua (1994), “Violations of the Betweenness Axiom and Nonlinearity in Probability”, Journal of Risk and Uncertainty, 8, pp.167-196.
Evans, William N. and Viscusi, W. Kip (1991), “Estimation of State-Dependent Utility Functions Using Survey Data”, The Review of Economics and Statistics, 73(1), pp.94-104.
Hall, J., De Abreu Lourenco, R. and Viney R. (1999), “Carrots and Sticks – the fall and fall of private health insurance in Australia”, Health Economics, 8, pp.653-660. Hopkins, Sandra and Frech III, H.E (2001), “The Rise of Private Health Insurance in
Australia: Early Effects on Insurance and Hospital Markets”, The Economic and Labour Relations Review, 12(2), pp.225-238.
Industry Commission (1997), Private Health Insurance, Report No.57, Industry Commission, Canberra.
Lillard, Lee A. and Weiss, Yoram (1997), “Uncertain Health and Survival: Effects on End-of-Life Consumption”, Journal of Business and Economics Statistics, 15(2), pp.254-268.
Newhouse, J.P (1982), “Is Competition the Answer?”, Journal of Health Economics,1, 109-116.
Prelec, Drazen (1998), “The Probability Weighting Function”, Econometrica, 66(3), pp.497-527.
Private Health Insurance Administration Council (PHIAC), http://www.phiac.gov.au/statistics/trends/index.htm.
Rothschild, Michael and Stiglitz, Joseph (1976), “Equilibrium in Competitive Insurance Markets: An Essay on the Economics of Imperfect Information”, Quarterly Journal of Economics, 90(4), pp.630-649.
Ryan, Matthew J. and Vaithianathan, Rhema (2000), “Adverse Selection and Insurance Contracting: A Non-Expected Utility Analysis”, mimeo, December.
Tversky, Amos and Fox, Craig R. (1995), “Weighing Risk and Uncertainty”,
Psychological Review, 102(2), pp.269-283.
Viscusi, W. Kip and Evans, William N. (1990), “Utility Functions that Depend on Health Status: Estimates and Economic Implications”, American Economic Review, 80(3), pp.353-374.
Wu, George and Gonzalez, Richard (1996), “Curvature of the Probability Weighting Function”, Management Science, 42(12), pp.1676-1690.
NCEPH PUBLICATIONS
National Centre for Epidemiology and Population Health: P u b l i c a t i o n s
NCEPH Working Papers
Working Paper No. 1
Aboriginal Mortality in Central Australia, 1975-77 to 1985-86: a comparative analysis of levels and trends
Khalidi NA April 1989
ISBN 0 7315 0801 7
Published in A Gray (Ed) A Matter of Life and Death: Contemporary Aboriginal Mortality, Aboriginal Studies Press 1990
ISBN 0 5575 291 X
Working Paper No. 2
Discovering Determinants of Australian Aboriginal Population Health
Gray A May 1989
ISBN 0 7315 0629 4
Working Paper No. 3
Predicting the course of AIDS in Australia and evaluating the effect of AZT: a first report
Solomon PJ, Doust JA, Wilson SR June 1989
ISBN 0 7315 0660 X
Working Paper No. 4 The Medicover Proposals
Deeble J August 1989 ISBN 0 7315 0737 1
Working Paper No. 5
Intergovernmental relations and health care
Butler JRG August 1989
Published as 'Health Care' in B Galligan, O Hughes, C Walsh (Eds), Intergovernmental Relations and Public Policy, Allen and Unwin, Sydney, 1991, pp 163-89
ISBN 0 7315 0740 1
Working Paper No. 6
Aboriginal Fertility: trends and prospects
Gray A October 1989
Published in Journal of the Australian Population Association, vol 7, 1 May 1990,
pp 57-77
ISBN 0 7315 0809 2
Working Paper No. 7
The public versus the policies: the ethical basis of Australian retirement income
Working Paper No. 8
Aboriginal Fertility in Central Australia
Khalidi NA November 1989 ISBN 0 7315 0825 4
Working Paper No. 9
The Dynamics of Community Involvement in Old Age: the syndrome of underuse
McCallum J November 1989 ISBN 0 7315 0826
Working Paper No. 10
Noncontributory Pensions for Developing Countries: rehabilitating an old idea
McCallum J December 1989 ISBN 0 7315 0838 6
Working Paper No. 11
Predicting the Prevalence of a Disease in a Cohort at Risk
Mackisack M, Dobson AJ, Heathcote CR December 1989
ISBN 0 7315 0839 4
Working Paper No. 12
The Changing Pattern of Coronary Heart Disease in Australia
Heathcote CR, Keogh C, O'Neill TJ December 1989
ISBN 0 7315 0839 4
Working Paper No. 13
Analysis of Components of Demographic Change
Gray A March 1990
Published in Mathematical Population Studies 1991, 3:1, pp 21-38
ISBN 0 7315 0877 7
Working Paper No. 14
Day Surgery: cost reducing technological change?
Butler JRG April 1990
ISBN 0 7315 0889 0
Working Paper No. 15
Disease and the Destruction of Indigenous Populations
Kunitz SJ April 1990
NCEPH PUBLICATIONS
Working Paper No. 16
Projections of Acquired Immune Deficiency Syndrome in Australia using Data to the end of September 1989
Solomon PJ, Fazekas de St Groth C, Wilson SR
April 1990
ISBN 0 7315 0889 0
Working Paper No. 17
Fluoridation of Public Water Supplies and Public Health: an old controversy revisited
Hill AM, Douglas RM June 1990
ISBN 0 7315 0910 2
Working Paper No. 18
Do Treatment Costs Vary by Stage of Detection of Breast Cancer?
Butler JRG, Furnival CM, Hart RFG July 1990
ISBN 0 7315 1000 3
Working Paper No. 19
Repetition Strain Injury in Australia: Medical Knowledge and Social Movement
Bammer G, Martin B August 1990 ISBN 0 7315 1095 X
Working Paper No. 20
Occupational Disease and Social Struggle: the case of work-related neck and upper limb disorders
Bammer G August 1990 ISBN 0 7315 1096 8
Working Paper No. 21
Australian Mandatory Retirement Challenged
McCallum J November 1990 ISBN 0 7315 1148 4
Working Paper No. 22
Nonlinear Component of Variance Models
Solomon PJ, Cox DR January 1991 ISBN 0 7315 1144 1
Working Paper No. 23
A Model for Estimating the Incremental Cost of Breast Cancer Screening Programs
Butler JRG, Hart RFG February 1991 ISBN 0 7315 1197 2
Working Paper No. 24
The Neurogenic Hypothesis of RSI
Working Paper No. 25
The Means Test on the Japanese Kosei Pension: Wages versus hours adjustment
Keiko S, McCallum J August 1991 ISBN 0 7315 1269 3
Working Paper No. 26
Tax Expenditures on Health in Australia: 1960-61 to 1988-89
Butler JRG, Smith JP August 1991 ISBN 0 7315 1269 3
Working Paper No. 27
Blood Donation and Human Immunodeficiency Virus Infection: do new and regular donors present different risks?
Jones ME, Solomon PJ December 1991 ISBN 0 7315 1328 2
Working Paper No. 28
Fiscal Stress and Health Policy in the ACT
Butler JRG, Neill AL December 1991 ISBN 0 7315 1329 0
Working Paper No. 29
AIDS in Australia: reconstructing the epidemic from 1980 to 1990 and predicting future trends in HIV disease
Solomon PJ, Attewell EB December 1991
ISBN 0 7315 1355 X
Working Paper No. 30
The Health of Populations of North Queensland Aboriginal Communities: change and continuity
Kunitz SJ, Santow MG, Streatfield R, de Craen T
June 1992
ISBN 0 7315 1402 5
Working Paper No. 31
The Relevance of Concepts of Hyperalgesia to "RSI"
Cohen M, Arroyo J, Champion D November 1992
ISBN 0 7315 1447 5
With 7 commentaries in G Bammer (Ed) Discussion Papers on the Pathology of Work-Related Neck and Upper Limb Disorders and the Implications for Diagnosis and Treatment
ISBN 0 7315 1447 5
Working Paper No. 32
Overuse Syndrome and the Overuse Concept
Fry HJH January 1993 ISBN 0 7315 1507 2
NCEPH PUBLICATIONS
Working Paper No. 33
Issues in Conducting a Cost-Benefit Analysis of Lead Abatement Strategies
Butler JRG January 1994 ISBN 0 7315 1899 3
Working Paper No. 34
Supporting Aboriginal Health Services: a program for the Commonwealth
Department of Human Services and Health. (Also titled: Beyond the Maze)
Bartlett B, Legge D December 1994 ISBN 0 646 22396 8
Working Paper No. 35
Cost Benefit Analysis and Mammographic Screening: A Travel Cost Approach
Clarke PM March 1996 ISBN 0 7315 2423 2
Working Paper No. 36
Paving the Way for the Cost-effective Reduction of High Cholesterol: Achieving Goals for Australia’s Health in 2000 and Beyond
Antioch KM, Butler JRG, Walsh MK June 1996
ISBN 0 7315-2424 1
Working Paper No. 37
Economic Aspects of Lower Urinary Tract Symptoms in Men and Their Management
Butler JRG November 1996 ISBN 0-7315- 2542 6
Working Paper No. 38
A Microsimulation Model of the Australian Health Sector: Design Issues
Butler JRG December 1996 ISBN 0 7315 2542 7
Working Paper No. 39
Cardiovascular Disease Policy Model: A Microsimulation Approach
Mui SL January 1997 ISBN 0 7315 2546 9 Working Paper No. 40
The Economic Value of Breastfeeding in Australia
Smith JP, Ingham LH, Dunstone MD May 1998
ISBN 0 7315 2879 4
Working Paper No. 41
Valuing the Benefits of Mobile Mammographic Screening Units Using the Contingent Valuation Method
Clarke PM August 1998 ISBN 0-7315-2896-4 Working Paper No. 42
Integrated Health Records
Mount C, Bailie R April 1999
ISBN 0-7315-3316-X Working Paper No. 43
Estimating Elasticities of Demand for Private Insurance in Australia
Butler JRG May 1999
ISBN 0-7315-3317-8 Working Paper No. 44
Policy Change and Private Health
Insurance: Did the Cheapest Policy do the Trick
Butler JRG October 2001 ISBN 0-9579769-0-9 Working Paper No. 45
Coinsurance Rate Elasticity of Demand for Medical Care in a Stochastic Optimization Model
Sidorenko, A November 2001 ISBN 0-9579769-1-7 Working Paper No. 46
Estimating disease-specific costs of
GP services in Australia
Butler JRG Britt H
November 2001 ISBN 0-9579769-2-5 Working Paper No. 47
The Pasts and Futures of Private Health Insurance in Australia
Quinn C December 2002 ISBN 0-9750180-1-9
NCEPH PUBLICATIONS
NCEPH Discussion Papers
NCEPH Discussion Paper No. 1
W(h)ither Australian General Practice?
Douglas RM, Saltman DC 1991
ISBN 0 7315 1319 3
NCEPH Discussion Paper No. 2 Health Information Issues in General Practice in Australia
Douglas RM, Saltman DC (Eds) 1991
ISBN 0 713 1318 5
NCEPH Discussion Paper No. 3 Integrating General Practitioners and Community Health Services
Saltman DC, Martin C, Putt J 1991
ISBN 0 7315 1323 1
NCEPH Discussion Paper No. 4
Speaking for Themselves: Consumer Issues in the Restructuring of General Practice
Broom DH 1991
ISBN 0 7315 13177
NCEPH Discussion Paper No. 5
Too Many or Too Few?: Medical Workforce and General Practice in Australia
Douglas RM, Dickinson J, Rosenman S, Milne H 1991
ISBN 0 7315 1350 9
NCEPH Discussion Paper No. 6 Money Matters in General Practice Financing Options and Restructuring
Veale BM, Douglas RM 1992
ISBN 0 7315 1324 X
NCEPH Discussion Paper No. 7
Everyone's Watching: Accreditation of General Practice
Douglas RM, Saltman DC 1992
ISBN 0 7315 1409 2
NCEPH Discussion Paper No. 8
Teaching Teaches! Education about and for general practice through the divisional structure
Douglas RM, Kamien M, Saltman DC (Eds) 1993
ISBN 0 7315 1568 4
NCEPH Discussion Paper No. 9 Rural Health and Specialist Medical Services
Stocks N, Peterson C
Advancing General Practice through Divisions
McNally CA, Richards BH, Mira M, Sprogis A, Douglas RM, Martin CM
1995
ISBN 0 7315 2136 6
NCEPH Discussion Paper No. 11
Proceedings of the General Practice Thinktank
Douglas RM (ed) 1995
ISBN 0 7315 2162 5
NCEPH Discussion Paper No. 12
Mixed Feelings: Satisfaction and Disillusionment Among Australian General Practitioners
Bailie R, Sibthorpe B, Douglas RM, Broom Dorothy, Attewell R, McGuiness C 1997
ISBN 0 7315 28190
NCEPH Discussion Paper No. 13
Discontent and Change: GP Attitudes to Aspects of General Practice Remuneration and Financing
Sibthorpe B, Bailie R, Douglas RM, Broom D 1997
ISBN 0 73152820 4
NCEPH Discussion Paper No. 14
Summary Proceedings of the Health on Line Discussion Forum
Edited by Mount C 1998
ISBN 0 7315 2795 X
NCEPH Discussion Paper No. 15
Proceedings of the Second Health on Line
Discussion Forum
Edited by Mount C 1998
ISBN 0 7315 2895 6
NCEPH Discussion Paper No. 16 Proceedings of the Third Health on Line
Discussion Forum
Editor Douglas RM 1998
ISBN 0-7315-4619-9
NCEPH Discussion Paper No. 17 Aboriginal Health Initiatives in Divisions of General Practice
During the Move to (Outcomes Based) Block Grant Funding 1998-1999
Sibthorpe Beverly, Meihubers Sandra, Griew Robert, Lyttle Craig and Gardner Karen ISBN 0-7315-3327-5
NCEPH PUBLICATIONS
Working papers: Record Linkage Pilot
Record Linkage Pilot Study Working Paper No. 1
The NCEPH Record Linkage Pilot Study: A preliminary examination of individual Health Insurance Commission records with linked data sets
McCallum J, Lonergan J, Raymond C 1993
ISBN 0 7315 1880 2
Record Linkage Pilot Study Working Paper No. 2
The New "SF-36" Health Status Measure: Australian Validity Tests
McCallum J 1994
ISBN 0 7315 2045 9
(No further papers to appear in this series)
W o r k i n g p a p e r s i n W o m e n ’ s H e a l t h
Working Papers in Women's Health No. 1 Advancing Australian women's health: time for a longitudinal study. A report for researchers and health planners
Sibthorpe B, Bammer G, Broom D, Plant A 1993
ISBN 0 7315 1824 1
Working Papers in Women's Health No. 2 Advancing Australian women's health: time for a longitudinal study. A community report
Sibthorpe B, Bammer G, Broom D, Plant A 1993
ISBN 0 7315 1828 4
Working Papers in Women's Health No. 3 From Hysteria to Hormones: Proceedings of National Women’s Health Research
Workshop
Broom, Dorothy & Mauldon, Emily (eds) 1995
ISBN 0 7315 2170 6
(No further papers to appear in this series)
Feasibility Research into the Controlled Availability of Opioids St